-
Paper Information
- Paper Submission
-
Journal Information
- About This Journal
- Editorial Board
- Current Issue
- Archive
- Author Guidelines
- Contact Us
Resources and Environment
p-ISSN: 2163-2618 e-ISSN: 2163-2634
2021; 11(1): 18-34
doi:10.5923/j.re.20211101.03
Received: Jan. 13, 2021; Accepted: Feb. 25, 2021; Published: Mar. 20, 2021

Assessing the Risks from Changing Climate in South Texas Region
 Abstract
 Reference
 Full-Text PDF
 Full-text HTML
E. C. Merem 1, Y. A. Twumasi 2, J. Wesley 1, D. Olagbegi 1, M. Crisler 1, C. Romorno 1, M. Alsarari 1, P. Isokpehi 1, M. Alrefai 1, S. Ochai 3, E. Nwagboso 4, S. Fageir 5, S. Leggett 6
1Department of Urban and Regional Planning, Jackson State University, 101 Capitol Center, Jackson, MS, USA
2Department of Urban Forestry and Natural Resources, Southern University, Baton Rouge, LA, USA
3African Development Bank, AfDB, 101 BP 1387 Avenue Joseph Anoma, Abidjan, AB 1, Ivory Coast
4Department of Political Science, Jackson State University, 1400 John R. Lynch Street, Jackson, MS, USA
5Department of Criminal Justice and Sociology, Jackson State University, 1400 John R. Lynch Street, Jackson, MS, USA
6Department of Behavioral and Environmental Health, Jackson State University, 350 Woodrow Wilson, Jackson, MS, USA
Correspondence to: E. C. Merem , Department of Urban and Regional Planning, Jackson State University, 101 Capitol Center, Jackson, MS, USA.
| Email: |  |
Copyright © 2021 The Author(s). Published by Scientific & Academic Publishing.
This work is licensed under the Creative Commons Attribution International License (CC BY).
http://creativecommons.org/licenses/by/4.0/

The yearly dose of havoc unleashed from the overwhelming forces of changing climatic parameters on coastal communities does not differentiate among boundaries when inflicting damages of any kind. For that, in the last several years, climate risks continue to plague the southern portion of Texas. Give its location, the South Texas’ region, and adjourning areas along the Gulf of Mexico as a hub for speculative capital and natural resource extraction face exposures from the menace of tropical storms of immense scales. The ferocious pressures from heavy storms in these settings are such that, they often leave in their wake indelible footprint on the surrounding ecology. This comes with extreme impacts on both the natural and built-up environments particularly around big cities holding vital infrastructure crucial in economic development and productive capacity of petroleum and natural resource assets of South Texas. While the situation is further compounded by the region’s propensity to natural disasters and the fragile coastal ecosystem close to enormous network of large-scale energy infrastructure made up of oil and gas fields, refineries, and pipelines. The presence of petrochemical complexes, thriving natural resource base, transportation corridors, burgeoning urban centers, and neighborhoods often at the receiving end of recurrent climate hazards over time, increases the inherent risks, due to environmental, physical, and socio-economic and policy factors located within the larger regional ecosystem. Yet, current studies in climate change have done very little in assessing the situation in south Texas region with the latest advances in geospatial information technology under a mix scale orientation. Considering these voids in research, this paper assesses changing climate impacts in the South Texas region using secondary data analyzed with descriptive statistics and (GIS) Geographic Information System under a mix scale method. With emphasis on the issues, trends, impacts, factors, and mitigation measures. The results revealed widespread occurrence of climatic hazards in the study area with visible impacts in the form of heavy floods from storms leading to environmental damages. This involves also risks to petroleum amenities and displacement of citizens and the loss of properties. The GIS mapping of the trends pinpointed clusters of heavy presence of stressors and degraded amenities dispersed across space over time with linkages to socio-economic, physical, and ecological elements. To remedy the situation, the paper proffered numerous solutions ranging from the adoption of effective policy, growth management, monitoring, the design of a regional climate information systems and education of the public.
Keywords: Changing Climate, GIS, South Texas, Region, Natural Disasters, Risks, Factors, Impacts, Infrastructure
Cite this paper: E. C. Merem , Y. A. Twumasi , J. Wesley , D. Olagbegi , M. Crisler , C. Romorno , M. Alsarari , P. Isokpehi , M. Alrefai , S. Ochai , E. Nwagboso , S. Fageir , S. Leggett , Assessing the Risks from Changing Climate in South Texas Region, Resources and Environment, Vol. 11 No. 1, 2021, pp. 18-34. doi: 10.5923/j.re.20211101.03.
Article Outline
1. Introduction
- The yearly pains from climate change risks are always real given the dangers posed to affected communities who endure recurrent disasters amidst unsubstantiated doubts from sceptics. The elevation of such absurdity in public discourse over climate science impedes mitigative measures deemed essential in the protection of innocent citizens, economic assets, and the ecosystem [1-8]. Yet, on top of that, when events like Hurricane Harvey struck Rockport, Texas as a Category 4 with 130 mph winds on August 25, 2017. The initial pause over 24 hours around the Houston area never spared the zone from the dumping of heavy downpours. Aside from the initial meandering of the storm and the eventual land fall that followed, 2 sites within the proximity of the major petroleum hub at Port Arthur, Texas saw over 60 inches of rain, an all-time high in the entire nation during a tropical storm. All in all, Hurricane Harvey not only dumped over 30 inches of rain on 6.9 million people, another 1.25 million experienced over 45 inches as 11,000 citizens soaked in over 50 inches as well [9-13]. For that, in the last several years, climate risks continue to plague South Texas. Given its location and the adjourning areas along the Gulf of Mexico, the region as a hub for vast speculative capital and natural resource extraction and energy infrastructure, face recurrent exposures from the menace of tropical storms of immense scales [14]. But with global warming looming considering the projected hazards from rising sea levels, property ownership in low lying areas could become risky ventures and potential shoreline relics [15,16,17]. In as much as Texas has been repeatedly touted as a world leader in the fight against climate change risks [18,19,20,21]. Continual negation of the dangers of climate change during long term planning events, could expose the state to the harsh brunt of immediate disasters [22]. Given that many people rightfully, flaunt the state’s economic growth [23], what is often forgotten stems from the huge ecological liability from such fiscal turn around [24]. Accordingly, the current projections directed at the next couple of years point to higher levels of hotness and prolonged forms of dangerous droughts. Under such condition, areas prone to lower precipitations risk unprecedented aridity as parts of the state’s 367-mile Gulf coast will experience sea level rise and violent storms amidst fluctuations in deep sea temperature [25,26,27]. From a warming environment, expanding volumes of water in oceans and the melt down of glaciers are driving sea level rise. In that vein, the largest sea-level rise in the US which is expected along the western Gulf of Mexico threatens the study area [28] known for its more than 3,359 miles of tidal coastal line. Since significant proportion of the state’s population are concentrated along the coast, Texas risks $30 billion damages to its costal assets from extreme tidal floods by 2050. With climate change induced storms destined to rise [29,30], the average costs of flood disasters have been put at about $222 million annually by 2030.The presence of petrochemical complexes [31,14,24], thriving natural resource base, transportation corridors, burgeoning urban centers and neighborhoods often at the receiving end of climate hazards will amplify the risks, due to environmental, physical and socio-economic and policy factors located within the larger regional ecosystem [14]. Considering Texas energy intense economy and infrastructure, the state ranks high among the chief sources of global warming. Every year, Texas emits large volumes of greenhouse gases than any other state in the nation, and much of its growth emanates from an energy boom that depends on the activities of pollution intensive petroleum sector in the south [32]. For that, the effects of climate change on South Texas are so obvious that elevated temperatures have not only aggravated the multi period dryness that trigger sporadic rain from the basins [33], but sea levels on parts of Texas’ Gulf Coast rose by 12 inches during the last 20th century because of global warming. This is anticipated to jump further in the 21st century. Compounding the matter, the state regulator, Texas Commission on Environmental Quality (TCEQ) disregards the emission of greenhouse gases as ecological risks. In the process, changing climate is expected to impact the state severely in the foreseeable future than other places in the nation [34-38]. Unsurprisingly, Houston [39] has become accustomed to 5 days of more than 100ºF and the city remains on the brink of 70 days more than 100ºF based on elevated emissions, and a mean midyear temperature rise of 5.7ºF in 2100. Said that, climate change has been causing more nuisance flooding in South Texas as the state now has 127,000 people at the risk of coastal inundation, while in 2050, another 117,000 residents will face heavy barrage from sea level rise. In all these, let no one ignore how a 7-day rainfall totals during Hurricane Harvey caused $128 billion in damages and killed 89 people. Along Harris County which covers Houston, about 1 trillion gallons of H2O fell in 4 days [40,41,39]. Also, the fact that Texas posted record tax revenue of $13.8 billion in 2015 from the oil sector amidst rising greenhouse gas emission levels [42], the fiscal damages from Harvey in 2017 makes the study far more important than ever for managers. Yet, current studies on climate change have done very little in assessing the situation in south Texas region with the latest advances in geospatial information technology under a mix scale orientation [43,44,45]. Seeing these voids in research, this paper assesses changing climate impacts in the South Texas region using secondary data analyzed with descriptive statistics and (GIS) Geographic Information System under a mix scale method. In terms of the objectives, the study has five aims centered on the need to update the literature on regional climate change and assessment of current issues in climate uncertainties in coastal zones. The other objectives include the use of mix-scale techniques including spatial tools of GIS and descriptive statistics in climatic change assessment, the design of emergency management index for tracking shifting climatic parameters across regional boundaries and development of feasible schemes germane to multi county areas in a region. On the organizational side, the paper is divided into five parts. The first and second portions presents the introduction and methods while parts three and four contain results, impacts, and factors and discussions. Section five offers the closure of the enquiry.
2. Methods and Materials
- The study area of South Texas in the coastal plains of the state adjacent to the Gulf of Mexico, spans over tens of thousands of square miles through two dozen counties (Figure 1). The coastal saline prairies area therein covers about 3.2 million acres along a narrow strip of adjacent wet lowlands. This includes the barrier islands that extend from Mexico to Louisiana as well as the Baffin Bay and Rio-Grande Delta. Just as the surface is only a few feet above sea level with many areas of salt-water marsh, drainage is very slow in some of the areas. Being an area where the soils are always saturated, soft, and carry only little weight. The zone also contains many lakes, bayous, tidal channels, and artificial canals with greater susceptibility to flooding either by fresh water drained from lands adjacent to the marsh or by saltwater from the Gulf of Mexico. As an important region in the state of Texas, the study area not only provides habitat for fisheries, but it contains different life forms listed as rare and endangered, and able to flourish in such unique ecosystems. This includes barrier island dunes, beaches, and sea grasses along with varying state climate from east to west. In the zone as well, warm moist air from the Gulf of Mexico often sweeps westward across the state while losing moisture in the process [46-49].
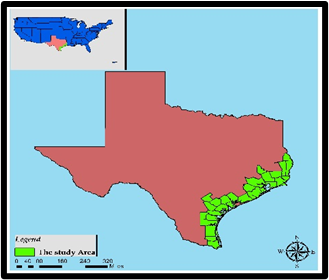 | Figure 1. The Study Area South Texas |
2.1. Methods Used
- The paper uses a mix scale approach involving descriptive statistics and secondary data connected to GIS to assess the changing climatic parameters together with the related issues in the South Texas region of the US over the last couple of years. The spatial information for the enquiry was obtained principally from several agencies consisting of the United States Department of Energy Department (US DOE), The United States Energy Information Administration (US EIA), the United States Geological Survey (USGS) and the University of Arizona. Other sources of spatial info originated from the Federal Emergency Management Administration, The National Oceanic and Atmospheric Administration (NOAA), The National Agency for Space Administration (NASA), the United States Bureau of Ocean Energy Management, Tetratech and Natural Resources Defence Council. In addition to that, Climate Central, Accucentre, Dartmouth Flood Observatory, S and P Global Platts, Yale Program on Climate Communication, the National Weather Center and the West Gulf River Forecast Center also offered other essential information in the research. Generally, for the most part, climate risks indices relevant to the South Texas region and the counties were obtained from the Oak Ridge National Laboratory, the US Army Corps of Engineers, The City of Houston, the US Department of the Interior (DOI) and the Environmental Defence Fund for some of the years.Essentially, group entities made up of Forbes magazine, Business insider, Reuters, Gavop, the US Census, the US Department of Agriculture and Natural Resources Conservation Service, provided the secondary data highlighting sea level rise, hurricane hazards and vulnerable coastal zone tracts while the US Department of Energy, US Energy Information Administration and US Department of Interior, Bureau of Land Management, the Texas Rail Road Commission ensured data access to ranking, averages and totals of capacity, percentages and production index in oil and gas and the number of wells, volume of vented gas, as well as the county level output and revenue generation. These same organizations also offered the time series data and physical information on petroleum assets on the major sites highlighting the potentials in the region. Pertaining to additional data needs, NASA, UC Davies climate cool data system, National Weather Service, CoreLogic, Purdue university, and National Hurricane Center (NHC) were respectively critical in the procurement of information on the availability of rain data, houses threated by floods, costs of hurricane damage, average domestic carbon footprint and CO2 emissions by cities highlighting the vulnerability to changing climate. Elsewhere Texas Natural Resources Conservation Commission added deeper insights on pollution dangers, while the US Environmental Protection Agency, Natural Resources Defense Council, Texas Commission on Environmental Quality, Tetra Tech, Intergovernmental Panel on Climate Change, and the Environmental Defense Fund were critical also on data related to hydrological stress. Give that regional and federal geographic identifier codes of the state were used to geo-code the info contained in the regional data sets. This information was processed and analyzed with basic descriptive statistics, and GIS with attention paid to the temporal-spatial trends at the national, state, and regional levels in South Texas. The relevant procedures consist of two stages listed below.
2.2. Stage 1: Identification of Variables, Data Gathering and Study Design
- The initial step in this research involved the identification of variables required to analyze the extent and form of climate change trends, the impacts, factors, liabilities, damages, the risk indices, and parameters at the regional level from 2007 to 2018. The variables consist of socio-economic and environmental information, climate risk indicators, made up of sea and flood levels and years, ranks, volumes, percent, average, mean annual precipitation volume, mean low temperature, storm frequency, population by city living in a coastal zone, price of homes in flood prone areas, average annual premium coastal vs inland and home insurance premium by distance. This is followed by total properties at risk by flood, risk level, crude oil production, natural gas production, number of wells, percent of production, average well production and the percentage change in production by state. The amount of vented or flared gas, oil and gas production by county, the average annual household CO2 footprint, volume of footprint, CO2 emission levels and percentages at state and county levels, monetary costs of hurricane disasters and natural gas platform are also listed. The others encompass soil permeability, average annual rainfall and temperature, state energy related CO2, CO2 emission by counties, CO2 emission by states, volume of CO2 footprint, casualties from natural disasters, revenues from oil and gas, flood zones, areas battered by disasters, total gas products, condensate production, threats to production infrastructure and the threats of the volume of sea level rise and population. These variables as mentioned earlier were derived from secondary sources made up of government documents, newsletters, and other documents from NGOs. This process was followed by the design of data matrices for socio-economic and climate risk variables covering the periods from 2007, 2010, 2014 to 2018. The design of spatial data for the GIS analysis required the delineation of county boundary lines within the study area as well. Given that the official boundary lines within the region and its counties remained the same, a common geographic identifier code was assigned to each of the area units for analytical coherency.
2.3. Stage 2: Step 2: Data Analysis and GIS Mapping
- In the second stage, descriptive statistics and spatial analysis were employed to transform the original socio-economic, energy and biogeoclimtatic data into relative measures (percentages, ratios, averages, and rates). This process generated the parameters for establishing, the extent of climate change, the impacts, factors, trends, frequencies, output in energy indicators, projections, and quantities, temperature, storm frequency, gas flared, oil and gas production, average annual rainfall and temperature, state energy related CO2, CO2 emission by counties, monetary costs of hurricane disasters prompted by unprecedented growth and the policy failures that came into play in counties along the South Texas region through measurement and comparisons overtime. While the spatial units of analysis consist of counties, region, the boundary, and locations where changing climatic parameters, the growing frequency and projected, and current risks remain imminent. This approach allows the detection of change, as the graphs highlight the actual frequency and impacts, rankings, fossil fuel outputs, volume of gas flared and the intensity of usage and the trends as well as the economic costs. The remaining steps involves spatial analysis and output (maps-tables-text) covering the study period, using Arc GIS 10.4 and SPSS 20.0. With the spatial units of analysis covered in the region and counties (Figure 1), the study area map indicates boundary limits of the units and their geographic locations. The outputs and indicators for the state and counties were not only mapped and compared across time, but the geographic data for the units which covered boundaries, also includes ecological data of land cover files and paper and digital maps from 2007-2018.This process helped show the spatial evolution of location of various activities and the trends, the ensuing economic and environmental effects, potentials, benefits, as well as changes in other variables and factors driving climate change in South Texas.
3. The Results
- This segment of the enquiry focuses on temporal and spatial analysis of the climate change risks in the study area. There is an initial focus on the analysis of oil and gas production using descriptive statistics as well as a chronology of major climate events that besieged the zone in nearly four decades. The other portions delve on the pollution audits. This is followed by the remaining section comprising of an impact assessment, GIS mappings, and the identification of elements fuelling changing climate in the South Texas region.
3.1. Energy Analysis: Oil Production 1998-2018
- Given the place of oil and gas indicators in the study area and the links to the changing climatic trends over the years, highlighting the summary of daily and yearly production levels offers some insights. Thus, the level of crude oil production since 1998 to 2018 not only surged, but by 1998, the output, daily average, and number of producing wells in Texas began at 457,499 Mbbl-1,253 Mbbl/day with much of that coming from 170,288 wells. However, by 1999-2011, the production volumes and well numbers (of 406,815 Mbbl to 1,115 Mbbl/day and 162,620 to 393,880, 1,079 and 161,402 wells) remained below the opening accounts in 1998 until an uptick in 2012 and 2013. During those years, oil output and the wells rebounded after a slide in the previous years. With time the volumes jumped from 533,141 Mbbl, at an average of 1,457 Mbbl/day and 167,864 wells to 703,119, Mbbl, 1,926 Mbbl/day and 179,797 wells. In the ensuing years 2014 through 2015, production finally peaked up at record levels of 900,492 Mbbl, 2,467 Mbbl to 190,331 wells. The upward trend continued onto 2017/2018 as the crude oil indicators of the state which varied at the initial production levels (of 1,026,765 Mbbl, 2,813 Mbbl/day and 187,139 wells,) rose to 1,274,569 Mbbl, 3,492 Mbbl/day to 187,401 [Figure 2].
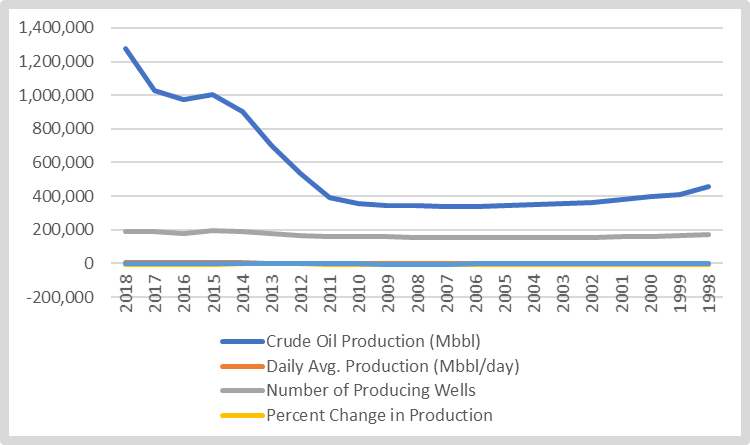 | Figure 2. Crude Petroleum Output For Texas, 1998-2018 |
3.1.1. Energy Analysis: Natural Gas Output 1998-2018
- The natural gas indicators which encompass production, the number of wells and vented gas during 1998 to 2018 are quite revealing as well. The total production of gas in the zone during 1998 to 2005 at slightly identical levels of 5,772,079,829 Bcf to 5,700,612,714 Mcf reached a total of 39,726,277,253 Mcf at an average of 5,675, 182 465 mcf. In In ensuing years 2006-2007, the output for gas moved up to 6,077,785,935 to 6,421,374,997 Bcf. In 2008-2012, as production reached 36,274,723,064 Mcf overall in the 6-year time frame with average of 7,254,944,613 Mcf. The increment in the individual periods of 2008-2013 came to 7,271,814,561 Mcf and 7,725,118,825 Mcf, respectively. For the periods 2014 to 2017, out of the total gas output of 40,650,931,157 Bcf, the state’s average stood at 8,130,186,231 with output of 8,171,229,504 to 8,520,450,699 Bcf for the years 2014 and 2017. In the process, the production wells that started at over 58,000 in 1998 to 1999, climbed by more than 60,000 in the year 2000 to 76,000 plus by 2005. The growing trends in the number of natural gas wells in Texas shows more surge as they rose further in 2006 to 2008 by 72,237-96,502. With time in 2009-2016, the gas reservoirs in Texas mostly in the over 100,000 categories increased by 101,097 to 101,339 wells. Incidentally, this was followed by a meagre slide of 99,471 to 98,709, while Texas’s average gas well number stood at 86,187 all through 1998 to 2018 (Figure 2.1).
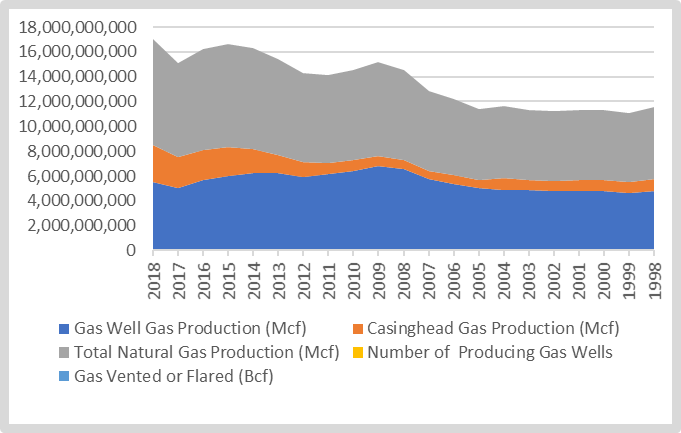 | Figure 2.1. Natural Output For Texas, 1998-2018 |
3.1.2. County Level Oil and Gas Output 1995
- The study area’s repute as oil and gas hub stayed in evidence with the distribution of total gas production by county as at November of 2019. The production tallies display consists of 167,530,670 bcf to 20,614,213 Mbbl to 7,084,388 Mbbl. Of the areas, Reeves, Webb, and Karnes topped the rest of their neighbors in gas output with estimated volumes of 71,847,083 Bcf, 49,599,737, BcF, to 23,948,736 BcF. Kenedy and Howard finished at 2,602,846 to 9,062,386 BcF. Among the counties, also note that, during the fiscal year of 2019, in the month of November, natural gas showed initial surge of over 20,000 Bcf in output at the counties of Jim wells, Kernes and Keberg. This was followed by a big rally at 50,000 Bcf in Victoria which culminated in all-time highs of 70,000 Bcf at Kenedy, Howard, and Brazoria. Of the areas, Reeves, Webb, and Karnes topped the rest of their neighbors in gas output. The oil production portion among the counties shows Karnes, Reeves, and Howard again with large volumes of petroleum in the order of 7,299,029 Mbbl, 6,916,823 Mbbl to 5,219,817 Mbbl in in 2019 (Figure 2.2). The condensate production volumes also affirm the dominance of Karnes and Reeves at 953,687 to 4,911,147, respectively.
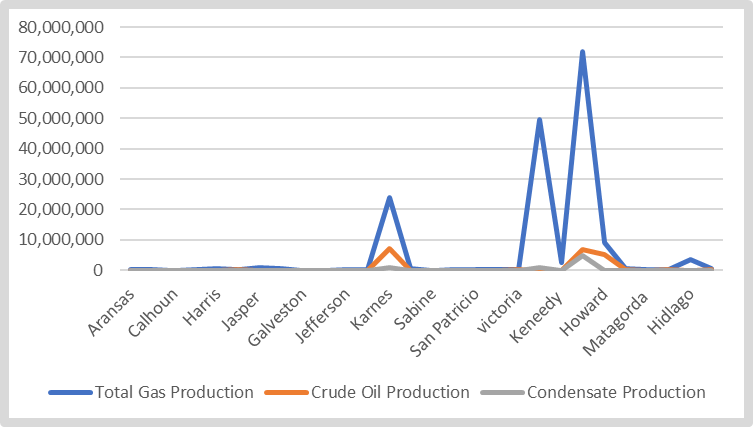 | Figure 2.2. Oil and Gas Output By County, South Texas November 2019 |
3.2. The Major Climate Events South Texas 1970s-2010s
- In decades of the 1970s, 1980s, 1990s and the 2000s, the study area has all ways had its full share of highest scales of tropical cyclones in varying locations with negative impacts. In all that, South Texas experienced countless extreme climate events involving floods, fires, heat waves and hurricanes that resulted in the destruction of properties, infrastructure, and loss of lives. At a combined price tag of roughly $166 billion from the 1970s to 2010s, the growing incidence of changing climatic disasters exacts ample strain on the ecosystem and the fiscal resources of the region. The chronological synthesis of these events follows briefly [53].
3.2.1. The Major Climate Events in the 2010s
- In the decade of the 2010s, the frequency of disaster occurrence implies that they were more recurrent in 2016, 2018 than 2017 together with the largest damage costs in the history of Texas in 2017. Aside from cases of hail, thunderstorms, tornados, and strong winds that battered the south Texas coast twice in 2016 in the months of April and May and the April of 2018. Much of the climate induced risks in the zone consists of 3 heavy floods twice in 2018 and one in 2016 that culminated in the deaths of people and destruction of community assets in South Texas [52].The concerns are not only the monetary costs of damages, but the expenses of the first 4 disasters from March 9-10 to May 21-16, 2016 at almost $10 billion overall at an average of about $2.45 billion remains a drag on state resources. Part of the core highlights involved hail, thunderstorms, tornadoes and 2 cases of 15 inches of rain fall that led to 12 deaths and the flooding of 1,500 homes. At the same time, hailstorms triggered the destruction of 136,000-125,00 cars and housing stocks. Being in an ecozone that is continually vulnerable to the forces unleashed from tropical storms, the situation got a little worse in August 25-29 of 2017 during the landing of category 4 Hurricane Harvey. As a measure of the disaster, the velocity of the storm at a scale of full wind speeds of 130 mph, dumped the heaviest recorded rainwater volume of over 60 inches in several localities in South East Texas. The heavy barrage of winds and severe rainstorms and inundation from the storm spurred widespread destruction that ravaged communities with the loss of 68 lives and financial stress estimated at $125 billion dollars, the largest post disaster cost in the state’s history.
3.2.2. The Major Climate Events in the 2000(s)
- Of the 6 major disasters that occurred during the 2000s, two of them were mostly classified as wildfire on January 19, 2009 and a major rainstorm in 2002 that turned out to be very costly. The others consist of 4 hurricanes of varying proportions that left their damaging mark in various ways from deaths to the degradation of the ecosystem especially in the cities and the natural environment. In 2001 to 2008 at a damage cost of $23 billion, the areas in the zone from Houston to Galveston endured far ranging impacts from the disasters. By 2001 to 2002 when tropical storm Alison and another seasonal rainstorm hit the area, severe floods killed 20 in Houston in the wake of over 40-18 inches of rain in 24 hours in 2001. While the arrival of a rainstorm in 2002 led to the declaration of 29 counties as disaster areas that year, the liability for both years, reached $5.2 to $2 billion dollars. The hurricanes in 2005-2008 were also no exceptions given the 15 fatalities, additional 25 deaths during Ike and 11 drownings in Galveston County from storm surge. This occurred amidst heavy flooding that accelerated farm crop and property losses estimated at $2.1 to $14 billion in 2005 and 2008. Elsewhere, in 2009, the counties of Jefferson and Hidalgo in the region saw their own share of disasters involving flooding from heavy rainfall through Hurricane Humberto and wildfire incidents. Aside from 1 death and 12 classified as injured during Humberto via flash flooding in cities around Beaumont and Orange. The 11inch rainfall in Jefferson county was so threatening enough that it inflicted visible damages. Conversely, the outbreak of wildlife in January 2009 at Hidalgo county during high temperature time led to wildfire that gushed over 2,500 acres of land and assets at a military facility. At that pace, the disaster costs at Hidalgo county and those at Jefferson during the same periods estimated in the tens of millions in dollars constitutes fiscal burdens on affected areas.
3.2.3. The Major Climate Events in the 1970s-1990s
- Out of a total price of $1.6 billion 40 million dollars during the 1990s, the biggest disasters in a spate 2 days in October 1994 gulped $700-$990 million dollars separately along South Texas. From the loss of 34 lives in flood induced hazards out of severe downpours measured at 28.90 inches. The disaster left many victims in handful of counties (over two dozen) bolt for safety between 15-19 October. Additionally, there were also ample damages to households, bridges, agricultural operations, and farms as well as the flooding of more than 22,000 homes and the displacement of over 10,000 residents. Considering that the hailstorm incidents in 1996 and 1999 at estimated costs of $40 million inflicted property damages and personal injuries below the extreme levels in 1994. During the 1980s and 1970s, the summer heat wave of 1980 was quite punishing enough. This left a sad memory in the minds of many people as the city of Houston endured over 4 weeks of high temperature scale of 100 degrees. In a span of several weeks before then, Hurricane Danielle drooped at least 7-25 inches of rain at both Port Arthur and Junction. In August of 1983 and July 1979, Hurricanes Alicia and Tropical storm Claudette were so violent in their paths that they left in peril the South East Texas area encompassing coastal districts adjacent to Galveston and Houston. In inflicting the heaviest cost of $3 billion in the state's history at that time in 1983, Galveston and Houston were besieged by 22 tornadoes and 130 mph winds with the death of 18 residents and another 18,000 wounded. In 1979, the catastrophic damages from Claudette again pushed the Houston area to its limits with 40 inches of rainstorm that left nearby creeks surging at record heights of 9 Feet that damaged at least 15,000-17,000 cars.
3.3. Pollution Audit by Region and State in the 2000s
- At the city and county level based on the 2002 data, Texas had three counties listed on the pollution emission ranking. Amongst them, the oil and gas hub of Harris county with Houston as the major city toped the listing due to widespread use of fossil fuels like coal and gasoline as well as industrial emissions. Given the area’s large presence of petrochemical refineries and related industries, Houston stood out with 18.625 million tons (MT) of CO2 followed by Los Angeles at 18.595 MT of CO2 (Figure 3). At the same time, nearby counties such as Titus, Texas and Bexar, Texas (San Antonio) ranked at number 11 and 17, discharged about 7.244 -6.141 million tons of carbon dioxide per year. When it comes to the state level trends in CO (carbon monoxide) emissions for 2005-2016, Texas’ volumes of pollutants seemed stable over the years at the 600 million metric ton plus levels (Figure 3.1). The emissions began with 611.6, 620.7, to 617.4 MMt during the first three periods (2005, 2006 to 2007). In the next years (2008 to 2010 and 2012), the discharged volumes for CO in Texas fell (583.8, 549.5, 584.3 to 599.3 TMT), but only to surpass the levels for the opening three years at 628.2, 626.0, 626.5 to 657.4 TMT between 2013 through 2016. In all those years, the state’s emission totals of 7307.7 TMT in carbon monoxide averaged 608.98 TMT. When contrasted a bit further among the top 10 states discharging higher levels of CO2. By 2011, Texas with 656 Metric Tons MMT of the total (2677 MMT) emerged as the biggest discharger followed by California and the group of industrial Midwestern states of Pennsylvania and Ohio where CO2 emissions ranged from 245 to 233 MMT (Figure 3.2). In the process, the dozens of cities in the counties of the region averaged 49.79 MT tons in household carbon footprint in 2011 above the lowest footprint of 35 MT in Gilcrist in the Galveston area during that period (Figure 3.3). Of these places, Houston, and Hubbel in Harris county with 64.7-67.2 MT sat on top of all the cities while Manvel and Inez in Brazoria and Victoria finished in the second order of areas with higher home carbon footprint of 62.6 MT to 60.6 MT.
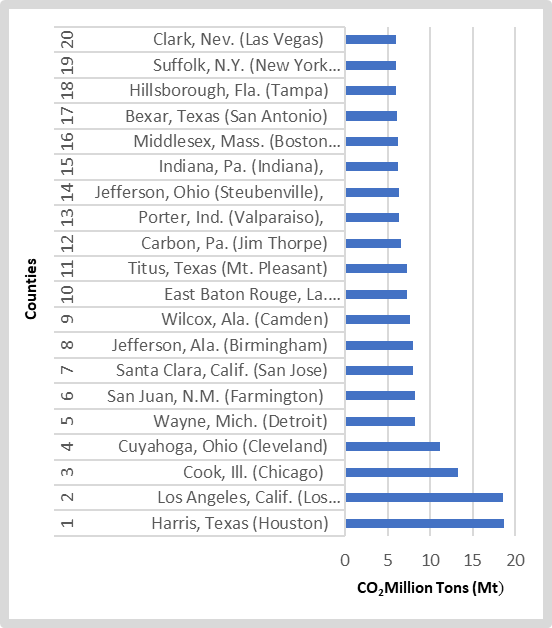 | Figure 3. Top 20 CO2 Emissions By Counties In 2008 |
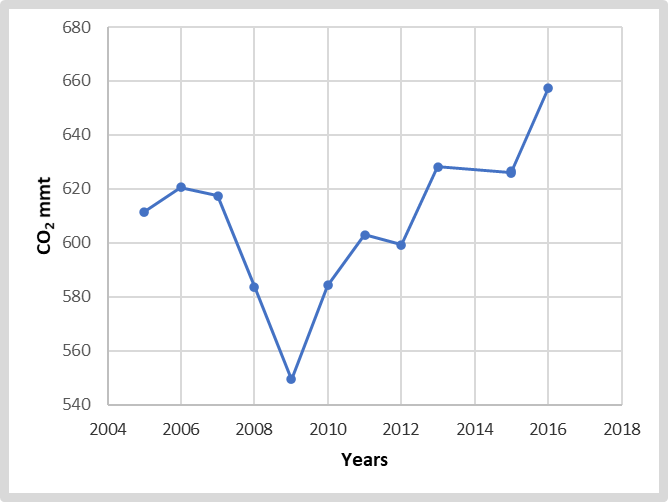 | Figure 3.1. State Energy Related CO2 Emissions By Year 2005-2016, Texas |
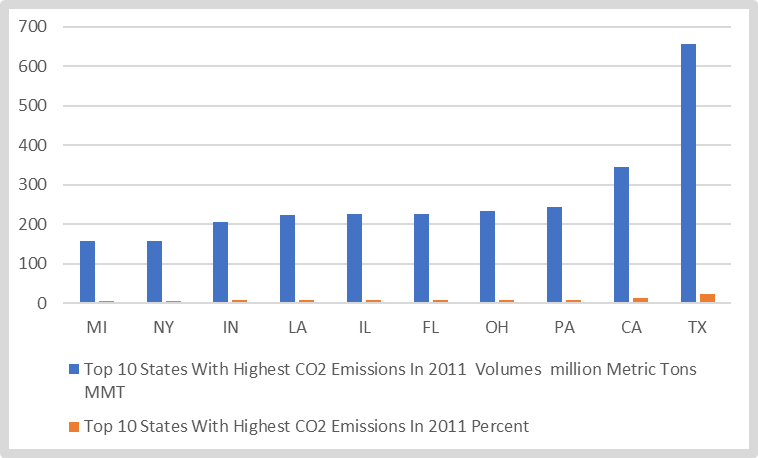 | Figure 3.2. Top 10 States With Highest CO2 Emissions, 2011 |
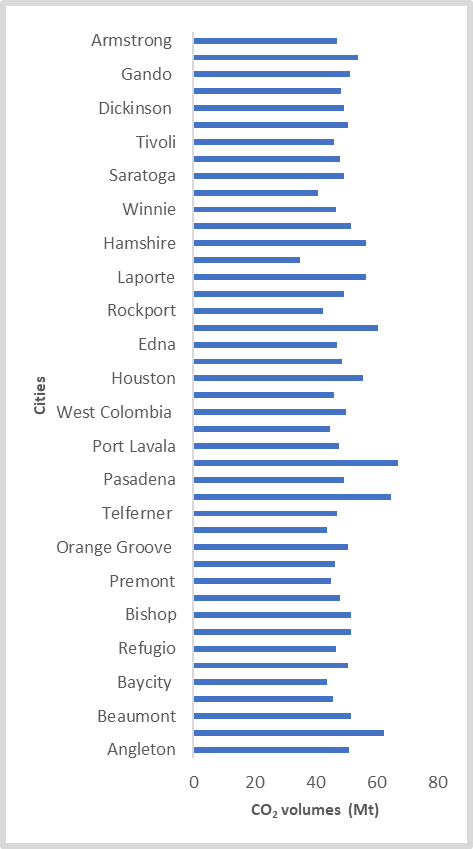 | Figure 3.3. Average Annual Household CO2 Footprint In South Texas Cities, 2015 |
3.4. Impact Assessment
- Looking at the recurrent risks from climate change in the South Texas region. The built and natural environment in the form of community neighbourhoods, petroleum infrastructure and fragile ecosystem were at the receiving end of sustained and future impacts of varying proportions.
3.4.1. Real Estate Properties Threatened by Floods
- Part of the impacts on built up areas touches on the risks posed to real estate properties when Hurricane Harvey landed in the zone. Knowing fully well the magnitude of physical assets on the paths of deadly hurricanes. During the advent of Hurricane Harvey in 2017 in the South Texas region, the Houston Sugarland-Baytown area had 57,007 homes (2.43% of 2,340,343) compared to 1,990-646 stocks for a trio of cities Beaumont-Port Arthur, Bay city and Victoria listed under the at risk and non-risk exposure categories after the storm in 2017. On the very high-risk side of the listing, comes a major shift of 211,851, 19,774, 5,727 to 1,847 in the numerical distribution of total properties on the heavy risk terrains among the respective towns. Moving onto the high-risk column, Houston-Sugarland-Baytown axis saw heavy exposures with about 494,983 to 21.15% of the available homes listed in that class. Elsewhere, Beaumont-Port Arthur, Bay City and Victoria followed up with more homes (39,096, 7,374 to 7,064) tagged as high risk just for being in the special flood hazard area.
3.4.2. Oil and Gas Industry Infrastructure at Risk
- The force of category 4 hurricane Harvey’s long-term impact on US oil markets created challenges along the entire petroleum value chain, from production to refining to transportation (Fig 5.1). In that case, about a quarter of the offshore oil and gas production in the Gulf of Mexico was instantly halted, but the more noteworthy impact on energy supplies appears to have been caused by the flooding that occurred on the mainland Texas’ 27 petroleum refineries responsible for 29% of US refining capacity, or over 5.1 million barrels of oil per day. In as much as this occurred in the face of road closures and rescue operation efforts at Inter State 45 near League city, sizable proportions of oil and gas wells and natural gas processing plants were in harm’s way at the same time in the South Texas region. In response to the dangers, the temporary closure of the sector that went into effect limited the daily production activities of biggest refineries in the area. The affected refineries and their capacities threatened by the storm amid temporary closures consists of ExxonMobil (560,000 b/d), Valero (293, 000 b/d), Shell (340,000 b/d) and Philipps 66 (247,000 b/d). In the process, at least about 11.2% of US refining capacity were shut down. As some companies like ExxonMobil’s XTO Energy in South Texas, suspended fracking operations and evacuated employees. In total, US oil output fell by almost 8%, from 9.5 million barrels per day (bpd) to 8.8 million bpd. These amenities being major economic life support for the state, counties, the region, and the nation, saw monetary losses due to the hurricane event.
3.4.3. Ecosystem Disturbance and Sea Level Rise
- Climate change induced disturbance brought about by high temperature and heavy rain often accelerates the degradation of shoreline ecology. Being a very fragile ecozone, whenever the climate heats up in those circumstances, water vapor from the exterior onto the air creates hazes that impact the ecosystem in a multifaceted mode. The same clouds can trigger heavy rain and floods while changes from higher grounds impacts low lying fragile coastlines in the process as often felt in the zone. Also, when agrochemicals sip into the coastal ecozone from higher grounds, floral species not used to the presence of such materials on the coast could either adjust or be wiped out. Such changes may impact the survival of species reliant on the floras. The same force unleashed by rising sea levels out of the Gulf of Mexico, onto lakes and estuaries pushes up water levels and salt content of sea and subterranean hydrology that degrades native flora and aquifers. This puts cotton, rice, citrus fruits, and other produces at greater risks. With the predicted surge of oceans amidst global warming, rising seawater and the meltdown of ice sheets and glaciers. Worldwide, sea levels are expected to soar by 0.66 to 6.6 feet in 2100, and at risk are Port Arthur, Galveston, and Corpus Christi where some parts of the last two cities are also sinking while compounding the rising water levels (Fig 5.2-5.3). Additionally, the waters near Rockport, are rising at the fastest rate on the Texas coast by three-tenths of an inch yearly, and 60% through subsidence. By 2045, 10,000 homes worth $2.2 billion along the coast will be regularly inundated at least 26 times a year. Given that roughly 90% of the cities are below 6 feet, Corpus Christi, the 3rd most vulnerable Texas city, has almost 15% of its area under 1m.
3.5. GIS Mapping and Spatial Analysis
- The GIS analysis entails visual display of spatial patterns pinpointing varying indicators and perceived climate change risks in the study area. The hazard parameters cover soil permeability and limitation index, urban development in the flood zone, petroleum infrastructure vulnerability, the threats of hurricanes, precipitations, and sea level rise. From the burdens of the calamity often faced in the zone over time. The info as underlined by the geo visualization under different dimensions, offer insights into challenging situations, the patterns and evolution in space. The ability to trace the spatial paths of these events under a GIS environment as a viable evaluation device, create opportunities to assess climate change risks in the South Texas region.Given the disregard for safety measures and the risks of building new settlements on less permeable soils. Several localities around the Houston metro area and others on the Texas coast lines were designed on less absorbent surfaces. With much of the pedological index issue centered on soil permeability structure and vulnerability symbolized by a mix of high and low points in space. Along the Houston area, the adjoining communities represented in the different colors of light yellow, yellow orange, blood color and dark red, reflect the low permeability ratings in different variants of yellow. This not only showed visible vulnerability with scattered presence of the high type. But note that the low permeability rating mostly in yellow colors spans all through across clusters of areas exhibiting high susceptibility to flooding, sea level surge both in the Northwest and South East area of the map when compared to pockets of places denoted by high permeability spots as well (Figure 4).With that came rapid development that stretched all through the upper side, the central, Western, and Southern to the Eastern portions of Houston by 2001-2011. The spatial forms of the extreme climate hazards appeared more visible with serious exposures of human settlements from lake Houston to Galveston Bay. With the impermeable spots encroached upon by developed areas identified as red and purple between 2001 to 2011 and Galveston Bay, Lake Houston, and the riparian settings in beige, at the center stage. From the information on Figure 4.1, Houston saw notable growth levels beginning in 2001 on sites within impenetrable surfaces in the central and upper and lower portion of the city. Over time, emerged a vast spread of growth fully concentrated on the outskirts in 2011. Aside from the frequency at which urban development sprang up in a decade on impermeable surfaces as manifested in purple-red spots within the greater part of the city near to riparian buffers like lake Houston and Galveston. The spatial patterns and extension further deep onto areas prone to repeated climatic hazards like displacement of communities after heavy storms with limited permeability, affirms the level of risk exposures for human lives and properties in the city (Figure 4.1).
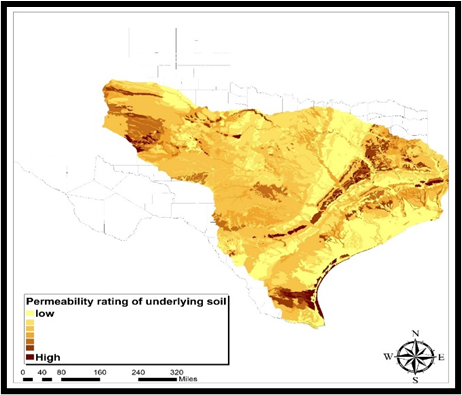 | Figure 4. Soil Permeability Structure and Vulnerability of Houston |
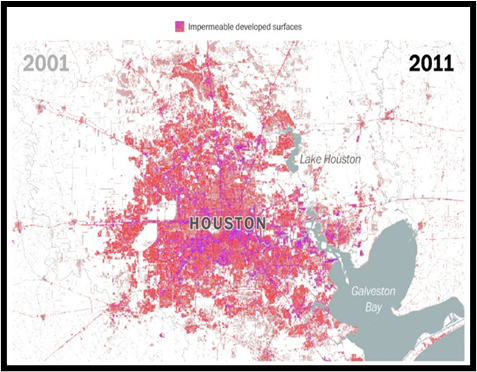 | Figure 4.1. Distribution of Impermeable Developed Surfaces In Houston 2001-2002 |
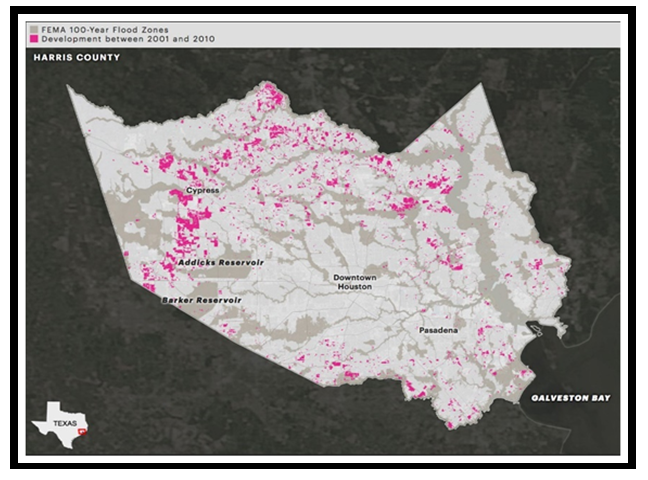 | Figure 5. Urban Growth In Flood Zones, 2001-2010 |
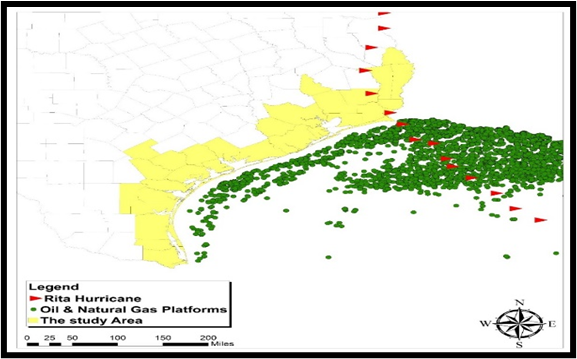 | Figure 6. The Threats Posed to Petroleum Infrastructure By Hurricane Rita, 2005 |
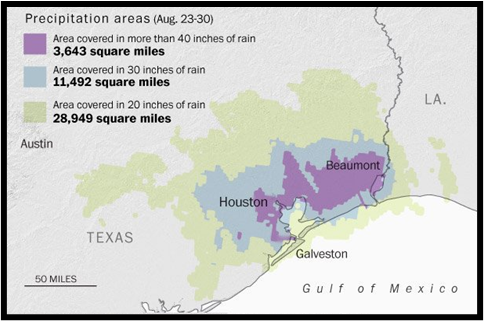 | Figure 7. The Distribution of Areas Battered By Heavy Downpour During Harvey, 2017 |
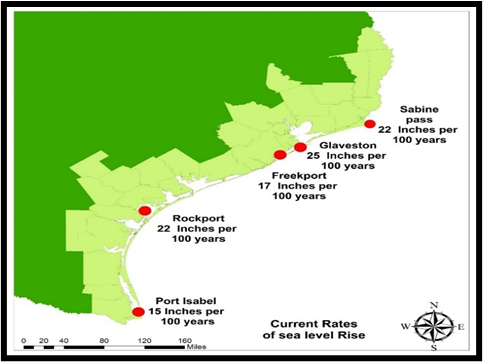 | Figure 7.1. The Threats of Sea Level Rise |
3.6. Factors Responsible for Changing Regional Climate
- Concerning the factors fuelling the mounting climatic hazards devastating the South Texas ecosystem in a span of several decades. The temporal-spatial assessment of the extent and form of the impacts showed that climate change events in the zone do not operate in isolation. They are associated partially with a host of socio-economic, policy, and physical-environmental factors. These forces are assessed in detail below.
3.6.1. Population, Urbanization and Uncontrolled Growth
- From the scale of change in the zone, Houston’s teeming population and uncontrolled growth level therein are all implicated. Just as Houston grew to 2.2 million in 2015 at a rate of 25% from 1995. Harris County’s geometric surge by 42% resulted in the addition of 4.4 million residents. From the influx of millions in recent years, the city negated strict design codes, that allowed the clearance of prairie lands a supposedly natural buffer meant to ensure the drainage of rainwater. At that level of growth, the city extended further deep onto open natural areas over the years. As the city grew, the rising development exceeded the natural capacity to drain rainwater runoff. So, by 1992-2010, 30% of the county’s coastal prairie wetlands were paved over with catastrophic effects. Accordingly, in the decade after Tropical Storm Allison in 2001, about 167,000 acres were developed in Harris County which covers Houston. Aside from being, an ecosystem under stress, the matter seemed compounded when the Corps of Engineers stepped in and bought 24,500 acres that would later become the reservoirs even though 8,000 more acres of that could flood during a giant storm.
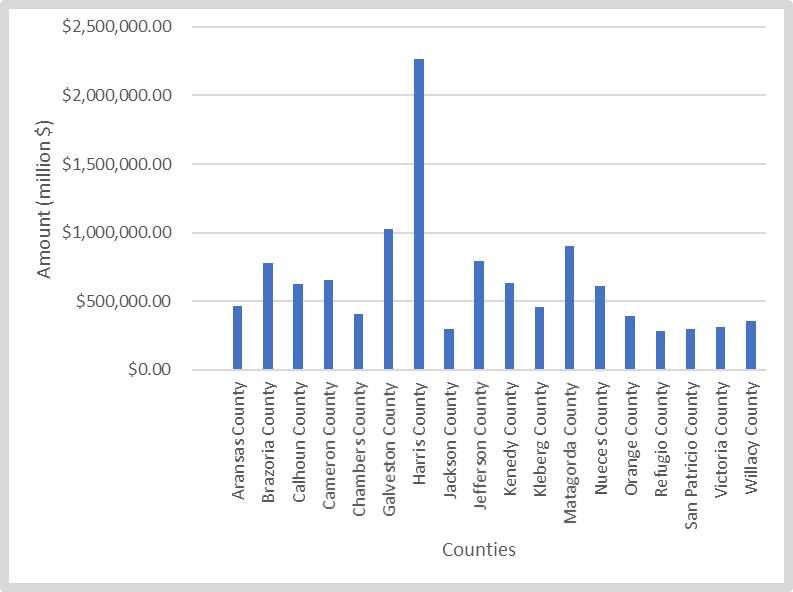
3.6.2. Economic and Fiscal Benefits
- The economic benefits presented from the oil and gas sector allows indulgence in practices that keep folks in harm’s way (Figure 8). The booming discovery of new wells and allure of huge revenue makes it hard to scale back on production and the design of new infrastructure. Thus in 2015, Texas cashed in on $13.8 billion dollars in Tax revenues likely to minimize Best Management Practices towards mitigation. Also, parts of the revenue disbursed by Federal government in the respective areas that accrues to Texas stands at $46,313,471.21 in the 2019 fiscal year. Among the 15 counties, Galveston and Harris topped the list of local revenue recipients with about $1,024,591.91 to $2,263,694.49. This was followed by the $901,868.30, $794,042.37 to $779,380.51 for a trio of other places from Matagorda, Brazoria and Jefferson. Worthy of mention are the 2nd tier receivers; Calhoun, Cameron, and Nueces and Kenedy with over $600,0000 in revenue allocation (Figure 8).
 | Figure 8. Revenue From Oil and Gas South Texas, 2019 |
3.6.3. Ineffective Policy
- Houston prides itself as a city with no limits to deliver the capacity of infinite prospect, yet it lacks zoning laws that often leads to deadly flooding. Thus, it came as no surprise that when Hurricane Harvey kept thousands of residents in harm’s way because of such virtually unchecked growth in flood-prone areas. The accumulated ineptitude in the adhoc responses without built in measures towards mitigation exposed an entrenched tendency that downplays the gravity of climate change. The recourse to Orwellian double-speak of climate cooling puts communities at risk in a setting where the negation of climate change risks by elected officials seems normalized for political opportunism. This reinforces previous pranks to defund the EPA in a manner that keeps the state and the nation unprepared for climate planning. Even with portions of Texas’ 367-mile Gulf coast now vulnerable to rising seas, and violent storms therein becoming stronger. These risks are overlooked by agencies regarding climate projections, as managers struggle with making important plans for the state. Aside from the policy contradictions in which the top state regulator allows pipeline operators to exploit legal loopholes to vent natural gas in oilfields, the Corps of Engineer veto power pertaining to certain types of development in areas prone to flood risks like Addicks /Barker Reservoirs raises serious policy concerns at odds with ecological safety.
3.6.4. Environment, Physical and Climatic Forces
- From 1998 to 2018 Texas vented 540 Bcf in gas at an average of 36.02 Bcf. By 2013-2017 refineries in the zone flared average of 465.5 Bcf of gas. Also, CO2 emissions have been on the rise with burning of fuels such as coal and gasoline increasing warm atmosphere via rising temperature. Surely, the rise in CO2 in the atmosphere and rains are fuelling the increased rates in sea-level rise along Texas’ coastline. The gravity of the recurrent storms is that large cities like Houston reached record breaking levels in terms of wettest calendars in rainfall events state-wide. Added to that are the geology, and pedology especially the soil permeability factors limiting faster drainage of water during major storms often witnessed over the years in the zone.Considering the high propensity to heavy rainstorms and the nearness to the Gulf of Mexico, the region’s mean yearly rainfall and temperature from 1971 to 2000 involving a trio of indicators offer better clues on climatic change forces in the zone. From the overall mean values of 38.63 inches for precipitation and the mean January to July temperature scales of 42.65-93.63°F. The rankings under the three climate parameters for the first 8 counties made up of Jasper, Jefferson, Brazoria, Hardin, Sabine, Chambers, Harris, and San Jacinto showed some uptick associated with climatic volatility. The next 10 counties from Fort Bend to Neuces as well as the last group from Kelberg to Reeves also followed those patterns during the past years. Based on regional data, the first batch of counties led by Jasper saw 51.77 inches in rain fall values and 39.9 to 92.98°F in the low months of January to highs in July of 1971 to 2000. In group two headlined by Fort bend to Neuces, there exists average scale of 40.4 inches in rain fall at temperature scales 45.08 to 91.94 °F in the medium and high phases. The third and last groupings of 11 counties which extends from Kleberg to Reeves took in the lowest amount of rain at 23.36 inches together with 42.44 to 95.71°F in varying temperatures measured in the low and highs of January and July. Aside from the variabilities in rainfall average, the temperatures remained consistent among the counties, hence the role of these physical forces in fuelling change (Figure 9).
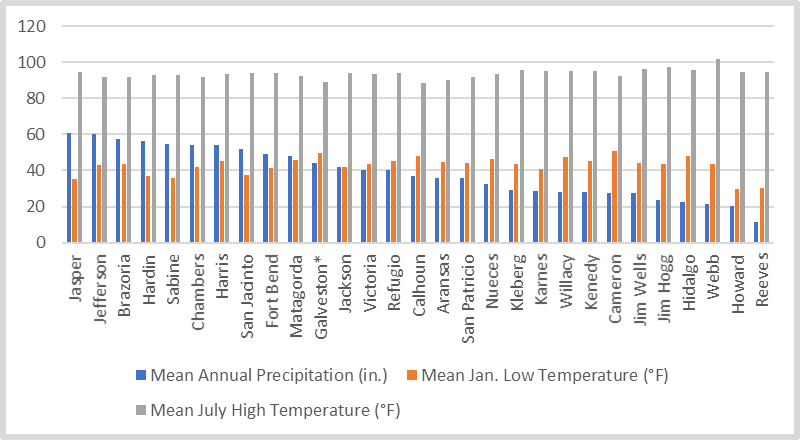 | Figure 9. Average Annual Rainfall and Temperature South Texas Counties, 1971-2000 |
4. Discussion
- From the assessment as conducted in this enquiry, it is evident that the South Texas region, and its communities have important capabilities built on a vast terrain that span through diverse ecosystem, and vibrant economy. The cities and counties in the zone maintain enormous economic potentials, buoyed by the visible presence of energy infrastructure network containing petroleum refineries and capital investments opportunities. With that comes the large concentration of crude oil and gas wells and the surge in the production activities from the fiscal years 1998-2018. Added to that are the ambitious urban development in the greater Houston area and unprecedented expansion in core cities made possible by degradation and encroachment into the seemingly fragile Prairie wetland ecosystems. Given the enormity of potentials in the zone along the coastal plains of the state adjacent to the Gulf of Mexico. The diverse ecosystem therein boasts of various species of terrestrial and aquatic flora and fauna coupled with very flourishing built-up areas always at the receiving end of pressures from extreme climatic hazards. With significant presence of hundreds of thousands of citizens resident in core urban areas and many activities fully concentrated on the low-lying Texas coastlines along the Galveston axis now threatened by anticipated sea level rise. The propensity to changing climate risks continues to endanger the wellbeing of the citizens and their properties in the region. Given that Texas and some of the cities in the Southern portion of the state rank high nationwide as the biggest emitters of carbon dioxide, methane, and Green House Gases (GHG) which mostly originate from oil and gas activities and other sources. The possible impacts of sea level rise from global warming and the melting of the glaciers exposes cities under lower elevations in the region to eventual submergence by 2050. In all these, evidence shows that climate change impacts in South Texas stems from many parameters comprising of rising temperature, heavy precipitations, sea level rise, floods, and other socio-economic and physical elements.Accordingly, the South Texas region with all its enviable attributes as a major powerhouse in the petroleum sector, remains an epicenter of recurrent climatic events. Situated in a bio-geoclimatic unstable zone along the Gulf of Mexico known for its heavy doses of elevated temperature and torrential rainfalls emanating from tropical sources at various times of the year. The scale of these disasters in the form of countless hurricanes, heat waves and other hazards when translated into human and fiscal costs in both the built-up areas and the natural environment of the region, portray a fragile ecosystem constantly pushed towards its limits. Such vicious pressures from changing climatic disasters in these settings usually leave in their wake an indelible footprint on the surrounding ecology with grave toll on communities, cities, and their infrastructure. Realizing that the perennial ordeal and pains inflicted to communities in harm’s way are real despite absurd claims by sceptics of climate change in the region. The advent of Hurricane Harvey in the summer of 2017 in South Texas triggered the highest levels of tropical downpour ever recorded in the zone. During the days after initial landing of the storm, South Texas saw the inundation of two sites adjacent to a major petroleum hub at Port Arthur by more than 60 inches of rain while millions of citizens also experienced similar ordeals in the zone. Seeing that the GIS mapping of the trends reveals incessant diffusion of risks from changing climatic parameters in various areas. The proficiency of GIS mapping was crucial in showing the spatial distribution of climatic forces and soil index limitations, the vulnerability of urban centres on flood plain and the propensity to flood, sea level rise risks, and the exposure of energy infrastructure to climate change in the region. Given the region’s proximity to low lying coastal areas and with other eco-zones likely to be impacted by changing climate. Certainly, the spatial analysis also underscored the geographic distribution of natural disaster occurrences and impacts, in coastal areas as well as coastline population exposures to climate risks over the years. In that way, the vast geographic dispersion of soil permeability limitations through the visuals, exemplifies the vulnerability along the high population centres within the Houston area. This coincides with the displayed climate induced risks highlighting the pedological index and the obsession with urban growth on flood plains. Other segments of the geospatial calibrations of the risk indices extends to the exposure of built-up areas to risks triggered by heavy downpours and their record levels at various points in space denoting towns in South Texas affected by the pressures unleashed by Hurricane by Harvey. Notable dimensions of the GIS mapping involve the visible display of sea level rise dangers given the proximity of coastline populations from Corpus Christi, Galveston, Beaumont, Sabine pass, Port Isabel, and Rock Port along South Texas to the climatically unstable Gulf of Mexico ecozone. The thrust of this analysis as indicated revealed the exposure of these places as at-risk prime targets for floods and projected submergence in coming years. Just as the hazards embody low elevation risks and other climatic stressors clustered in South Texas region. Taking a cue from the study, the results show the prevalence of climate change risks and impacts in the form of flood hazards, greenhouse gas emission, sea level rise, pollution, environmental degradation, and the displacement of citizens. The GIS mapping of the trends pinpointed clusters of heavy presence of stressors and amenities at risk dispersed across space and time with linkages to socio-economic, physical, and ecological forces. To remedy the situation, the paper proffered numerous solutions ranging from the adoption of effective policy, growth management, monitoring to the design of a regional climate information systems and the education of the public and others. For details of the recommendations, see Table 1 in Appendix A.
5. Conclusions
- This research assessed the risks from changing climate impacts in counties along South Texas region with numerous important findings listed as follows. a) South Texas epicentre of natural disasters; b) large fossil fuel energy production capacity; c) the impacts of climate change on the rise; d) climatic shift triggered by multiple factors; e) mix scale approach quite effective.The South Texas zone being the epicenter of most climate disasters over the years, remains at the receiving end with widespread ecological and economic harms of colossal proportions in the process, since 1971-2017. Thus, going back to the different decades in the 1970s, 1980s, 1990s and the 2000s, the study area has always had a full share of highest scales of tropical cyclones in changing locations with negative effects. In all that, Texas Southern region suffered innumerable extreme climate events including floods, fires, heat waves and hurricanes that resulted in the destruction of properties and infrastructure, the loss of lives and displacement of citizens from their homes. At a collective price tab of roughly $166-$200 billion from the 1970s to 2010s, the mounting occurrence of changing climatic disasters exacts ample strain on the fragile ecosystem and the monetary resources of the region through fiscal shocks on affected localities and sectors. Thus, based on the temporal tracking in the decade of the 2010s, the frequency of disaster occurrence implies that they were more recurrent in 2016-2018 together with the largest damage costs in the history of Texas in 2017. Aside from cases of hail, thunderstorms, tornados, and strong winds that battered the south Texas coast twice in 2016 in the months of April, May, and April of 2018. Part of the climate induced hazards recorded in the region consists of 3 heavy floods twice in 2018 and the one in 2016 that resulted in deaths and the destruction of public assets in South Texas. The vivid compilation of climate risk info in this study highlighting the trajectory and frequency of the hazards, affords the region and others in similar ecozones to learn from the timings and then device resiliency measures in sync with the seasons as steps towards mitigation.With most of the state's 29 operating petroleum refineries responsible for the processing of about 5.7 million barrels of crude oil daily and critical for delivery to consumers crowded at adjacent ports throughout the Gulf Coast, including the country’s biggest refinery at Port Arthur. The Texas Gulf coast boasts of the largest concentration of refineries nationwide with huge network of pipelines and storage facilities. Thus, given the place of oil and gas indicators in the study area and the links to the changing climatic trends over the years. Highlighting the summary of daily and yearly production levels offers insights to managers, regulators, and the industry and those unable to factor sectorial role and vulnerability as well as risks to adjoining communities to climate change in the region. Accordingly, crude oil production not only surged since 1998 to 2018, but by 1998, the output, daily average, and number of producing wells in Texas began at 457,499 Mbbl -1,253 Mbbl/day with much of that from 170,288 wells. The volume of other gas indicators like output, the number of wells and vented gas in 1998-2018 were quite revealing also. With a total production of gas in the zone for the individual years 1998-2005 at over 5,700,000,000, Mcf, the state posted a total of 39,726,277,253 Mcf. Even at that, the production tallies among counties in 2019 November at Reeves, Webb, and Karnes reached significant levels large enough to spark the flaring of natural gas, CO, and CO2 emissions into the atmosphere. With that at the center of ongoing debate on climate change given the presence vast network of oil and gas wells in the zone. Stressing these dangers and the links to production is a major contribution crucial to policy and likely to elicit adjustments from the industry.The effects of climate change have been fully manifested across the counties of the South Texas region over the years and as such, it cannot be fully covered here given the size. However, since this involves exposure of vast proportions of areas in both the natural environment and built-up areas along the Texas Gulf Coast over time. The recurrent warming of the atmosphere brought about partly by elevated temperature is leading to the melting of the Arctic ice carp and the dumping of huge volumes of water into the oceans with spill over to the study area in the Gulf of Mexico ecozone. With global sea levels expected to rise by 0.66 to 6.6 feet in 2100 due to these changes. Low lying counties in South Texas coastal lines face far bigger threats more than ever. At risk are Port Arthur, Galveston/ Corpus Christi, and some parts of the shorelines of these places that are partially sinking. In those settings, the force propelled by rising sea levels out of the Gulf of Mexico and onto lakes, drives up water levels and the saline content of sea and subterranean hydrology in a way that degrades native flora and aquifers. Compounding the dangers of rising water levels which further buttresses the impacts. The city of Houston known for its recurrent exposures to storms and rising temperature was flooded by over a trillion gallons of water during the landing of Hurricane Harvey in 2017. This created challenges for the whole petroleum value-chain in terms of production, refining and transportation. The escalation of liabilities of that scale extends to hundreds of billions of dollars in damages triggered by extreme climate events in the past decades. At that pace, many towns in South Texas with valuable assets and now threatened by sea level rise, face submergence and eventual disappearance. Underlining these climate impact parameters given the risks, will make containment the focus of rehabilitation and mitigation plans in the zone in future.With the changing climatic risks attributed to a host of policy, socio-economic elements of population, urbanization and uncontrolled growth and physical forces. The urbanization factor cannot be denied especially when one sees the uncontrolled growth patterns in Houston given the teeming population pace in a place and the vulnerability to climatic volatility. This comes to mind when looking at how Houston grew by 25% from 1995 to 2015 and Harris County followed up at a rate of 42% in the number of residents. As millions of folks flocked in during current years, the city relaxed strict design codes. This enabled the clearance of prairie water absorbent habitats that could have provided natural buffer during storms. In the process, by 1992-2010, about 30% of the Harris county’s coastal prairie wetlands were tiled in a way that rendered the communities vulnerable to climate change induced storms. While the fiscal returns offered by oil and gas presents many opportunities as seen with the discovery of new wells. This makes it hard to scale back expansion and production as Texas took in a whooping $18 billion dollars in Tax revenues in 2015. Such volume of cash inflow lessens any motivations towards the adoption of best management practices likely to drive mitigation and safeguard people and the environment from risk exposures. Added to that are the ineffective policy framework unique at both the city and state levels. To begin with, Houston’s lack of zoning laws exposes the residents to violent floods. Also, inaction towards gas flaring on the part of Texas Railroad Commission drives the warming of temperature. Being in an area fraught with extreme climate events like tropical cyclones raises the spectre of risks in such a fragile ecosystem. Besides the problems of limited soil permeability potentials as major handicap for counties during hurricanes. From 1998 to 2018, Texas vented 540 Bcf in gas from refineries with rising CO2 emissions through the burning of fuels leading to elevated temperature. By showcasing this, the study not only reiterated the essence of socio-economic and geo-physical elements in the region’s climatic variability index, but it did indicate how the ecosystem could be impacted by these factors. Emphasizing these links considering the exclusion in past studies, keeps a major regional policy concern at center of climate change and coastal planning.From the study results, the use of mix scale methods did stand out quite extraordinarily convincing in charting the contours of climate change research in the South Texas region. Applying descriptive statistics and GIS mapping as operating tools under the model added novel context for embarking on regional level analysis by stressing the impacts of climate change on coastal ecozones. In view of the ecological and socio-economic importance of the region’s coastal zone, the fiscal and natural resource potential in the energy sector and the network of infrastructure spread across coastal counties and cities, drives commodity markets in various parts of the country and the study area. The choice of mix scale model in calibrating the regional climate index pinpointing risk exposures like the threats of sea level rise, the dangers posed to petroleum infrastructure by hurricanes, distribution of impermeable surfaces converted to neigborhoods, limited soil permeability index and urban development in flood zones stands high as a call to duty. Pinpointing these risks over the different periods and scales, reiterates the efficacy of mix scale system. This approach was quite valuable in delineating the study area and in classifying the trends and during the assemblage of information on climate change under various indices. Emphasizing the visualization of climatic risks from various parameters in that form, are essential in the design of novel schemes to protect fragile ecosystems. The practical applications of a mix scale approach involving mappings and compilation of climate change index, as investigative tools, thus improves our grasp of the region’s susceptibility. Accordingly, decision makers in the region will be hard pressed to demand quick answers to several burning questions pertinent to climate change. The questions are as follows: How will climate change parameters affect subterrain hydrology? What scale will climatic stress assume in low lying coastal area? What form will the geographic distribution of climatic risks take in the zone? What additional socio-economic and physical factors will be shaping global warming? In building from these questions, ample chance exists for practitioners and scholars to redirect the focus on regional climate change mitigation with standards underscoring containment, protection, and rehabilitation. This will enable the major actors in the industry, the region and state and cities to augment their commitment towards climate change mitigation with better outcomes.