-
Paper Information
- Paper Submission
-
Journal Information
- About This Journal
- Editorial Board
- Current Issue
- Archive
- Author Guidelines
- Contact Us
Resources and Environment
p-ISSN: 2163-2618 e-ISSN: 2163-2634
2021; 11(1): 9-17
doi:10.5923/j.re.20211101.02
Received: Jan. 12, 2021; Accepted: Jan. 30, 2021; Published: Feb. 6, 2021

Estimation of Clear-Sky Global Solar Radiation Using Hottel’s Model and Liu and Jordan’s Model for Qena/Egypt
 Abstract
 Reference
 Full-Text PDF
 Full-text HTML
1Physics Department, College of Science, Jouf University, Sakaka, Saudi Arabia
2Physics Department, Faculty of Science, South Valley University, Qena, Egypt
Correspondence to: Kassem Kh. O., Physics Department, College of Science, Jouf University, Sakaka, Saudi Arabia.
| Email: |  |
Copyright © 2021 The Author(s). Published by Scientific & Academic Publishing.
This work is licensed under the Creative Commons Attribution International License (CC BY).
http://creativecommons.org/licenses/by/4.0/

For using solar energy applications, it is essential to get solar radiation data for the considered location. Measured data are not available for every location, especially in developing countries. In this work, hourly clear-sky global solar radiation (CSGSR) is calculated as a sum of the direct component calculated by Hottel’s model and the diffuse component calculated by Liu and Jordan’s model. From the hourly calculated values, monthly average hourly, average daily, and monthly average values are calculated in Qena/Egypt. The calculated values are compared with the corresponding measured ones during the period from 2004 to 2012. Different performance measures are used to test the accuracy of the estimation of the CSGSR. These measures are mean bias error, mean absolute bias error, root mean square errors, model efficiency, modelling index, and t-statistic test. Statistical measures indicated that using Hottel’s Model and Liu and Jordan's Model can be used safely in calculating the CSGSR in Qena/ Egypt and other sites with the same climate characteristics.
Keywords: Clear-Sky global solar radiation, Clear-Sky beam radiation, Clear-Sky diffuse radiation, Qena/Egypt
Cite this paper: Kassem Kh. O., Estimation of Clear-Sky Global Solar Radiation Using Hottel’s Model and Liu and Jordan’s Model for Qena/Egypt, Resources and Environment, Vol. 11 No. 1, 2021, pp. 9-17. doi: 10.5923/j.re.20211101.02.
Article Outline
1. Introduction
- The design of solar energy conversion systems requires accurate information about the availability of total solar radiation at the desired location. Measuring the solar radiation in the requested site is the best way to obtain representative data. Unfortunately, measured solar radiation data are not available for many locations, especially in developing countries. Therefore, modeling is a proper solution for estimation of the solar radiation at the locations where measurements are not available, taking into account the amount of solar radiation received in the clear-sky condition and applying a factor that parameterizes attenuation caused by cloudiness. In addition to the design of solar energy conversion systems, values of the local global solar radiation are used in most models simulating crop growth and are also necessary for many applications, such as estimation of the evapotranspiration, and architectural design. [1-3]. The intensity of the solar radiation reaching the earth’s surface could be affected by the air mass as well as the weather conditions such as the extent of cloud cover and atmospheric turbidity. On a clear day, the radiation reaching the earth’s surface is reduced by 30%, while it could be reduced by 90% on a hazy or cloudy day. Therefore, solar designed systems perform better on a clear day. So, it is essential to ascertain the estimation of radiation to a surface on a clear day in a particular location using either models or experimental measurements. [4,5]Clear-sky global solar radiation provides information about the maximum possible magnitude of the solar resource available at a location of interest. Clear sky global solar radiation can be assessed using empirical models [6-12] or physical models [13-15]. Many authors were interested in calculating the clear-sky global solar radiation. For example, The Adnot model, [10], is modified to get an accurate clear-sky global horizontal irradiance for Singapore [17]. The three models, Ineichen-Perez (I-P), European Solar Radiation Atlas model (ESRA), multilayer perceptron neural network (MLPNN), and radial basis function neural network (RBFNN) were tested using solar irradiance data measured at eight different locations in South Africa. The author found that The I-P model showed the best performance [18]. The ASHRAE Clear-sky model was used for calculating the clear-sky global horizontal solar radiation in Aligarh, India. The author stated that the ASHRAE model is suitable to estimate the hourly solar radiation [19]. Eight measurement stations were used in different locations in Saudi Arabia to obtain new clearness factors for the ASHRAE model. The modified ASHRAE model is found to be reasonable for estimating the radiation components, especially for the monthly values, while the daily profile could have some differences [20]. A model was developed to calculate the hourly solar radiation falling on a horizontal surface in Beni-Suef City, Egypt via a validated simulation model [21]. A clear-sky solar radiation model based on the latest mathematical equations published in European Solar Radiation Atlas was implemented and used with a digital elevation model developed based on the Shuttle Radar Topography Mission database to estimate the clear-sky solar radiation in Romanian territory [3]. Hottel’s model was used for estimating the daily average values of the clear-sky direct normal irradiance in Jeddah-Saudi Arabia. The authors indicated that the average daily values obtained using Hottel’s model, and that obtained from measured ones are in good agreement [22]. The monthly average hourly global solar radiation was calculated in Yemen as a sum of the direct component calculated by the Hottel’s model and the diffuse component calculated by the Liu and Jordan model [23]. The Hottel’s model was tested experimentally for calculating the clear-sky direct solar radiation in Makurdi, Nigeria. The authors concluded that there is slim suitability of Hottel’s model in Makurdi location due to the effect of the climatic factors such as humidity, seasonal variation, and weather because they were not directly taken into consideration in the development of the model [4].In this work, we attempt to test the estimation of the global clear-sky solar radiation in Qena/Egypt using Hottel’s model for calculating the direct component and Liu and Jordan’s model for calculating the diffuse component. The estimated hourly, daily values, and monthly average values will be compared with the corresponding measured clear-sky global solar radiation values at Qena/ Egypt during the period from 2004 to 2012. The model performance is tested using the appropriate statistical analysis.
2. Data and Methodology
- The data used in this study have been measured by the Egyptian national weather authority in the atmospheric laboratory located on the campus of the South Valley University in Qena (26.20 N°; 32.75 E°). Global solar radiation data on a horizontal surface during the period from 2004 to 2012 have been measured using the Precision Spectral Pyranometer (PSP) No. 16317IS, with a spectral range of 0.285 to 2.8 μm. The Combilog Datalogger (No.1020, TH. Friedrichs & CO “Germany”) is used for recording the values of the hourly global solar radiation data. The PSP instrument is calibrated each year. The absolute accuracy of calibration is ±3–4%. Cloud cover is recorded visually for each hour.Qena is a small city in Upper Egypt (26.20 N, 32.75 E, 97 m asl). It is characterized by a very hot and dry summer and relatively cold winter. The average daily maximum temperature reaches 40°C in summer and 25° in winter. The average daily minimum relative humidity is about 17% in summer and 26% in winter [24,25]. There is almost no rain in Qena. The winter average maximum mixing height is 1418 m while the summer average maximum mixing height is 2481 m [26]. The area receives a large amount of solar radiation, especially in the summer, where the monthly average daily global solar radiation reaches about 27 MJ/ m2 in July as stated in [27].The global solar radiation is the sum of the beam radiation and the diffuse radiation. The beam radiation transmitted through the atmosphere in clear-sky conditions in Qena/Egypt has been calculated using Hottel’s model [28], where, the atmospheric transmittance for beam radiation Ib is given as
 | (1) |
 is the hourly beam radiation incident normal to the surface, and
  is the extraterrestrial hourly beam radiation given as
  | (2) |
 is the solar constant, its value is considered as 1367 W/m2, and N is the day number in the year, it varies from 1 to 365. The clear-sky normal beam radiation is given by [29]
 | (3) |
 | (4) |
 is the zenith angle and can be calculated as
 | (5) |
 is the latitude of the location,
 is the declination angle of the sun and can be calculated as
 | (6) |
 is the hour angle and can be determined from the following equation
 | (7) |
 for clear-sky conditions is given by Hottel’s model in the form
 | (8) |
 and
and  are constants determined using the correction factors for different climate types as [29]:
 | (9) |
 and
and  for subtropical summer locations with an altitude less than 2.5 km are 0.99, 0.99, and 1.01, respectively.
  and
and  can be determined from the relations:
 | (10) |
 | (11) |
 | (12) |
 | (13) |
 is the ratio of diffuse radiation to the extraterrestrial beam radiation on the horizontal plane.
2.1. Statistical Evaluation
- To ensure the accuracy of calculation of the clear-sky global solar radiation, some statistical measures are used; the used measures are the mean bias error (MBE), mean absolute bias error (MABE), root mean square errors (RMSE), model efficiency (ME), modeling index (d) and t-statistic test (t). These indices are defined as the following:
 | (14) |
 | (15) |
 | (16) |
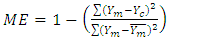 | (17) |
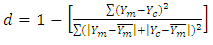 | (18) |
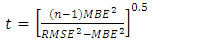 | (19) |
3. Results and Discussion
3.1. Verification of the Monthly Average Hourly Clear-Sky Global Solar Radiation (CSGSR)
- Figure 1 shows the variation of the measured and the calculated values of the monthly average hourly CSGSR during the period from 2004 to 2012 in Qena/Egypt. It is graphically obvious that the measured and the calculated values are close to each other. So, we expect that Hottel’s model and Liu and Jordan’s model can represent the hourly variation of the CSGSR.
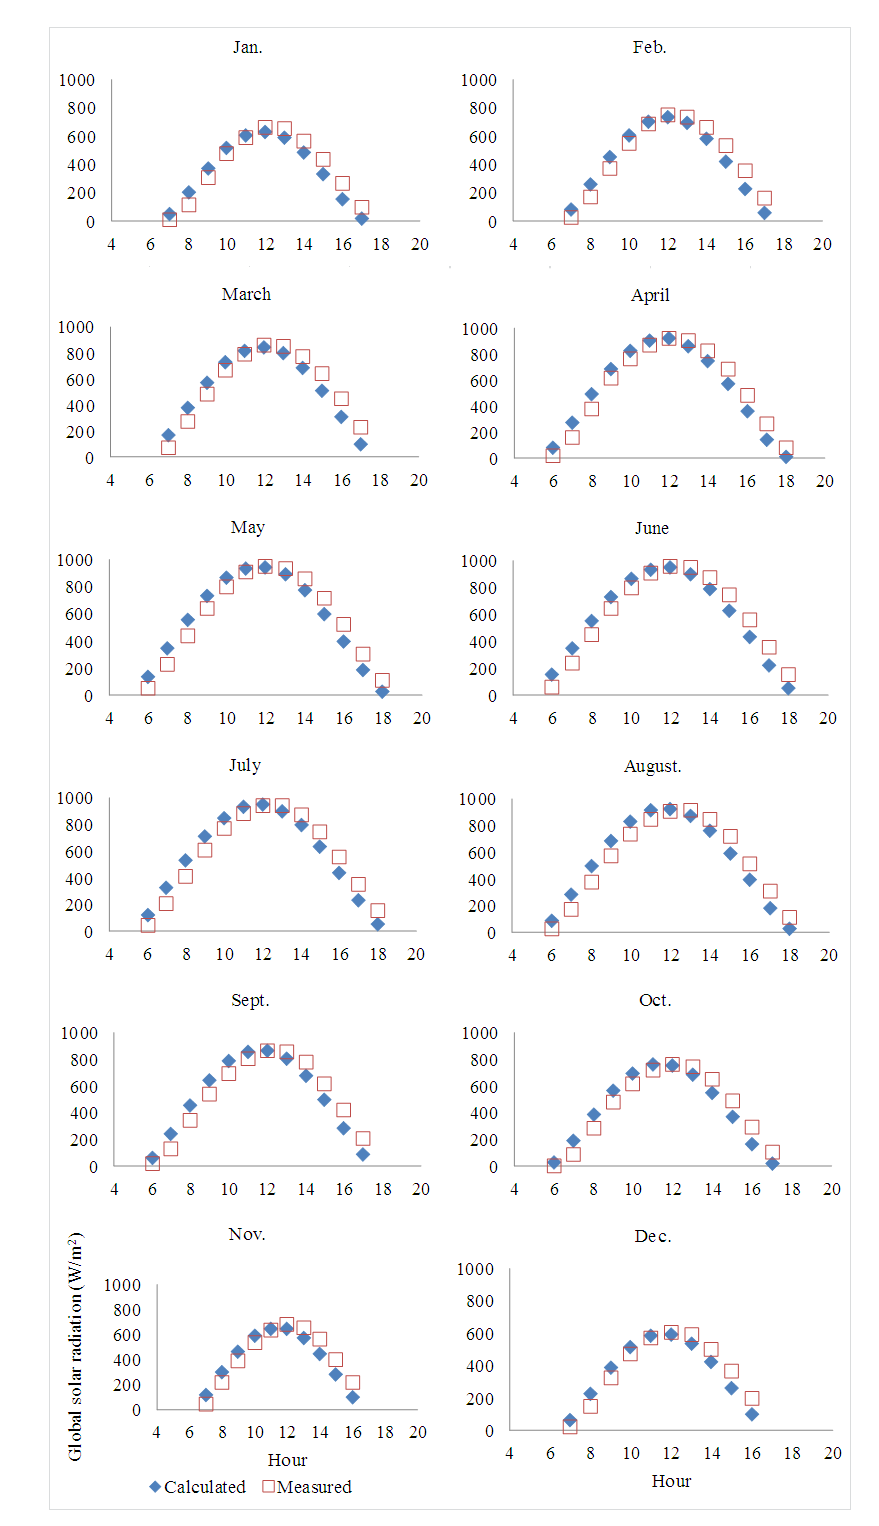 | Figure 1. Variation of the measured and the calculated monthly average hourly clear-sky global solar radiation (W/m2) in Qena during the period from 2004 to 2012 |
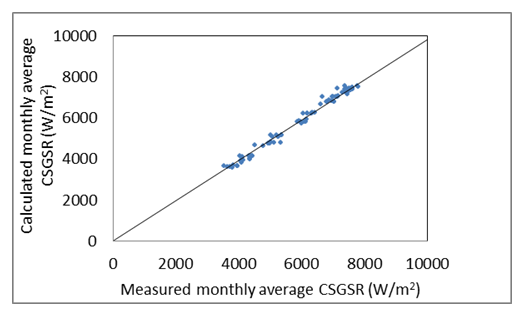
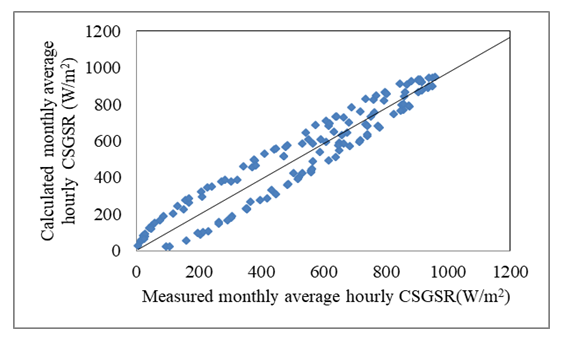 | Figure 2. Relationship between the measured and the calculated monthly average hourly clear-sky global solar radiation in Qena during the period from 2004 to 2012 |
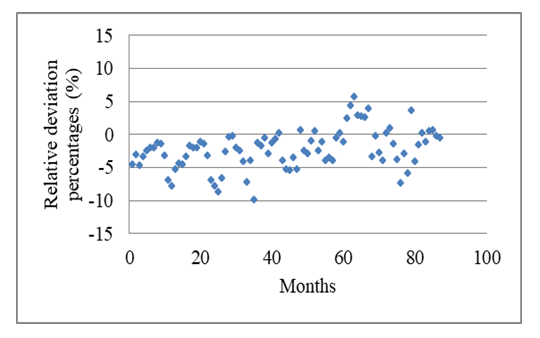
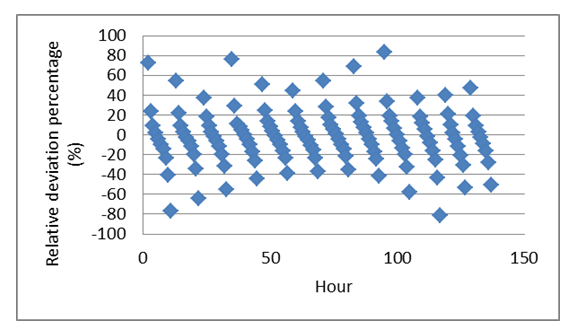 | Figure 3. Relative deviation percentages (%) of the calculated monthly average hourly CSGSR from measured ones at Qena during the study period |
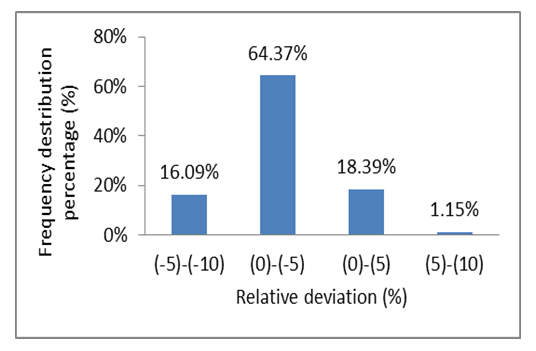
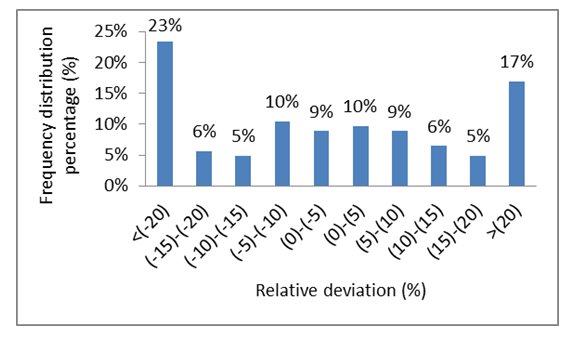 | Figure 4. Frequency distribution of the relative deviation of the monthly average hourly CSGSR from measured ones at Qena during the period of study |
3.2. Verification of the Average Daily Global Solar Radiation
- To test the validity of the Hottel’s Model and the Liu and Jordan’s Model for calculating the average daily values of the CSGSR, the daily values of the CSGSR are calculated from the corresponding hourly values for each day, then, the average daily values of the CSGSR are calculated during the period from 2004 to 2012. Fig. 5 shows the daily variation of the calculated and measured clear-sky global solar radiation for each year during the period from 2004 to 2012, it is clear that the models can represent strongly the daily variation of the clear-sky global solar radiation during the different years. Fig. 6 illustrates the relationship between the measured and the calculated average daily values of the CSGSR during the period from 2004 to 2012. High correlation coefficient (0.97) between the measured and calculated values is found.
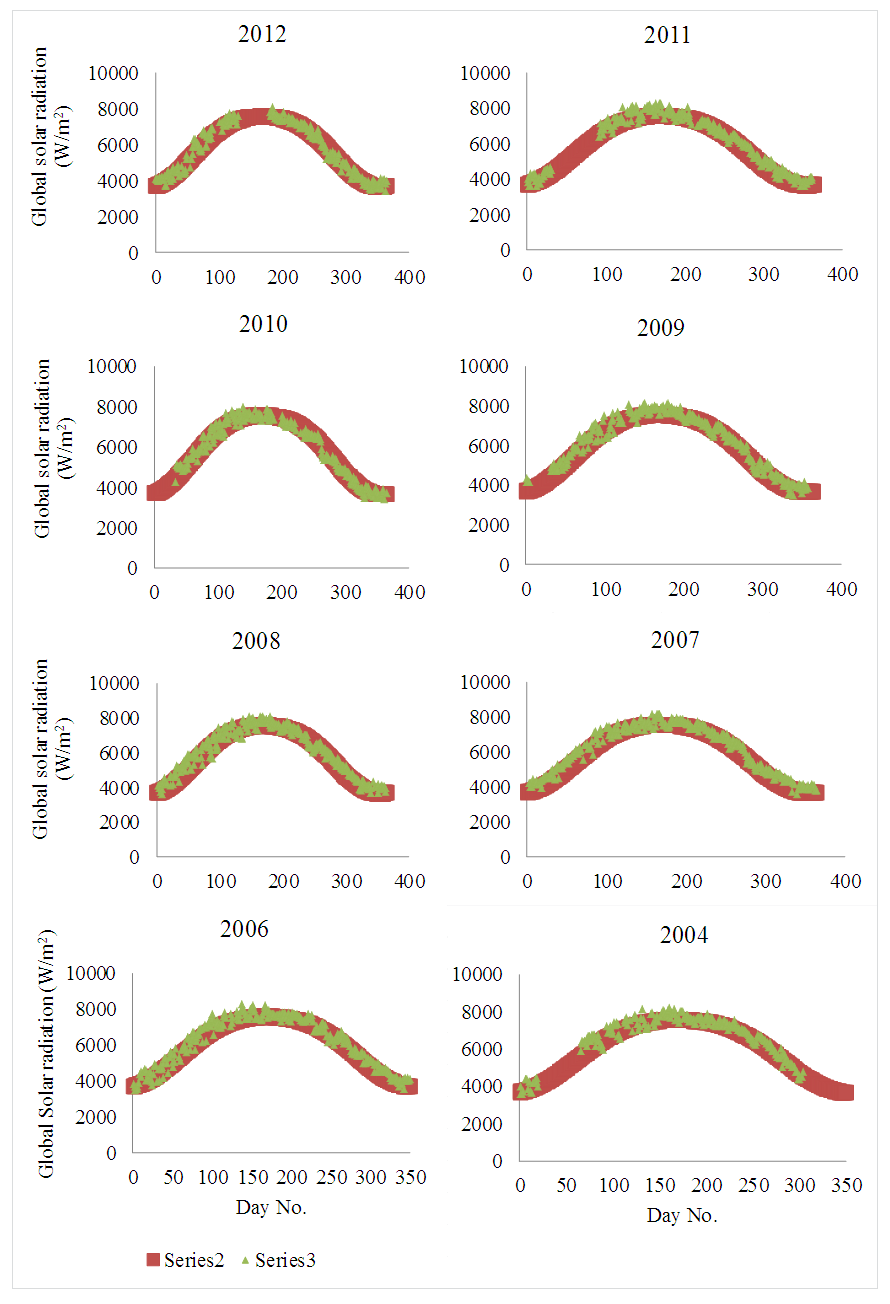 | Figure 5. Daily variation of the calculated and measured clear-sky global solar radiation during the period from 2004 to 2012 in Qena/Egypt |
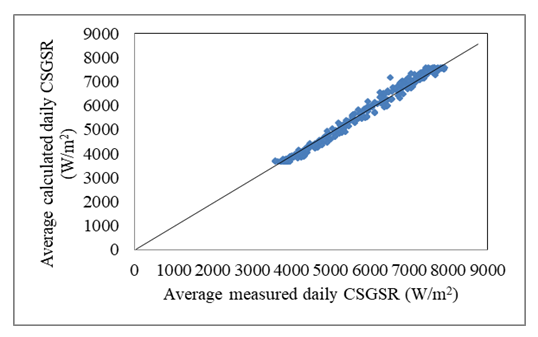 | Figure 6. Relationship between averages of measured daily CSGSR and calculated values in Qena during the period of study |

 and
and  for subtropical summer locations as indicated in section 2. Even though, the deviations during winter and autumn are not exceeded ±10%.
 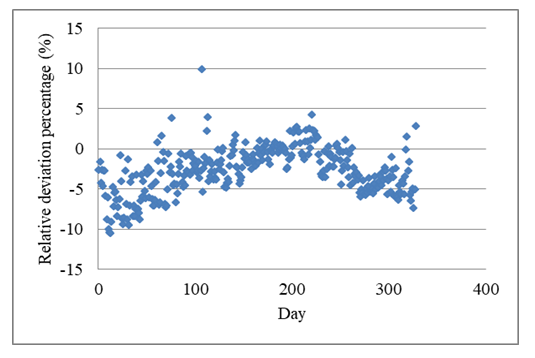 | Figure 7. Relative deviation percentages (%) of the calculated average daily values of CSGSR from measured ones at Qena during the period from 2004 to 2012 |
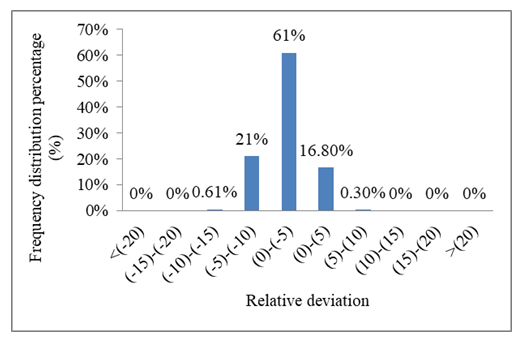 | Figure 8. Frequency distribution of the relative deviation of calculated average daily values of CSGSR from measured ones at Qena during the study period |
3.3. Verification of the Monthly Average Global Solar Radiation
- Figure 9 illustrates the relationship between the measured and the calculated monthly average values of the CSGSR during the period from 2004 to 2012. An excellent correlation (0.99) between the measured and calculated values is found.
 | Figure 9. Relationship between the measured monthly average global solar radiation and the calculated corresponding values in Qena during the period from 2004 to 2012 |
 | Figure 10. Relative deviation percentages (%) of the calculated monthly average global solar radiation from the measured ones at Qena during the period from 2004 to 2012 |
 | Figure 11. Frequency distribution of the relative deviation of calculated monthly average global solar radiation from measured ones at Qena through the study period |
4. Conclusions
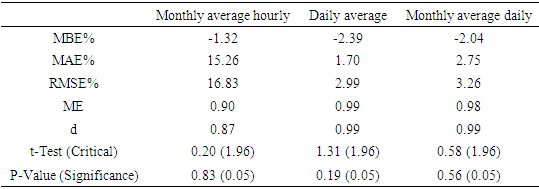
- In this work, the clear-sky global solar radiation CSGSR is estimated in Qena/Egypt using the Hottel’s Model for calculating the component of clear-sky direct solar radiation and the Liu and Jordan’s model for calculating the component of diffuse clear-sky radiation on a horizontal surface. The calculated values were in different time scales, monthly average hourly, average daily, and monthly average. The calculated values are compared with the corresponding measured clear-sky data of the global solar radiation during the period from 2004 to 2012 at Qena/Egypt. Different statistical performance measures are used to ensure the validity of the two models to calculate the CSGSR. It is found that the two models combined can represent the CSGSR in Qena at different time scales. Where, the correlation coefficient between the measured and the calculated values are high, and the error measure parameters, MBE, MABE, and RMSE values are small for different time scales. Also, the model efficiency ME, and the modeling index (d) have high values. The t-statistic test (t) indicated that there is no significant difference between the calculated and the measured values during the different time scales. So that, the Hottel’s Model for calculating the component of clear-sky direct solar radiation and the Liu and Jordan’s model for calculating the component of diffuse clear-sky radiation on a horizontal surface can be used safely for calculating the CSGSR in Qena/Egypt and in other sites with the same climate characteristics.
References
| [1] | Imo-Seouti T, Chan-Ting V, Taufao V, (2010). Feasibility study on wind energy in Samoa. International Journal of Renewable Energy, vol5: 71-83. |
| [2] | Husain Alsamamra, 2013. An estimation of global solar radiation at ground level using clear-sky radiation in Hebron city, Palestine. International Journal of Renewable Energy, Vol. 8, No. 2, July - December 2013. |
| [3] | Ciprian Nemes. (2013). A clear sky irradiation assessment using the European Solar Radiation Atlas model and Shuttle Radar Topography Mission database: A case study for Romanian territory. J. Renewable Sustainable Energy 5, 041807 (2013); https://doi.org/10.1063/1.4813001. |
| [4] | Edeoja, Alex Okibe and Eloka-Eboka, C. Andrew, 2013. Experimental Validation of Hottel’s Transmittance Model for Estimating Beam Radiation In Makurdi Location. American Journal of Engineering Research (AJER). Volume-02, Issue-08, pp-51-57. |
| [5] | R. G. Allen, R. Trezza and M. Tasumi, “Analytical integrated functions for daily. |
| [6] | B. Haurwitz, Insolation in relation to cloudiness and cloud density, Journal Meteorology 2 (1945) 154–164. |
| [7] | B. Haurwitz, Insolation in relation to cloud type, Journal Meteorology 3 (1946) 123–124. |
| [8] | M. Daneshyar, Solar radiation statistics for iran, Solar Energy 21 (1978) 345–349. |
| [9] | G. W. Paltridge, D. Proctor, Monthly mean solar radiation statistics for australia, Solar Energy 18 (1976) 234243. |
| [10] | A. Ianetz, A. Kudish, A method for determining the solar global and defining the diffuse and beam irradiation on a clear day, in:V. Badescu (Ed.), Modeling Solar Radiation at the Earth’s Surface, Springer, Verlag–Berlin, 2008, pp. 93–113. |
| [11] | F. Kasten, G. Czeplak, Solar and terrestrial radiation dependent on the amount and type of clouds, Solar Energy 24 (1980)177–189. |
| [12] | L. Robledo, A. Soler, Luminous efficacy of global solar radiation for clear skies, Energy Conversion and Management 41 (2000)1769–1779. |
| [13] | R. E. Bird, R. L. Hulstrom, Direct isolation models, Tech. Rep. SERI/TR-335-344 (1980). |
| [14] | P. Ineichen, R. Perez, A new air mass independent formulation for the linke turbidity coefficient, Solar Energy 73 (2002) 151–157. |
| [15] | C. Gueymard, A two-band model for the calculation of clear sky solar irradiance, illuminance and photosynthetically activeradiation at the earth surface, Solar Energy 43 (1989) 252–265. |
| [16] | K. Yang, G. W. Huang, N. Tamai, A hybrid model for estimating global solar radiation, Solar Energy 70 (2001) 13–22. |
| [17] | Yang Dazhi, Panida Jirutitijaroen, Wilfred M. Walsh, The Estimation of Clear Sky Global Horizontal Irradiance at the Equator. Energy Procedia 25 (2012) 141 – 148. |
| [18] | Evans Zhandire,2017. Predicting clear-sky global horizontal irradiance at eight locations in South Africa using four models. Journal of Energy in Southern Africa 28(4): 77–86. DOI: http://dx.doi.org/10.17159/2413-3051/2017/v28i4a2397. |
| [19] | Basharat Jamil and Mohd. Maroof Khan. (2014) Estimation of Clear-Sky Solar Radiation Using ASHRAE Model for Aligarh, India. International Journal of Engineering Research and Technology. ISSN 0974-3154 Volume 7, Number 3, pp. 227-236. |
| [20] | Mohamed Abouhashish. Applicability of ASHRAE Clear-Sky Model based on Solar-Radiation Measurements in Saudi Arabia. AIP Conference Proceedings 1850, 140001 (2017); https://doi.org/10.1063/1.4984509 Published Online: 27 June 2017. |
| [21] | H.H. EL-Ghetany, I.T. Zedan, A.A.H. Mostafa and Aya Gamal, (2020) Estimation and Validation of a Clear Sky Hourly Global Solar Radiation in Beni-Suef, Egypt. Egypt. J. Chem. Vol . 63, No. 11 pp. 4483 – 4491. |
| [22] | Ahmad Islahi, Saani Shakil, Mostafa Hamed, (2015). Hottel’s Clear Day Model for a typical arid city – Jeddah. International Journal of Engineering Science Invention, www.ijesi.org || Volume 4 Issue 6|| June 2015 || PP.32-37. |
| [23] | Gamil M. Abdul Aziz, (1990). Estimation of hourly clear-sky solar radiation for P.D.R. Yemen. Solar & Wind Technology. Volume 7, Issues 2–3, Pages 255-260. |
| [24] | Kassem, Kh.O., 2014. Long Range Transport Contribution to PM10 Concentrations in a Subtropical City (Qena/Egypt). World Environ.4, 1–13, doi:10.5923/j.env.20140401.01. |
| [25] | Kassem, Kh.O., S.M. El-Shazzly, M. Takahashi and M.E.-N, Adam, 2009. Variability of surface ozone in some regions in Egypt. Ph. D. Thesis, pp 113-114. |
| [26] | El-Shazly, S.M.; Kh.O. Kassem; A.A. Hassan and E.A. Hala, 2012. Assessment of mixing height at Qena/Upper Egypt based on radiosonde data. Resour. Environ.2, 275–280. |
| [27] | Kassem Kh.O, 2020. Total Solar Radiation and Ideal Incline Angles of a South-Facing Solar Panel in Qena/Egypt. Resources and Environment, 10(1): 10-17. DOI: 10.5923/j.re.20201001.03. |
| [28] | H. C. Hottel, A Simple Model for Estimating the Transmittance of Direct Solar Radiation Through Clear Atmospheres, Solar Energy, 18(2), 1976, 129 – 134. |
| [29] | John A. Duffie and William A. Beckman (2016). Solar engineering of thermal processes. Third edition, JOHN WILEY & SONS, INC. |
| [30] | Liu, B. Y. H. and R. C. Jourdan, (1960). “The Interrelationship and Characteristic Distribution of Direct, Diffuse and Total Solar Radiation” Solar Energy, 4 (3), 1. |
| [31] | Willmott C.J., 1982. Some comments on the evaluation of model performance. Bull. |
| [32] | Mayer D.G. and Butler, 1993. Statistical validation. Ecol. Model, 68: 21-32. |
| [33] | Stone R. J., 1993. Improved statistical procedure for the evaluation of solar radiation. |
| [34] | Togrul, IT. 1998. Comparison of statistical performance of seven sunshine-based models for Elazig, Turkey. Chimica Acta Turcica, 26: 37. |