Rija I. Rakotonirina , Jerry J. C. F. Randrianiaina , Fils Lahatra Razafindramisa
Antananarivo University, Physics Department, Laboratory of Matter and Radiation Physics (LPMR), Madagascar
Correspondence to: Rija I. Rakotonirina , Antananarivo University, Physics Department, Laboratory of Matter and Radiation Physics (LPMR), Madagascar.
| Email: |  |
Copyright © 2020 The Author(s). Published by Scientific & Academic Publishing.
This work is licensed under the Creative Commons Attribution International License (CC BY).
http://creativecommons.org/licenses/by/4.0/

Abstract
The main purpose of this work is to assess the current state of Lake Itasy, the third largest lake in Madagascar. Temperature, pH, electrical conductivity, dissolved oxygen and oxygen saturation are the parameters monitored from October 2017 to October 2019. The temperatures observed are from 18.1°C to 30.3°C with a mean 23.1 3.07°C; the electrical conductivities are from 42.2µS.cm-1 to 76.4µS.cm-1 with a mean 58.94
 8.40 µS.cm-1; the pH measured is from 7.16 to 8.31 with a mean 7.76
 0.31; the dissolved oxygen contents are from 4.0 mg.L-1 to 9.7 mg.L-1 with a mean 7.8
 1.08 mg.L-1, the oxygen saturations are from 51% to 113% with a mean 90
 12%. Comparison of these current values with fifty years before shows slight changes in the state of the lake; temperature and pH increase while the electrical conductivity decrease. However, the current values remain largely within the established standards for surface and freshwater in general. The second part of the work is devoted to understanding the seasonal evolution of these five parameters. A multivariate statistical analysis show that different behaviours are observed for this lake depending on whether it is in the rainy season, in the dry and cold season or in the hot season.
Keywords:
Itasy, Principal component analysis, Temperature, Electrical conductivity, Dissolved oxygen, Oxygen saturation
Cite this paper: Rija I. Rakotonirina , Jerry J. C. F. Randrianiaina , Fils Lahatra Razafindramisa , Reinforcement of Knowledge of Some Parameters of Lake Itasy in Order to Establish Its Current State of Health, Resources and Environment, Vol. 10 No. 2, 2020, pp. 19-26. doi: 10.5923/j.re.20201002.01.
1. Introduction
Lake Itasy is of major importance for the economic development of Itasy region. Many activities are constantly created and developed all around the lake and its watershed and even in more distant regions. The fish farming activity is important sources of income for the local population, the profits brought by the activities related to tourism are even more important. However, the development of tourism in Itasy region could have an ecological cost; indeed, there is a rapid urbanization of the watershed, especially in the western part of the lake with the establishment of many hotel complexes and the increase in population. Studies carried out on numerous water surfaces around the world have confirmed that the increase in population is a major cause of pollution of the lake environment [1-3]. Recent studies by remote sensing on Lake Itasy have been motivated by the need to gather more knowledge on this lake [4,5]. The objective of this present work is to update the knowledge of certain physicochemical parameters of the water of this lake; these parameters are temperature, pH, electrical conductivity, dissolved oxygen and dissolved oxygen saturation. The first part is a presentation of the data collected during the two years of monitoring. A comparison is made with 50 years before data [6] to get an idea for a possible change. In the second part, a multivariate statistical analysis is carried out in order to understand the behaviour of the lake according to the season in Madagascar. A simultaneous study of the behavior of the 5 parameters should reveal much more information than separate analyzes of each parameter. The principal component analysis (PCA) used for several years for the physicochemical studies of lake environments and water quality will be used for the multivariate analysis of data in this work [7-11].
2. Materials and Methods
2.1. Study Area
Lake Itasy, which is the subject of our study, is the third largest lake in Madagascar in area (approximately 35km2). It is located at 19°04’ South latitude and 46°47’ East longitude (Figure 1). This lake is a volcanic barrage lake dating from the Quaternary era.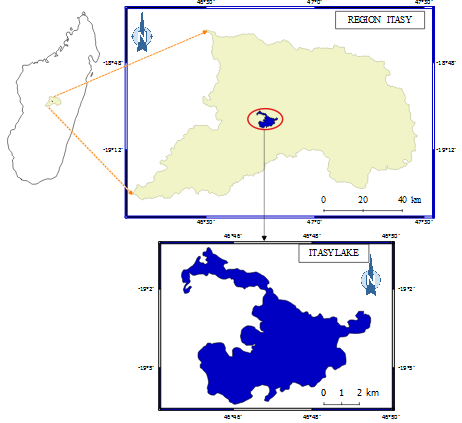 | Figure 1. Study area |
2.2. Measurements and Data Analysis
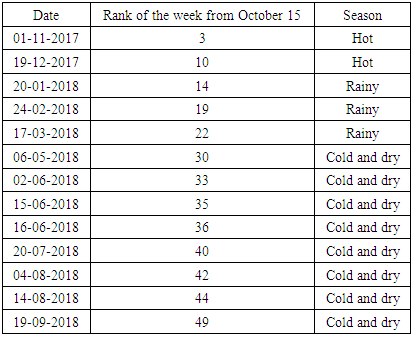
Measurements of temperature (T), potential for hydrogen (pH), electrical conductivity (ED) and dissolved oxygen (DO) parameters are carried out on site using a PCE-Instruments PCE-PHD1 measuring device [12]; oxygen saturation is determined from the measured values for dissolved oxygen and temperature.Monitoring of the lake was carried out from October 2017 to October 2019. The measurement dates are given in tables (1-a) and (1-b). The majority of the measurements were taken between 10 a.m. and 1 p.m. at the sites marked in Figure 2. The parameters are measured for a depth of 0.75 m to 1 m.Table 1-a. Dates of measurements for the first year of monitoring (15-10-2017 to 14-10-2018)
 |
| |
|
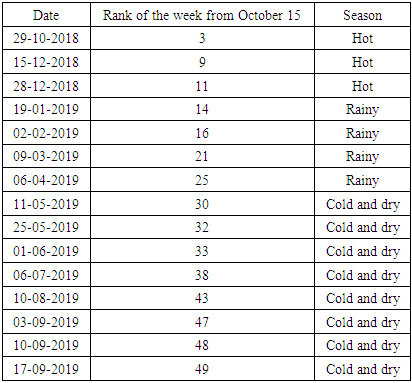
Table 1-b. Dates of measurements for the second year of monitoring (15-10-2018 to 14-10-2019)
 |
| |
|
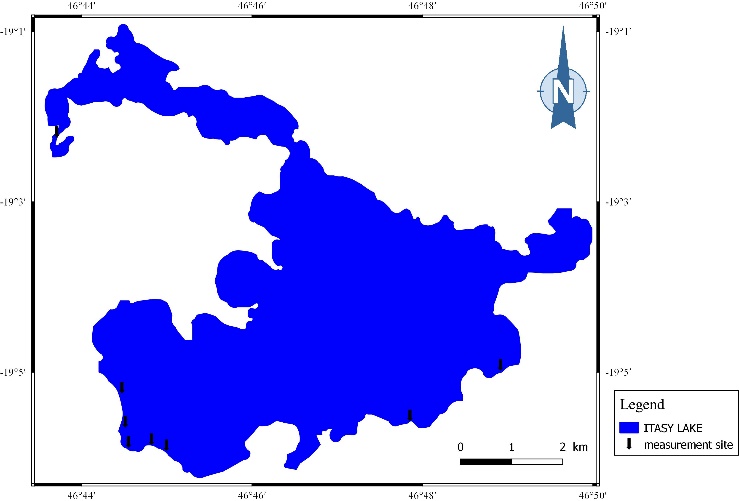 | Figure 2. Measurements sites |
For each measurement day, we calculated the average of the values for the different parameters so as to retain only the daily averages for the statistical analysis. For this article, the goal is to understand the temporal behavior of the parameters monitored.Statistical data processing is carried out using R software (version 3.5.1) [13] and Rstudio software (version 1.1.463) [14]; the use of the R language is very widespread in the scientific community.
2.3. Methodology of Principal Component Analysis [15] [16] [17]
2.3.1. Main Idea of PCA
Monitoring gives a data set X with p columns (p = 5 variables for this study) and n rows (n individuals labeled by their dates). It is difficult to highlight the global relationships between the variables when p>3 and it is complicated to classify individuals because visualization is only possible for p≤3. The PCA solves this problem by determining a subspace of lower dimensionality d<p (d new axes) on which it is possible to project the point cloud relating to the data set; but the projection of the cloud keeps as much information as possible compared to the initial cloud (d must be small, preferably d = 1, 2, 3 for it to be possible to visualize). The resulting subspace is called factorial subspace and its axes are called factor axes. Defining this factorial subspace means defining d new variables (new axes of the coordinate system) of the point cloud: these new variables are the main components.
2.3.2. Search for the Main Components in the Case of Standardized Variables
As there are large differences between the ranges of initial variables and they have different units, it is necessary to work with standardized variables (centered and reduced).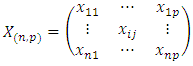 standardized to
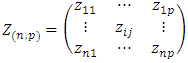 where
where | (1) |
 is the mean of the variable
  et
et  is the standard-deviation of the variable
  .In the case of standardized variables, the search for principal component means to solve an eigenvalue problem
 | (2) |
where R is the correlation matrix of the standardized variables  the eigenvector
  is the directing vector of the factorial axis (principal component of rank i),the eigenvalue
  is the total variance explained by the principal component of rank i.With p initial variables, R is a p × p symmetric matrix; the resolution of equation (2) gives p eigenvalues associated with p eigenvectors.Once eigenvectors are found from covariance (correlation) matrix, the next step is to order them by eigenvalue, highest to lowest. This gives the components in order of significance.
2.3.3. Cloud Projection on the Main Planes
One matrix B is formed, each column of B is made up of the coordinates of the normalized eigenvectors of R (the eigenvectors associated with the largest eigenvalues are in the first columns).The coordinates of the cloud in the subspace are given by  | (3) |
2.3.4. Variables Factor Map
These new variables are linear combinations of the old variables, it is then possible to estimate the correlations of the old variables with the new variables, it is also easier to give an interpretation to the new variables by knowing these correlations. The representation of the old variables will be done by taking as coordinates of the old variables their coefficients of correlation with the new variables. As the correlation coefficient varies in [-1;1], all the points obtained when representing the old variables on two new axes are inside a circle of unit radius which is called "correlation circle".
3. Results and Discussions
3.1. Separate Analysis of Each Parameter
For the representations of the values of each of the parameters, the abscissa corresponds to the rank of the week taking as its origin October 15 which is the start of the hurricane season in Madagascar.
3.1.1. Temperature
Figures [3-a] and [3-b] respectively show the means of the temperatures measured from October 15, 2017 to October 14, 2018 [Figure 3-a] and from October 15, 2018 to October 14, 2019 [Figure 3-b].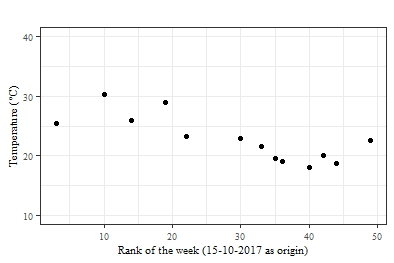 | Figure 3-a. Temperature of Lake Itasy from October 15, 2017 to October 14, 2018 |
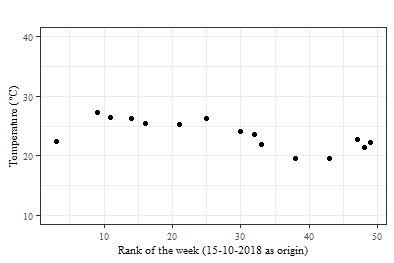 | Figure 3-b. Temperature of Lake Itasy from October 15, 2018 to October 14, 2019 |
The water temperature rises during the hot season (November, December) and it drops during the cold season (June, July, August, September) [figures 3-a and 3-b]. For these two years of monitoring, the lowest value is 18.1°C (July 2018) while the highest value is 30.3°C (December 2017) and the mean is 23.1 3.07°C. For a depth of 0.75m to 1m, one expects that the water temperature will be dictated by weather conditions.
3.1.2. Electrical Conductivity
Figures [4-a] and [4-b] respectively show the means of the electrical conductivities measured from October 15, 2017 to October 14, 2018 [fig 4-a] and from October 15, 2018 to October 14, 2019 [fig 4-b].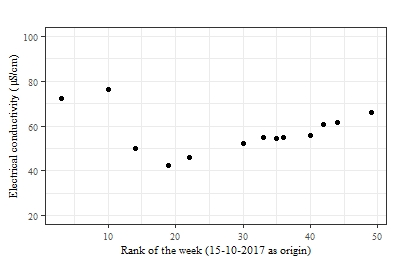 | Figure 4-a. Electrical conductivity of Lake Itasy from October 15, 2017 to October 14, 2018 |
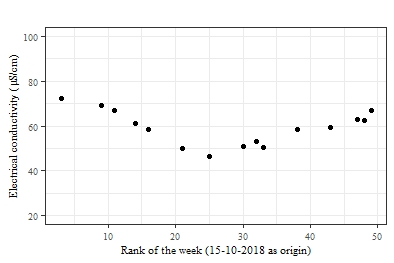 | Figure 4-b. Electrical conductivity of Lake Itasy from October 15, 2018 to October 14, 2019 |
The electrical conductivity is at its lowest value during the season of highest precipitation (January, February, March, April) and it increases gradually during the dry season (June, July, August, September) until reaching its highest values at the end of the dry season and at the start of the hot season (November, December). For these two years of monitoring, the mean is 58.94 8.40 µS.cm-1, the lowest electrical conductivity is 42.2 µS.cm-1 (February 2018) while the highest electrical conductivity is 76.4 µS.cm-1 (December 2017).
3.1.3. Potential for hydrogen
Figures [5-a] and [5-b] respectively show the means of the potential for hydrogen measured from October 15, 2017 to October 14, 2018 (figure 5-a) and from October 15, 2018 to October 14, 2019 (figure 5-b).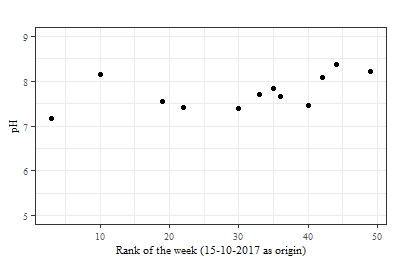 | Figure 5-a. Potential for hydrogen of Lake Itasy from October 15, 2017 to October 14, 2018 |
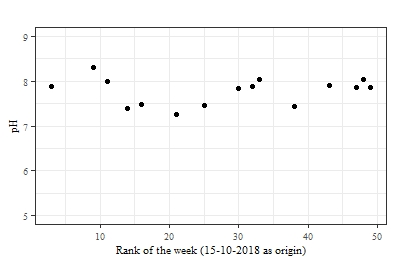 | Figure 5-b. Potential for hydrogen of Lake Itasy from October 15, 2017 to October 14, 2018 |
The pH has a very irregular curve if we refer to these graphs [Figures 5-a, 5-b]. However, the low value of the standard deviation (0.31) compared to an average of 7.76 seems to indicate a certain stability around this average of pH. The lowest pH is 7.16 (November 2017) while the highest pH is 8.31 (December 2018).
3.1.4. Dissolved Oxygen
Figures 6-a and 6-b respectively show the means of the dissolved oxygen measured from October 15, 2017 to October 14, 2018 (figure 6-a) and from October 15, 2018 to October 14, 2019 (figure 6-b).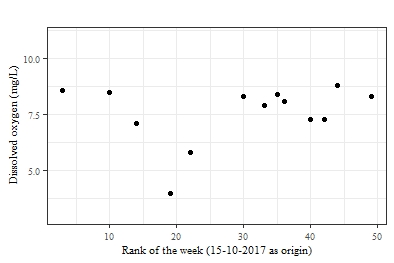 | Figure 6-a. Dissolved oxygen of Lake Itasy from October 15, 2017 to October 14, 2018 |
 | Figure 6-b. Dissolved oxygen of Lake Itasy from October 15, 2018 to October 14, 2019 |
In general, dissolved oxygen takes on high values during the cold season (June, July, August), this can be explained by the fact that the solubility of oxygen and gases in general varies inversely with temperature. The oxygen content seems to drop very slightly during the season of heavy precipitation (January, February, March, April); the accumulation of decomposing plant matter around the measurement sites seems to be the cause of this drop in the oxygen content of the lake. Less regular increases in OD are observed at different times for the two years of follow-up; a possible reason is that for a depth of 0.75m-1m the weather conditions (the wind) can influence the oxygenation of the water. For these two years of monitoring, the mean is 7.8 1.08 mg.L-1, the lowest dissolved oxygen is 4.0 mg.L-1 (February 2018) while the highest dissolved oxygen is 9.7 mg.L-1 (August 2019).
3.1.5. Oxygen Saturation
Figures 7-a and 7-b respectively show the means of the oxygen saturation measured from October 15, 2017 to October 14, 2018 (figure 7-a) and from October 15, 2018 to October 14, 2019 (figure 7-b).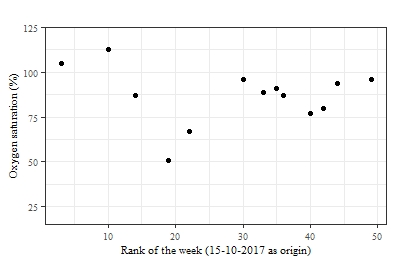 | Figure 7-a. Oxygen saturation of Lake Itasy from October 15, 2017 to October 14, 2018 |
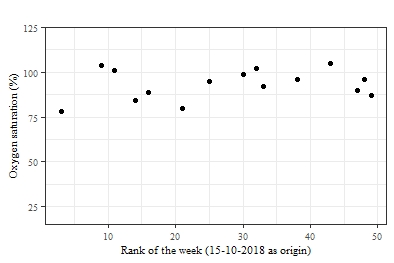 | Figure 7-b. Oxygen saturation of Lake Itasy from October 15, 2018 to October 14, 2019 |
The dissolved oxygen saturation rises in November-December. When the water temperature is very hot, 100% of dissolved oxygen saturation corresponds to not very high oxygen content. The minimum oxygen saturation found is 51% (February 2018) and the maximum value found is 113% (December 2017); the mean is 90 12%.
12%.
3.2. Evolution for the Last Fifty Years
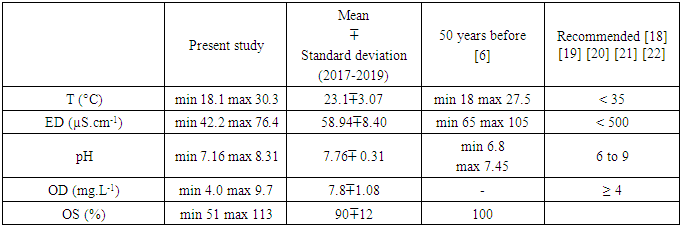
Table 2 presents a summary of the measurements obtained from October 2017 to October 2019 by comparing them with the values of the parameters relating the state of the lake fifty years earlier.Table 2. Summary of the current state and the state of Lake Itasy fifty years ago
 |
| |
|
Electrical conductivity and pH are variables that show the greatest change for these 50 years, EC seems to have decreased in the last 50 years; whereas for pH, the values shift slightly towards higher values.For temperature, we observe higher maximum values nowadays, nevertheless the values that we report here are mean values for an hourly range from 10 am to 1 pm; very low temperature values can be observed at night or very early in the morning. Moreau. J [6] doesn’t mentioned the hour of his measurements.Despite all these changes, the comparison of Lake Itasy with other lakes, with certain criteria recommended for aquatic life and the exploitation of bodies of water for fish farming shows that Lake Itasy is currently in very good condition based on these 5 parameters [18-22].
3.3. Multivariate Analysis
3.3.1. Correlation of the initial variables
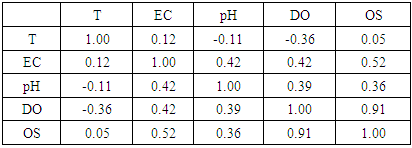
Table 3. Correlation matrix of the initial variables
 |
| |
|
Although this correlation matrix is mainly calculated for future use in the PCA, the following information can already be mentioned from this matrix. The linear correlation is very strong (0.91) between the dissolved oxygen content and the dissolved oxygen saturation. These two parameters vary in the same direction.The correlation of the conductivity with, respectively in the order of importance, the oxygen saturation (0.52), the dissolved oxygen (0.42) and the pH (0.42) indicates a significant linear correlation of ED with OS, OD, pH.The positive value of the correlation coefficient makes it possible to confirm an increase in ED in the same direction with these three parameters OS, OD, pH.The negative sign of the correlation between dissolved oxygen and temperature (-0.36) is largely explained by the decrease in the solubility of gases when the temperature increases.The temperature is not linearly linked with the OS, pH and EC parameters as can be seen with the values very close to 0 of the linear coefficients (respectively 0.05, -0.11, 0.12).
3.3.2. Decomposition of Inertia
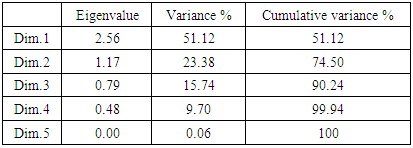
Table 4 represents the eigenvalues (variances) of the main components and the percentages of variances explained.Table 4. Eigenvalues (variances) of the main components and the percentages of variances explained
 |
| |
|
As it can be seen in Table 4, the first two dimensions explain 74.50% of the total inertia of the data set; which means that 74.50% of the total variability of the cloud of individuals is represented in this plane (Dim1; Dim2).The first component explains 51.12% of the data variability; the second component explains 23.38% of the data variability.The variance explained by the third component is 15.74% which is less than 20% (threshold value for 5 initial variables). The 3rd main component can be discarded; so the 4th and the 5th are eliminated too.Only two dimensions contain real information and the analysis will be limited to this single plane (Dim1; Dim2).
3.3.3. Description of the plane (Dim1; Dim2)
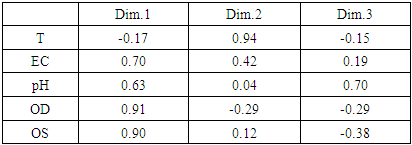
Table 5. Correlation of variables with (Dim1; Dim2)
 |
| |
|
Dim1: The correlation values of the dissolved oxygen, saturation, electrical conductivity, pH variables with the first component are respectively 0.91, 0.90, 0.70, 0.63; this axis therefore opposes individuals with a high OD, high OS, high EC and high pH values (on the right) to individuals with a low OD, low OS, low EC and low pH (on the left).Dim2: Only the temperature which has a correlation of 0.94 with this component is to be retained for the interpretation of this dimension. This axis opposes individuals of low temperature to individuals of higher temperature (from bottom to top).“Variables map” shown in figure 8 summarizes the description of the plane (Dim1; Dim2) and helps in the interpretation of projection on this plane.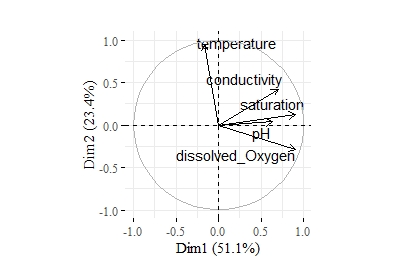 | Figure 8. Variables factor map (PCA) |
3.3.4. Analysis of Individuals
The calculation of the coordinates of the individuals in the plane (Dim1; Dim2) gives the representation of the individuals shown in figure 9. A classification is made from the coordinates of the individuals in this plane (Dim1; Dim2).The classification made on individuals reveals 3 clusters as shown in figure 9.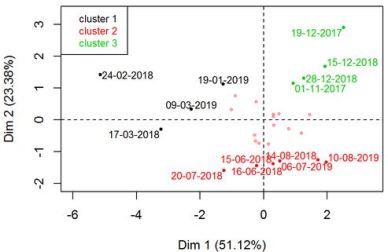 | Figure 9. Classification of the individuals |
The cluster 1 is made of individuals such as 24-02-2018, 17-03-2018, 19-01-2019 and 09-03-2019. This group is characterized by low values for dissolved oxygen, saturation, pH and conductivity.The cluster 2 is made of individuals such as 15-06-2018, 16-06-2018, 20-07-2018, 14-08-2018, 06-07-2019 and 10-08-2019. This group is characterized by:* high values for dissolved Oxygen* low values for temperatureThe cluster 3 is made of individuals such as 01-11-2017, 19-12-2017, 15-12-2018 and 28-12-2018. This group is characterized by high values for the variables conductivity, temperature and saturation.The observation of the individuals (labelled by dates in table 1-a, 1-b) of each cluster shows that Lake Itasy changes according to the season. Indeed, cluster 1 is made of dates belonging to the rainiest period in Madagascar; cluster 2 consists of dates belonging to the cold and dry season; cluster 3 consists of dates belonging to the hottest period.These two years of monitoring allowed us to highlight the following facts:* During the rainy season, low values for the dissolved oxygen, saturation, pH and conductivity parameters are observed.* During the cold and dry season, high dissolved oxygen values associated with low temperature values are observed.* During the hottest season of the year, high values of conductivity, temperature and oxygen saturation are observed.
4. Conclusions
This work is a contribution to the updating and deepening of knowledge of Lake Itasy. Comparison of the current data with the values of the parameters dating from around fifty years revealed a slight change in the state of the lake, in particular an increase in value for the pH and temperature and a decrease in the range of values for the conductivity. The current values of the parameters monitored are, however, in the freshwater quality standards.Multivariate statistical analysis brought a more precise knowledge of the behaviour of the lake, in particular by revealing its state according to whether it is in hot, dry and cold or rainy season. This fact can greatly reduce the work of monitoring because the observation of behaviour deviating from that expected for the season, when measurements will be done, will lead to the conclusion of abnormal phenomenon in the lake.
References
| [1] | Tianma Yuan, Kiran Kumar Vadde, Jonathan D. Tonkin, Jianjun Wang, Jing Lu, Zimeng Zhang, Yixin Zhang, Alan J. McCarthy, Raju Sekar. (2019). Urbanization Impacts the Physicochemical Characteristics and Abundance of Fecal Markers and Bacterial Pathogens. Surface Water, Int. J. Environ. Res. Public Health 2019, 16, 1739. doi:10.3390/ijerph16101739. |
| [2] | Marielle Naah. (2013). Impact du développement urbain du bassin versant de la rivière Mingoa sur le lac municipal de Yaoundé (Cameroun). Thèse de Doctorat, Sciences de la Terre, Université Paris-Est, 2013. NNT: 2013PEST1131. pastel-00976636. |
| [3] | Lévêque Christian, Paugy Didier. (2006). Impacts des activités humaines. In: Lévêque Christian (ed.), Paugy Didier (ed.). Les poissons des eaux continentales africaines: diversité, écologie, utilisation par l'homme. Paris: IRD, 395-413. ISBN 2-7099-1589-8. |
| [4] | Jerry J.C.F. Randrianiaina, Rija I. Rakotonirina, Jean R.Ratiarimanana, Fils Lahatra Razafindramisa, 2018, Temperature Retrieval of Lake Itasy Using Remote Sensing, Resources and Environment 2018, 8(6): 241-244 doi:10.5923/j.re.20180806.01. |
| [5] | Jerry J.C.F. Randrianiaina, Rija I. Rakotonirina, Jean R. Ratiarimanana, Fils Lahatra Razafindramisa, 2019, Modelling of Lake Water Quality Parameters by Deep Learning Using Remote Sensing Data, American Journal of Geographic Information System 2019, 8(6): 221-227. |
| [6] | Moreau. J (1987). Zones humides et lacs peu profonds d’Afrique, Editions de l’ORSTOM, Institut Français de Recherche Scientifique pour le Développement en Coopération, Collection Travaux et Documents n°211, édités par Burgis M. J, Symoens J. J 1987. |
| [7] | Hamed M (2019) Application of Surface Water Quality Classification Models Using Principal Components Analysis and Cluster Analysis. Irrigat Drainage Sys Eng 8: 231. doi: 10.4172/2168-9768.1000231. |
| [8] | Wen-Cheng Liu, Hwa-Lung Yu, Chung-En Chung (2011). Assessment of Water Quality in a Subtropical Alpine Lake Using Multivariate Statistical Techniques and Geostatistical Mapping: A Case Study. Int. J. Environ. Res. Public Health 2011, 8, 1126-1140. doi:10.3390/ijerph8041126. |
| [9] | Sadat et al. (2011). Multivariate analysis for assessment of physicochemical quality of water of a tropical lake system: case of Yamoussoukro lakes (Côte d’Ivoire). |
| [10] | Heidar Zarei, Mohsen Pourreza Bilondi (2013) Factor analysis of chemical composition in the Karoon River basin, southwest of Iran. Appl Water Sci (2013) 3: 753-761. DOI 10.1007/s13201-013-0123-0. |
| [11] | Lei Zhang, Meifang Zhong, Yixin Xu, Zhongyu Wang, Hai Huang (2019). The water quality evaluation in Balihe Lake based on Principal Component Analysis. Journal of Geoscience and Environment Protection, 2019, 7, 38-48. https://doi.org/10.4236/gep.2019.78003. |
| [12] | PCE Instruments France. (2017). Notice d’emploi de PCE-PHD1. |
| [13] | The R Project for Statistical Computing (2020) [online] https://www.r-project.org/. |
| [14] | Rstudio (2020) [online] https://rstudio.com/. |
| [15] | K. Pearson. (1901). On lines and planes of closest fit to systems of points in space. Philos Mag A, 1901, 6:559–572. |
| [16] | Abdi H, L.J Williams. (2010) Principal component analysis, 2010 John Wiley & Sons, Inc. WIREs Comp Stat 2010, Vol 2, 433–459. |
| [17] | IT. Jolliffe, Cadima J. (2016). Principal component analysis: a review and recent developments. Phil. Trans. R. Soc. A 374: 2015202; http://dx.doi.org/10.1098/rsta.2015.0202. |
| [18] | Shib Abir. (2014). Seasonal variations in Physico-Chemical Characteristics of Rudrasagar Wetland-A Ramsar Site, Tripura, North East, India, Res.J.Chem. Sci 2014, Vol.4(1), 31-40. |
| [19] | FAO [online] http://www.fao.org/tempref/FI/CDrom/FAO_Training/FAO_Training/General/x6709f/x6709f02.htm. |
| [20] | DE VILLERS J et al. (2005). Qualité physico-chimique des eaux de surface: cadre général. Institut Bruxellois pour la Gestion de l’environnement/ Observatoire des données de l’Environnement, Les Données de l’IBGE: «L’eau à Bruxelles», 2005. |
| [21] | Hasni Tfeil et al. (2018). Caractérisation Physico-Chimique des eaux de surface et étude de la diversité Ichtyologique de quelques zones humides continentales en Mauritanie, European Scientific Journal, 2018, Vol.14, 84-101. |
| [22] | Falconbridge Nc Sas. (2001). Etude environnementale sur la qualité de l’eau et des sédiments en milieu continental. Projet Koniambo. |

 Abstract
 Reference
 Full-Text PDF
 Full-text HTML