Resources and Environment

p-ISSN: 2163-2618    e-ISSN: 2163-2634

2020;  10(1): 10-17

doi:10.5923/j.re.20201001.03


Total Solar Radiation and Ideal Incline Angles of a South-Facing Solar Panel in Qena/Egypt

Khalafallah O. Kassem1, 2

1Physics Department, College of Science, Jouf University, Sakaka, Saudi Arabia

2Physics Department, Faculty of Science, South Valley University, Qena, Egypt

Correspondence to: Khalafallah O. Kassem, Physics Department, College of Science, Jouf University, Sakaka, Saudi Arabia.

Email:

Copyright © 2020 The Author(s). Published by Scientific & Academic Publishing.

This work is licensed under the Creative Commons Attribution International License (CC BY).
http://creativecommons.org/licenses/by/4.0/

Abstract

The total Solar Radiation (SR) and the Ideal Incline Angles (IIA) of a south-facing solar panel have been calculated in Qena (26.20° N; 32.75° E; 97m asl), Egypt to maximize the performance of solar energy transformers and photovoltaic (PV) panels. Calculations of the IIA were performed at daily, monthly, seasonal and annual time scales. The Egyptian Meteorological Authority measured the used global and diffuse SR data for five years (2012–2016) in the campus of South Valley University in Qena. Results indicated that the monthly IIA varied from 0° in June and July to 58.9° in December. The seasonal IIA values are 56.3°, 29.7°, 0.1°, and 22.3° during winter, spring, summer, and autumn, respectively. The annual IIA was 27.1°. Besides, for surfaces adjusted at monthly, seasonal and annual IIA, the percentage gains in annual average total SR were 13.64%, 12.78%, and 6.57%, respectively. The percentage losses resulted in using surfaces adjusted at seasonal and annual IIA were 0.78% and 6.24%, respectively in comparison to that adjusted at monthly IIA.

Keywords: Solar energy, Solar panels, Ideal incline angle, Percentage gain, Percentage loss

Cite this paper: Khalafallah O. Kassem, Total Solar Radiation and Ideal Incline Angles of a South-Facing Solar Panel in Qena/Egypt, Resources and Environment, Vol. 10 No. 1, 2020, pp. 10-17. doi: 10.5923/j.re.20201001.03.

1. Introduction

The solar radiation is abundant in most parts of the world, especially between latitudes 20o and 30o in the north and south of the equator due to the lake of cloud cover in these regions. This abundant solar radiation will enhance using solar photovoltaic (PV) panels and solar collectors to generate electricity and heat energy and to fill the deficit in the traditional energies such as oil, coal, and gas. Also, curb the continuous increase in carbon dioxide concentration, which leads to global warming and harmful environmental effects. [1-3].
The amount of solar energy falling on a specific surface depends on the climate characteristics of the region and many other parameters such as clearness index, turbidity coefficients, angle of inclination and direction of the surface. Therefore, it is necessary to calculate the IIA of solar collectors and panels for each location separately. [4,5].
Many studies on the estimation of the IIA of solar collectors and panels have been performed. [6] calculated the IIA of south-facing solar panels in Madina in Saudi Arabia, using measured data of daily global and diffuse SR on a horizontal surface, results indicated that using monthly IIA led to collect the maximum solar energy. The annual IIA was found to be almost equal to the site latitude. Besides, It was found that using the yearly IIA results in an annual loss in the amount of collected energy about 8% in comparison with that collected using the monthly IIA. [7] used a mathematical model to determine IIA and orientation in the high latitudes zone in the southern hemisphere. Results indicated that using daily and monthly IIA maintained almost the same total amount of SR and that the percentage gain of the yearly adjusted surface was 1.8. Also, [8] used a mathematical model to determine the SR on an inclined surface and determined the IIA and surface azimuth angle for the solar collector in the main Syrian zones. Results indicated that the monthly IIA and the daily IIA lead to approximately near the maximum amount of total SR. [9] determined the IIA and azimuth angle of solar PV in the continental United States and compared the yearly global irradiation incident on a panel at optimum orientation with the SR received by a flat horizontal panel and a 2-axis tracking panel. Results indicated that irradiation at ideal fixed-incline increased with increasing latitude by 10%–25% per year. Also, the Irradiation incident on a 2-axis tracking panel in one year was 25%–45% higher than irradiation received by a panel at an ideal fixed orientation. In Turkey, [10] determined the IIA using measured SR data. Results indicated that the daily IIA varied from 0° to 65°. Also, he correlated the IIA with the declination angle by three models. [11], in Abu Dhabi, UAE determined the IIA and the azimuth angle for solar panels and collectors. Results indicated that the IIA was close to the latitude of the location and the best azimuth angle was to the south direction [3]. IIA of a south-facing solar surface in Tabass, Iran were estimated for each month and different periods by [12]. They used nine diffuse models to estimate the horizontal diffuse component. Results showed that the monthly IIA varies from 0° to 64°, the yearly IIA was found to be 32°, which is close to the latitude of Tabass (33.36°). They indicated also that the gain in annual solar energy is almost the same for surfaces adjusted at IIA in all periods. [13] Studied PV array performance in Brisbane, Australia. They found that the modelled and measured data are in good agreement. Therefore, they used the model to estimate PV system performance at different incline angles and azimuths. [14] studied the effect of changing azimuth angle in the performance of the photovoltaic system in Ritsumeikan University, Japan. They found that due to the superior output performance of amorphous silicon solar cells for thermal recovery effect in summer, the amorphous silicon solar cells installed at the horizontal side produce the output of 104% as high as that of single crystalline silicon solar cells at the south side. Also, they found that the total output power from June 2000 to May 2001 from poly Si north side is 67% of that from the south side.
For calculating the IIA of the flat-plate solar collectors in Cyprus, [15] employed theoretical models to calculate the beam and the diffuse SR components using the measured daily global SR. He calculated the SR on an inclined surface as an inclined angle varied from 0° to 90°. Results indicated that almost maximum energy can be collected by seasonally adjusted surfaces. [16] used hourly measured data of global SR, in Burgos, Spain and tested three different models to estimate the IIA and the intensity of SR incident on a south-facing inclined surface for different periods. Results revealed that the IIA ranged from 7° in June to 70° in December and January. In Toronto, Canada, [17] used isotropic and anisotropic models to calculate the IIA and orientation of Photovoltaic Thermal System. They found that the collector incline should be changed four times a year to receive more solar radiation. In addition, they found that the solar panel should be installed with orientation west or east of due south with a flatter tilt angle. [18] reviewed the role of tilt angles and particularly locating the optimum tilt angle using different methods. Generally, the IIA reported for locations exactly on the equator line ranges between − 2.5° and 2.5°, for 71°–90° N, it is 41°–45°.
In Egypt, the IIA and the azimuth angles for solar collectors were calculated in Assiut, Egypt. The results show that the yearly gain in total SR can achieve 6.85% as the IIA adjusted eight times in a year while achieving 29.81% when adjusting the incline angle 6 times and the azimuth angle 12 times in a year. [19-21]. [22] studied the IIA and orientation for flat-plate solar heaters at Giza, Egypt. They found that the solar heater worked with the most efficiency when adjusted to the sun’s rays each half an hour. PV module's performance depends on the azimuth angle and the tilt angle as found in Cairo by [23]. They found that the yearly performance of PV is maximum when incline angles between 20° and 30° and azimuth angle equals 0o. In Helwan, Egypt, [24] compared statistically three anisotropic models called Tamps–Coulson, Perez, and Bugler to recommend the most accurate one for estimating the SR arriving on an inclined surface. Then, they used that model to determine the IIA. Results indicated that Perez’s model shows the best performance.
In Qena, some studies have been done related to solar radiation components on a horizontal surface; see for example [25-28]. No study has been done in Qena for estimating the total SR on an inclined surface and determining the IIA for maximizing the output of the PV and the solar heaters.
In this study, the total SR and IIA of a south-facing flat surface in Qena (26.20° N; 32.75° E; 97m asl), Egypt will be determined for different time scales: daily, monthly, seasonal and annual. Also, maximum total SR received on a surface with incline angle adjusted at horizontal, and at monthly, seasonal and annual IIA will be estimated. Besides, the percentage gain in annual average total SR for surfaces adjusted at monthly, seasonal and annual IIA will be predicted. The percentage losses resulting in using surfaces adjusted at seasonal and annual IIA will be estimated in comparison with that fixed at the monthly IIA. The national weather authority measured the used hourly global and diffuse SR data for five years (2012–2016) in the campus of the South Valley University in Qena.

2. Solar Radiation Data and Climate of the Region

Data are measured by the Egyptian national weather authority in the atmospheric laboratory located in the campus of the South Valley University in Qena (26.20 N°; 32.75 E°). Global SR data on a horizontal surface has been measured using the Precision Spectral Pyranometer (PSP) No. 16317IS, with a spectral range of 0.285 to 2.8 µm.
The diffuse component of the SR is measured by shading the direct beam from the pyranometer measuring global radiation. The Shadow Band Stand, model SBS is used to shade the pyranometer. The Combilog Datalogger (No.1020, TH. Friedrichs & CO “Germany”) recorded the values of hourly global and diffuse solar radiation data. These instruments are calibrated each year. The absolute accuracy of calibration is ±3–4%.
The beam radiation is estimated by subtracting the diffuse component from the global SR. The hourly average data of global, diffuse and beam components (MJ/m2) over five years (2012–2016) have been used in this study. From these data, daily averages and monthly average daily data have been calculated.
Egypt is located north-eastern Africa, so it consists mostly of a desert through which the Nile passes to divide it into the relatively small Eastern Desert and the relatively large Western Desert. The desert and the location in subtropical latitudes control Egypt's climate. It is mostly semi-continental, except for the northern coasts, where the climate is the Mediterranean Sea climate. The whole year is divided into two main seasons, hot one from May to September and the other is cool from November to March. [29]
Qena is a small city in Upper Egypt (26.20 N, 32.75 E, 97 m asl). It is characterized by a very hot and dry summer and relatively cold winter. The average daily maximum temperature reaches 40°C in summer and 25o in winter. The average daily minimum relative humidity is about 17% in summer and 26% in winter [30,31]. There is almost no rain in Qena. The winter average maximum mixing height, defined as the height of the layer adjacent to the ground over which pollutants or any constituents emitted within this layer or entrained into it become vertically dispersed by convection or mechanical turbulence (Seibert, P, et al., 2000), is 1418 m while the summer average maximum mixing height is 2481 m [32]. The area receives a large amount of SR, especially in the summer, where the monthly average daily global SR reaches about 27 MJ/ m2 in July as shown in table 1.

3. Methodology

The daily total SR on an inclined surface HT is a sum of three components: the daily beam SR, HT,b, diffuse SR, HT,d, and reflected SR, HT,r. Thus, according to Liu and Jordan, HT can be estimated as follows [33,34]
(1)
To calculate the ideal incline angle (βIIA), eq. (1) may be differentiated with respect to the incline angle β as,
(2)
In this study the βIIA is determined by searching for the incline angle corresponding to maximum total SR received by the surface. The three components HT,b , HT,d , and HT,r can be estimated as follows:
The daily beam SR on an inclined surface, HT,b, can be obtained from the daily beam SR, on a horizontal plane as
(3)
Where Hb is the beam SR incident on a horizontal plane, Rb is the beam SR conversion factor, which can be defined as the ratio of the average daily beam SR on an inclined plane to that on a horizontal plane [33,35,21].
According to [33], Rb can be estimated as:
(4)
where 
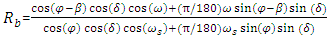
is the latitude of the location, is the sunrise hour angle for the tilted surface which can be estimated as [35]
(5)
The solar declination 
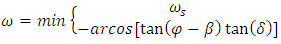
can be calculated as follows, [36]
(6)
where n is the day number in the year, January 1 = 1. The reflected component of radiation falling on an inclined surface can be calculated from the relation:
(7)
where 
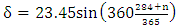
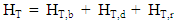
is the global SR falling on a horizontal plane. 
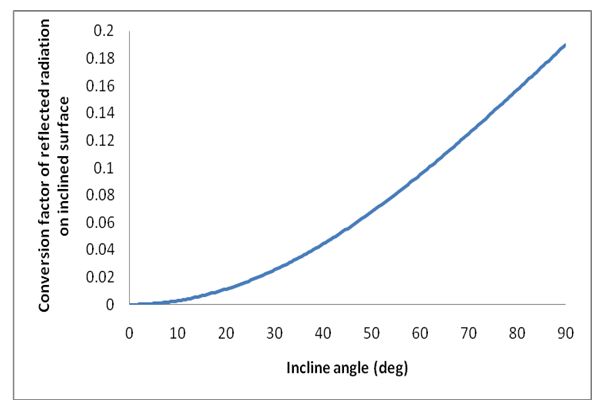
is the conversion factor of reflected radiation, calculated as
(8)
where 
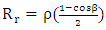
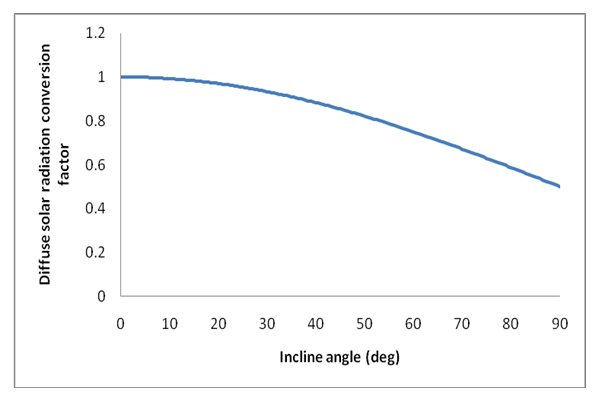
is the ground reflectivity, calculated from measured daily values of ground albedo in the site during January–Decemeber 2003 (data is not shown).
Many models, isotropic and anisotropic, can be used for estimating the diffuse component on an inclined surface; for isotropic models see [37-39,33]. Also, for anisotropic models see [40-44]. In this work, the diffuse component of radiation falling on an inclined surface is calculated using Liu and Jordan’s model [33] as
(9)
where Hd is the diffuse component of the SR falling on a horizontal surface. Rd is the conversion factor of the diffuse SR, known as the ratio of diffuse SR incident on an inclined plane to that on a horizontal plane. Rd can be estimated as [21]
(10)

4. Results and Discussion

Monthly average daily SR components measured in Qena during the period from 2012 to 2016 are shown in Table 1. It is seen from that table that the maximum SR occurs in summer and spring seasons, while the minimum SR occurs in winter seasons. Maximum global SR ranged from 21 MJ/m2-day in June and July 2005 to 27 MJ/m2-day in July 2012, while the minimum value occurred in winter and ranged from 12 MJ/m2-day to 13 MJ/m2-day in December for the entire period and in January in 2014. The maximum direct SR ranged from 15 MJ/m2-day in July 2015 to 21 MJ/m2-day in July 2012, while the minimum value varied from 4 MJ/m2-day in March 2012 to 8 MJ/m2-day in December and January 2015 and December 2014. The maximum diffuse SR varied from 7 MJ/m2-day in May and March 2016 to 18 MJ/m2-day in March 2012. The minimum values of diffuse SR varied from 3 MJ/ m2-day in January 2016 to 4 MJ/m2-day in March 2012.
Table 1. Monthly average daily global (Hg), direct (HD) and diffuse (Hd) solar radiation MJ/m2-day for a horizontal surface during the period 2012–2016 in Qena
     
In this work, the βIIA is estimated by searching the angle at which maximum solar energy occurs on the inclined surface. So that, calculations of the diffuse SR and the reflected SR as well as the beam SR conversion factors are made each 0.5° through the incline angle rang from 0° to 90°. Conversion factors of diffuse SR and reflected SR are shown in Fig 1 and Fig 2, respectively. It is clear that the value of the diffuse radiation conversion factor varies from 1 to 0.5 at incline angles of zero and 90°, respectively, while the reflected SR conversion factor varies from 0 to 0.19 at 0° and 90°, respectively. Comparing these results with that obtained in other sites in similar latitudes, the maximum value of the reflected SR conversion factor is almost twice that obtained in Aligarh/India (27.89°N, 78,08°E), where its value varied from 0 to 0.19 in Qena/ Egypt and from 0 to 0.1 in Aligarh/India. This result may be attributed to the difference in the value used for the albedo in the two sites. The used albedo values were 0.38 in Qena and 0.2 in Aligarh/India [45].
Figure 1. Conversion factor of diffuse solar radiation at different incline angles in Qena
Figure 2. Conversion factor of reflected solar radiation at different incline angles in Qena
Figure 3 depicts the relationship between the beam conversion factor and the surface incline angles that ranged from 0° to 90° with increments of 0.5° in Qena. 180 curves can be illustrated in the figure, but for clarity and simplicity, only 10 curves at increments of 10 degrees of incline angles are shown. At an incline angle 0°, the beam conversion factor is equal to unity for all days of the year because the surface is horizontal. As the incline angle gradually increases from 0° to 90°, the beam conversion factor becomes greater than the unity for the days of winter and autumn, while, its value becomes less than the unity for the days of spring and summer. This may be attributed to the relatively small values of the sun elevation angles in winter and relatively large values of the sun elevation angles in summer.
Figure 3. Conversion factor of beam solar radiation at different incline angles ranging from 0° to 90° in Qena
Substituting from the equations (3), (7) and (9) in the equation (1), the monthly average total SR is calculated for a south-facing flat surface at each 0.5° of incline angles as varying from 0° to 90°. The results are shown in Fig.4a for the first half of the year, January to June, and in Fig.4b for the second half of the year, July - December. From Fig.4a, b it is obvious that the total SR is a rigorous function of the incline angle. For most months, the calculated SR increases as the incline angle increases to a certain value, after which it decreases. The results revealed that the βIIA varies with the months of the year, as shown in Fig. 5 and table 2. The βIIA decreases from January to May, remains at zero from Jun to July, and then increases from August to December.
Figure 4. Monthly average daily total solar radiation versus incline angle for a south-facing surface in Qena, (a) for the months from Jan. to Jun. and (b) for the rest months of the year
Figure 5. Monthly variation of ideal incline angle for a south-facing flat surface in Qena
Figure 6 shows the daily βIIA for a south-facing flat surface in Qena. These βIIA were found by searching for the values for which the total SR on the inclined plane is at maximum for a particular day. Results indicate that the daily βIIA varies from 59.5° in January 4 to 0.5° in May 4. βIIA were negative for the period from May 5 to August 10. However, a zero value is suggested for such days, since a negative tilt to the north has no significance. There are other studies with the same results such as [45]. From August 11to Dec. 31, the βIIA varied from 0.18° to 58.7°.
Figure 6. Daily values of the ideal incline angle for a south-facing surface in Qena
Table 2 shows the βIIA for each month, season and the total year calculated for Qena. Seasonal βIIA are calculated by averaging the corresponding monthly βIIA. It is clear that the summer is characterized by the least seasonal βIIA being 0.1°, while winter has the most βIIA of 56.3°. Spring and autumn βIIA are 29.7° and 22.3°, respectively. The annual value of the βIIA is 27.1°, which is relatively close to the latitude of Qena, 26.20°. So that, south-facing flat surfaces can be fixed seasonally at seasonal βIIA and annually at an annual βIIA.
Table 2. Ideal incline angles for each month, season and the whole year of a south-facing surface in Qena
     
For assessing the validity of the determined IIA in Qena, the resulted yearly IIA, 27.1, is compared with the calculated values using linear equations stated by [46,47] and by polynomial equation stated by [48]. The calculated values were 22.2°, 25.3° and 24.4°, respectively. It is clear that the value estimated by our study is better than that estimated by [46] and [48]. Estimated value by this study increases only by 0.9° than the value of the latitude 26.20°. This deviation is convenient with that stated by the linear model used by [47], where it gives less value by 0.9°.
The monthly average daily measured values of SR at a horizontal surface and the calculated total SR at βIIA for each month, season, and the whole year are shown in Table 3. It is obvious that the monthly values are at maximum during the period from April to August, with the maximum occurs in June (20.90 MJ/m2-day). At the seasonal βIIA, the calculated total SR was found to be at maximum in summer, with the value reaching 20.90 MJ/m2-day) in June, the minimum value was in spring, with a value of 16.62 MJ/m2-day. Values of the total SR incident at an annual ideal incline angle ranged from 16.50 MJ/m2-day in February to 19.76 MJ/m2-day in April.
The percentage gain in the SR incident on an inclined surface can be calculated as:
(11)
where i refers to month, season and annual.
As stated in Table 3, for the surfaces adjusted at monthly, seasonal and annual βIIA, the percentage gains in annual average total SR were 13.64%, 12.78%, and 6.57%, respectively. These values are close to the percentage gain found in Aligarh, India [45].
Table 3. Maximum monthly average daily total solar radiation MJ/m2-day incident on a surface with incline angles adjusted to that of horizon, each month, each season, and the whole year in Qena
     
The estimated annual average total SR on a horizontal surface and inclined surface at βIIA of each month, season and annual inclined angles are shown in Figure 7. From this figure, we can see that the annual average total SR estimated at monthly βIIA is the most (19.24 MJ/m2-day), followed by the annual average total SR estimated at seasonal (19.09 MJ/m2-day), annual (18.04 MJ/m2-day) and horizontal (16.93 MJ/m2-day) βIIA.
Figure 7. Comparison of annual average total solar radiation for a surface fixed horizontally and a south-facing surface at monthly, seasonal and annual ideal incline angles
The loss in total SR incident on a south-facing flat surface fixed on seasonal βIIA and annual βIIA in comparison to the total SR incident on a surface fixed at a monthly βIIA can be calculated as
(11)
where j refers to season and annual.
The estimated percentage loss of total SR was found to be 0.78% and 6.24% for surfaces adjusted at seasonal and annual βIIA in comparison with a surface fixed at a monthly βIIA.
According to the calculated total SR incident on a south-facing flat surface fixed at βIIA for each month, season, and year, it is better to fix the surface at the monthly βIIA to gain the maximum solar energy, or on a seasonal βIIA, which experiences only a small percentage loss (0.78%). Using surfaces fixed at an annual βIIA causes a loss of total energy of 6.24%.

5. Conclusions

In this study, five years of hourly data of global and diffuse horizontal SR measured in Qena/Egypt were used for the calculation of the total solar radiation and the IIA of a south-facing flat surface.
According to the climate characteristics of Qena and its geographical position, the daily values of IIA vary from 0° to 59.5°. The monthly values vary from 0° to 58.9°. Seasonally, summer season was characterized by the least IIA, 0.1°, while winter has the most IIA, 56.3°. Spring and autumn IIAs are 29.7° and 22.3°, respectively. The annual value of the IIA is 27.1°, it is relatively close to the latitude of Qena, 26.20°N.
This study suggests fixing the surface on the monthly IIAs in Qena to gain the maximum solar energy, or at the seasonal IIAs, with an insignificant loss (0.78%). Using surfaces fixed at an annual IIA causes a loss of total energy of 6.24%.

References

[1]  Genwa, K.; C. and Sagar, 2013. Energy efficiency, solar energy conversion and storage inphotogalvanic cell. Energy Convers. Manag.66, 121–126.
[2]  Demirhan, H.; T. Mentes and M. Atilla, 2013. Statistical comparison of global solar radiation, estimation models over Turkey. Energy Convers. Manag.68, 141–148.
[3]  Mohammadi, K. and H. Khorasanizadeh, 2015. A review of solar radiation on vertically mounted solar surfaces and proper azimuth angles in six Iranian major cities. Renewable and Sustainable Energy Reviews, Volume 47, July 2015, pp 504-518. [Crossref]
[4]  Khahro, S.F.; K. Tabbassum; S. Talpur; M.B. Alvi; X. Liao and L. Dong, 2015. Evaluation of solar energy resources by establishing empirical models for diffuse solar radiation on tilted surface and analysis for optimum tilt angle for a prospective location in southern region of Sindh, Pakistan. Electr. Power Energy Syst.64, 1073–1080.
[5]  Mojtaba S. and E.J. Javaran, 2017. "Optimising the tilt angle for solar surfaces using different solar irradiation models in Yazd, Iran", International Journal of Ambient Energy, 2017 39(4):1-32 • [Crossref]
[6]  Benghanem, M., 2011. Optimization of tilt angle for solar panel: Case study for Madinah, Saudi Arabia. Appl. Energy, 88, 1427–1433.
[7]  Soulayman, S.; A. Mohammad and N. Salah, 2016. Solar Receivers Optimum Tilt Angle at Southern Hemisphere. Open Access Library Journal. https://www.scirp.org/pdf/OALibJ_2016071311424605.pdf.
[8]  Skeiker, K., 2009. Optimum tilt angle and orientation for solar collectors in Syria. Energy Convers. Manag. 50, 2439–2448.
[9]  Lave, M. and J. Kleissl, 2011. Optimum fixed orientations and benefits of tracking for capturing solar radiation in the continental United States. Renew. Energy36, 1145–1152.
[10]  Bakirci, K., 2012. General models for optimum tilt angles of solar panels: Turkey case study. Renew. Sustain. Energy Rev., 16, 6149–59.
[11]  Jafarkazemi, F. and S.A. Saadabadi, 2013. Optimum tilt angle and orientation of solar surfaces in Abu Dhabi, UAE. Renew. Energy, 56, 44–49.
[12]  Khorasanizadeh, H.; K. Mohammadi and A. Mostafaeipour, 2014. Establishing a diffuse solar radiation model for determining the optimum tilt angle of solar surfaces in Tabass, Iran. Energy Convers. Manag.78, 805–814.
[13]  Yan, R.; T.K. Saha,; P. Meredith and S. Goodwin, 2013. Analysis of yearlong performance ofdifferently tilted photovoltaic systems in Brisbane, Australia. Energy Convers. Manag. 74, 102–108.
[14]  Hiraoka, S.; T. Fujii; H. Takakura and Y. Hamakawa, 2003. Tilt angle dependence of output, power in an 80kWp hybrid PV system installed at Shiga in Japan. Sol. Energy Mater. Sol. Cells, 75, 781–786.
[15]  Ibrahim, D., 1995. Optimum tilt angle for solar collectors used in Cyprus. Renew. Energy. 6, 813–819.
[16]  De Miguel, A.; J. Bilbao and M. Diez, 1995. Solar radiation incident on tilted surfaces in Burgos, Spain: Isotropic models. Energy Convers. Manag.36, 945–951.
[17]  Getu Hailu, and Alan S. Fung, 2019. Optimum Tilt Angle and Orientation of Photovoltaic Thermal System for Application in Greater Toronto Area, Canada. Sustainability 2019, 11, 6443.
[18]  Yunus Khan, T.M., Soudagar, M.E.M., Kanchan, M. et al. Optimum location and influence of tilt angle on performance of solar PV panels. J Therm Anal Calorim (2019). https://doi.org/10.1007/s10973-019-09089-5.
[19]  Morcos, V.H., 1994. Optimum tilt angle and orientation for solar collectors in Assiut, Egypt. Renew. Energy4, 291–298, doi:10.1016/0960-1481(94)90032-9.
[20]  Soulayman, S. 2018. "chapter 5 Optimum Tilt Angle Determine", IGI Global, [Crossref]
[21]  Asad Ullah; H. Imran; Z. Maqsood; and N. Z. But, 2019. Investigation of optimal tilt angles and effects of soiling on PV energy production in Pakistan. Renewable Energy, Elsevier, vol. 139(C), pages 830-843., [Crossref]
[22]  Salah, M.; A.K. Abdellatief and E. Nasser, 2008. Optimum tilt angle and orientation for a flat plate solar water heater under Egyptian conditions. J. Agric. Mach. Sci.4, 253–258.
[23]  Hussein, H.; G. Ahmad and H. El-Ghetany, 2004. Performance evaluation of photovoltaic modules at different tilt angles and orientations. Energy Convers.Manag.45, 2441–2452.
[24]  Elminir, H.K.; A.E Ghitas; F. El-Hussainy; R. Hamid; M. Beheary and K.M. Abdel-Moneim, 2006. Optimum solar flat-plate collector slope: Case study for Helwan, Egypt. Energy Convers. Manag. 47, 624–637.
[25]  Mahmoud El-Nouby Adam, Khalafallah Omar Kassem, Emad Ali Ahmed, 2013. Statistical relationship between UVB (280-320 nm) and broadband solar radiation (295-2800 nm) at a subtropical location (Qena, Egypt), Atmospheric and Oceanic Science Letters, 2013, Vol 6, No. 4, 173 – 178.
[26]  S. M. El Shazly, Kh. O. Kassem, A.A. Hassan, Eman F. EL-Nobi, 2012. An Empirical Model to Estimate UV index in Some Upper Egypt Regions, Resources and Environment 2012, 2(5): 216-227, DOI: 10.5923/j.re.20120205.05.
[27]  A.A Hassan, S.M Elshazly, Kh O Kassem, and E. El-Nobi, 2011. A Study of Uultraviolet Irradiation at Qena, Upper Egypt. Al-Azhar Bull. Sci. Vol. 22, No. 1(June): pp. 91-113.
[28]  S.M. El Shazly, A. A. Hassan, Kh. O. Kassem, M. E. Adam and Z.M. Ahmed. Estimating global and diffuse solar radiation from sunshine duration at Qena/ Egypt. Canadian Journal on Computing in Mathematics, Natural Sciences, Engineering and Medicine Vol. 2 No. 9, December 2011.
[29]  Martyn, D., 1992. Climates of the World; Elsevier: Amsterdam, The Netherland; London, UK; New York, NY, USA; Tokyo, Jinan; Pwn-Polish Scientific Publishers: Warszawa, Polandpp 199–225.
[30]  Kassem, Kh.O., 2014. Long Range Transport Contribution to PM10 Concentrations in a Subtropical City (Qena/Egypt). World Environ.4, 1–13,doi:10.5923/j.env.20140401.01.
[31]  Kassem, Kh.O., S.M. El-Shazzly, M. Takahashi and M.E.-N, Adam, 2009. Variability of surface ozone in some regions in Egypt. Ph. D. Thesis, pp 113-114.
[32]  El-Shazly, S.M.; Kh.O.Kassem; A.A. Hassan and E.A. Hala, 2012. Assessment of mixing height at Qena/Upper Egypt based on radiosonde data. Resour. Environ.2, 275–280.
[33]  Liu, B. and R. Jordan, 1961. Daily insulation on surfaces tilted towards equator. ASHRAE10, 53–59.
[34]  Amit K. Y. and S.S. Chandel, 2013. Tilt angle optimization to maximize incident solar radiation: A review. Renewable and Sustainable Energy Reviews, 23:503–513 [Crossref]
[35]  Duffie, J. and W. Beckman, 1991. Solar Engineering of Thermal Process; JohnWiley & Sons: New York, NY, USA.
[36]  Cooper, P.I., 1969. The absorption of radiation in solar stills. Sol. Energy, 12, 33–346,doi:10.1016/0038-092X(69)90047-4.
[37]  Badescu, V., 2002. 3D isotropic approximation for solar diffuse irradiance on tilted surfaces. Renew. Energy, 26, 221–233.
[38]  Tian, Y.Q.; R.J. Davies-Colley; P. Gong and B.W. Thorrold, 2001. Estimating solar radiation on slopes of arbitrary aspect. Agric. For. Meteorol. 109, 67–74.
[39]  Koronakis, P.S., 1986. On the choice of the angle of tilt for south facing solar collectors in the Athens basin area. Sol. Energy 36, 217–225.
[40]  Reindl, D.T., 1990. Evaluation of hourly tilted surface radiation models. Sol. Energy 45, 9–17.
[41]  Hay, J. and J. Davies, 1980. Calculation of monthly mean solar radiation for horizontal and inclined surfaces. Sol. Energy. 23, 301–307.
[42]  Klucher, T.M., 1979. Evaluation of models to predict insolation on tilted surfaces. Sol. Energy, 23, 111–114.
[43]  Bugler, J.W. 1977. The determination of hourly insolation on an inclined plane using a diffuse irradiance model based on hourly measured global horizontal insolation. Sol. Energy, 19, 477–491.
[44]  Temps, R.C. and K.L. Coulson, 1977. Solar radiation incident upon slopes of different orientations. Sol. Energy19, 179–184.
[45]  Jamil, B.; T. Abid and S. Naiem Akhtar, 2016. Estimation of solar radiation and optimum tilt angles for south-facing surfaces in Humid Subtropical Climatic Region of India. Eng. Sci. Technol. Int. J.19, 1826–1835.
[46]  Chang, T.P., 2009. The Sun’s apparent position and the optimal tilt angle of a solar collector in the northern hemisphere. Sol. Energy 83, 1274–1284.
[47]  Talebizadeh, P., Mehrabian, M.A., Abdolzadeh, M., 2011. Determination of optimum slope angles of solar collectors based on new correlations. Energy Sources Part A 33, 1567–1580.
[48]  Mark Z. Jacobson*, Vijaysinh Jadhav, 2018. World estimates of PV optimal tilt angles and ratios of sunlight incident upon tilted and tracked PV panels relative to horizontal panels. Solar Energy, 169, 55-66.