-
Paper Information
- Paper Submission
-
Journal Information
- About This Journal
- Editorial Board
- Current Issue
- Archive
- Author Guidelines
- Contact Us
Resources and Environment
p-ISSN: 2163-2618 e-ISSN: 2163-2634
2019; 9(5): 99-109
doi:10.5923/j.re.20190905.01

Association between Anthropogenic Sources of Outdoor Air Pollution and Lichen Diversity, in Nakuru Town, Kenya
 Abstract
 Reference
 Full-Text PDF
 Full-text HTML
Harriet W. Kimani 1, Wilkister N. Moturi 1, Samuel T. Kariuki 2
1Department of Environmental Science, Egerton University, Kenya
2Department of Biological Science, Egerton University, Kenya
Correspondence to: Harriet W. Kimani , Department of Environmental Science, Egerton University, Kenya.
| Email: |  |
Copyright © 2019 The Author(s). Published by Scientific & Academic Publishing.
This work is licensed under the Creative Commons Attribution International License (CC BY).
http://creativecommons.org/licenses/by/4.0/

The purpose of this study was to assess urban lichen diversity in relation to anthropogenic sources of outdoor air pollution, in Nakuru town, Kenya. An ecological survey was conducted in six sampled sites of the town and data of lichen diversity and anthropogenic sources of outdoor air pollution, analyzed. Multi-stage sampling technique was used. A total of 51 lichen species were identified while 6 anthropogenic sources of outdoor air pollution were observed. Results from Fisher’s exact test analysis showed, significant association between the 6 observed anthropogenic sources of outdoor air pollution and lichen diversity. It was concluded that, different anthropogenic sources of outdoor air pollution affect presence and absence of urban lichen species. Hence, more studies on lichens and outdoor air pollution should be conducted in Kenya, to conclusively determine whether lichens should be adopted as an alternative biological method to technological devices, for assessing air pollution.
Keywords: Outdoor Air Pollution, Anthropogenic Sources of Outdoor Air Pollution, Lichen Diversity
Cite this paper: Harriet W. Kimani , Wilkister N. Moturi , Samuel T. Kariuki , Association between Anthropogenic Sources of Outdoor Air Pollution and Lichen Diversity, in Nakuru Town, Kenya, Resources and Environment, Vol. 9 No. 5, 2019, pp. 99-109. doi: 10.5923/j.re.20190905.01.
Article Outline
1. Introduction
- Urban outdoor air pollution is the presence in the air of one or more substances at a concentration above their natural levels, in towns and cities. These substances, also referred to as air pollutants, are harmful to living organisms including humans or they damage the natural environment. Sources of urban outdoor air pollution are natural and anthropogenic. Natural sources include volcanic activity, wildfires, atmospheric events such as dust storms and biological decay. Anthropogenic sources include motor vehicles, industries, power plants, burning of wood fuels, burning of municipal waste, street cooking and cigarette smoking (Curtis et al., 2006). When these two sources of urban outdoor air pollution are compared, the anthropogenic occur more often with a more significant effect. Sinks of outdoor air pollutants include forests and oceans.Globally, 54% of the world’s population resides in urban areas. In Africa, 40% of the population resides in urban areas, with this figure expected to rise to 56% by 2050 (United Nations, 2014). In Kenya, 32.3% of the population resides in urban areas, with this percentage set to reach 54% by year 2030 (Government of Kenya, 2010). Increasing urbanization causes increase in urban centers, industrialization and motor vehicle usage, which in turn cause rise in urban outdoor air pollution (United Nations Environment Programme, 2006). Exposure to high outdoor air pollution levels negatively affects human health by causing respiratory and cardiovascular diseases (McGranahan, 2012). Nakuru town, an urban town in Kenya, was named the fastest growing urban center in Africa, in year 2010, at 13.3% growth annually (UN-HABITAT, 2011). Its population has increased from 47,151 in year 1969, to 326,125 in year 2009, due to urbanization. Economic activities in this town include, transportation small micro-enterprise businesses, industries, schools, farming and tourism. One of the inevitable effects of urban growth is increased outdoor air pollution (Bhatta, 2010). Exposure to high outdoor air pollution levels negatively affects human health by causing respiratory and cardiovascular diseases (Curtis et al., 2006). Globally, outdoor air pollution is estimated to cause 3.3 million premature deaths per year and in Africa; it is estimated to cause 176,000 deaths, per year (WHO, 2012).In North America and Europe, low urban outdoor air pollution levels have been attributed to increased ambient air pollution monitoring stations and enforcement of air quality regulations. In Africa, high urban outdoor air pollution levels have been attributed to; lack of capacity for ambient air quality monitoring, poor participation by stakeholders and unplanned awareness campaigns (Schwela, 2012). In Kenya, the major challenge of air quality monitoring is low air quality monitoring capacity; there are few technological air quality monitoring devices (Mwai, 2016). Hence, there is need for surveying alternative ways of air quality monitoring.Lichens are a widely accepted tool in developed countries, used to assess outdoor air pollution (Giordani, 2007). Recent studies conducted in United States of America (U.S.A.) and Europe on lichens, have mainly assessed different models of using lichens to assess air pollution. In Africa, studies carried out on lichens, have mainly concentrated on measuring their heavy metal content (Monna et al., 2012). In Kenya, though studies on lichen diversity have been conducted, there are no indications that lichens are being used for assessing air pollution. So far, only technological devices are used for outdoor air quality monitoring in this country.To address this knowledge gap, this study was conducted in Nakuru town, Kenya, to assess distribution of urban lichens, in relation to anthropogenic sources of outdoor air pollution, in the town. Six sites were sampled within the town, in order to clarify causes of lichen variation. Simultaneous data collection of anthropogenic sources of outdoor air pollution and lichen species was carried out and recorded. Identification of sampled lichen species was done. Lichen species identification was important, as it served as an indicator of sensitivity of different lichen species to some outdoor air pollutants.
2. Literature Review
2.1. Anthropogenic Sources of Outdoor Air Pollution
- Urbanization in cities and towns brings together economic and human resources, stirring human activities such as business centers, industries, expansion of residential areas and transportation. Though these activities are essential for economic growth, some of them are sources of urban outdoor air pollution and have adverse effects on the environment and human health. These anthropogenic sources of outdoor air pollution include:
2.1.1. Motor Vehicles
- Motor vehicles have been documented as significant sources of outdoor air pollution in urban towns (Krzyzanowski et al., 2005). Research done in U.S.A. on global anthropogenic outdoor air emissions indicated that, motor vehicles constituted the most important source of nitrogen dioxide; 41% in 2000, followed by power plants, 21%, then industries, 16%. Other outdoor air pollutants emitted by motor vehicles include; particulate matter, sulfur oxides, carbon monoxide, volatile organic compounds (VOCs) and ground level ozone (Tatum and Shapiro, 2005). In developing countries where economic growth has resulted to increased vehicle ownership and traffic congestion, motor vehicles continue to be an important source of harmful emissions. In Kenya, with urban growth continuing to rise at a rate of 4.2%, motor vehicles on roads continue to increase (Kinney et al., 2005).
2.1.2. Fuel Wood Burning
- Globally, fuel wood burning contributes 10 – 12% of overall energy in the world, with low percentage in developed countries and over 50% in developing countries. In Africa, fuel wood burning occurs in settlements as many people continue to rely on traditional fuels for cooking and heating. Availability of charcoal which can be economically transported and wood which can be gathered from nearby sources make fuel wood burning a choice for many people in Africa (Yamamoto et al., 2009). In Kenya, wood fuel and charcoal are the main biomass sources of Kenya. Households have been reported to be the major consumers of fuel wood with an estimated consumption of 65 tonnes per household per year. In addition, a study conducted in Kenya on fuel consumption showed that 95% of about 200,000 institutions use fuel wood as the main source for cooking and heating (Irungu, 2016). Outdoor air pollutants emitted by fuel wood burning include, nitrogen oxides, sulfur oxides, particulate matter, VOCs, carbon dioxide, carbon monoxide, methane, peroxyacetyl nitrate (PAN) and ground level ozone (Lishtvan, 2009).
2.1.3. Industries
- Industries are among the major contributors of outdoor air pollution. Combustion of fossil fuels during industrial processes has been shown to produce industrial emissions based on whether the combustion is complete or incomplete. Complete combustion processes result to emissions of only carbon dioxide and water. However, incomplete combustion processes cause industrial emissions which constitute of particulate matter, carbon monoxide, nitrogen oxides, sulfur oxides and VOCs. A study conducted in U.S.A. on anthropogenic sources of outdoor air pollution showed that, power plants and industries are major anthropogenic sources of sulfur oxides (Unger et al., 2010). In line with that, in Europe, it is estimated that industrial sites are responsible for approximately 90% of the emissions of sulfur oxides. Other industrial emissions include; particulate matter, nitrogen oxides, carbon monoxide, carbon dioxide, VOCs, PAN, ground level ozone, ammonia and methane (Chen et al., 2007).
2.1.4. Solid Waste Burning
- Solid waste burning is the combustion of unwanted combustible raw materials such as paper, wood, plastics, textiles and other debris in open air or open dumps where emissions are released directly into air without passing through a chimney. This waste management practice is a regular occurrence in developing countries while in developed countries, it is strictly regulated (Intergovernmental Panel on Climate Change, 2006). Regular solid waste burning in East Africa has been attributed to rapid urbanization which has caused drastic increase in municipal solid waste generation (Getahun et al., 2011). With limited access to waste facilities, some residents in this continent opt for solid waste burning. When these solid wastes are burnt, outdoor air emissions such as nitrogen oxides, sulfur oxides, carbon monoxide, carbon dioxide and methane are released into the atmosphere (Intergovernmental Panel on Climate Change, 2006).
2.1.5. Cigarette Smoking
- Cigarette smoking has also been recorded as another source of outdoor air pollution. Cigarette smoking causes outdoor air pollution through the side stream smoke emitted in the surrounding air from a smoldering tobacco product. The exhaled portion of the main stream also contributes to outdoor air pollution. In addition, studies have shown that the pH of side stream smoke ranges from 6.7-7.5 while that of main stream smoke ranges from 6.0-6.5. Studies have consistently showed that, outdoor air pollution is higher in smoking zones when smoking is taking place, than no-smoking zones (Klein et al., 2012). Cigarette smoke constitute of air pollutants which include; particulate matter, volatile organic compounds, nitrogen oxides, ammonia, carbon dioxide, carbon monoxide, ground level ozone and PAN (Fowles et al., 2000).
2.1.6. Incineration
- Incineration is the combustion of solid and liquid waste in controlled incineration facilities. Incineration is a widely used waste management option for reducing and destroying substances that pose a risk to human health and safety. Gaseous emissions from incinerators include oxides of carbon, sulfur and nitrogen and VOCs. Location of incinerators should be in an area which is not populated to minimize the number of people who are exposed. In Kenya, there is lack of policies as to how far incinerators should be constructed from residential houses and roads. As a result, some of the incinerators are poorly located in close proximity to urban population. Outdoor air pollutants associated with incinerators include; particulate matter, trace quantities of metals (such as lead, manganese, cadmium, chromium, and mercury), VOCs, sulfur oxides, nitrogen oxides and methane (Yan et al., 2012).
2.2. Lichen Diversity
- There are over 18,000 lichen species which have been identified worldwide (Australian National Botanic Gardens, 2012). Lichens have been widely used in U.S.A. and Europe as bio-indicators of air pollution, due to their differential sensitivity to certain gaseous pollutants (Nimis et al., 2002). The U.S.A. Forest Service has lichens among their database of forest health indicators, which are monitored annually, to assess forest lichen diversity, in response to air pollution (Will-Wolf, 2010). Similarly, in Italy, as part of Environmental Impact Studies for proposed projects and in order for these projects to be approved, surveys and controls that use biological indicators are required. This is because such indicators are valid instruments for evaluating air quality (Conti and Cecchetti, 2001). Many studies have been carried out worldwide using lichen diversity, in relation to outdoor air pollution (Geiser and Neitlich, 2007; Jovan, 2008). According to these studies, nitrophytes are lichens that tolerate high nitrogen levels and high pH situations while acidophytes are lichens which tolerate high sulfur levels, require an acidic substrate and are intolerant to nitrogen and ammonia (Jovan, 2008). Sensitive lichen species are those which decline in areas with high outdoor air pollution (Loppi and Pirintsos, 2013). In contrast, tolerant lichen species are able to withstand and remain in areas with high outdoor air pollution. They occur in both polluted and non-polluted areas (Geiser and Neitlich, 2007).
2.3. Association between Polluting Activities and Lichens
- The occurrence and absence of lichens and diverse species around different pollution sources, has been used for problems associated to air pollution (Jovan, 2008). In Italy, studies have been conducted to examine correlations between altered physiological parameters in lichens and high concentrations of air pollutants (Giordani, 2007). Results of these studies suggest the validity of biological monitoring to integrate the environmental network for assessment of atmospheric pollution (Giordani, 2007). In U.S.A., lichens are among a suite of forest health indicators that are monitored nationwide on a permanent sampling grid, for purposes of monitoring air quality (Will-Wolf, 2010). In Kenya, studies on lichens have been conducted (Meijer and Donohoe, 2006), but lichens have not yet been adopted for assessing air pollution.
3. Statement of the Problem
- Air quality in Nakuru town has been deteriorating as population growth, industrialization, trade and motor vehicle usage continue to increase (in the town). This is evidenced by increasing emissions from motor vehicles and industries which can easily be observed in the town. In addition, there have been complaints raised by residents and workers in industrial area of this town concerning industrial emissions. In order for Environmental Management and Coordination (Air Quality) Regulations, 2014, to be enforced in this town, there is need for deliberate air quality monitoring to be done. There are indications from Nakuru-National Environment Management Authority (NEMA) and County Environment offices - 2016, that air quality monitoring in the town is limited due to lack of air quality monitoring devices. One of the reasons is that in Kenya, only technological devices are used for air quality monitoring. However, these devices are limited and are more expensive compared to biological methods and as a result, people within this urban town continue to be exposed to unknown levels of outdoor air pollution. Lichens are inexpensive bio-indicators of air pollution that can be used to assess air pollution. This study makes a contribution to other studies conducted on lichens in Kenya, by assessing urban lichens in relation to anthropogenic sources of outdoor air pollution, in Nakuru town.
4. Methodology
4.1. Research Design
- This study used ecological survey research design. This design was chosen because this study involved observing and documenting anthropogenic sources of outdoor air pollution and identifying lichen species, at sampled sites of Nakuru town. Analysis of association between anthropogenic sources of outdoor air pollution and lichen diversity was then conducted. The study had six (6) sampled sites namely; Central Business District (CBD), Moi Flats area, Shabaab ward, Barut west ward, Industrial area and Menengai forest, in Nakuru town. These sites were selected based on land use zones of Nakuru town.
4.2. Sample Size Determination
- Sample size, for lichen substrates, was determined by using standard sample size formulas (1) and (2) by Cochran (1963). These formulas were chosen because; they consider variability of data sets, they allow studies to analyze data with a 95% confidence level and a level of precision of +/- 5% and they allow studies to adjust standard error of the initial sample size, by using known population sizes, for higher accuracy.Initial sample size was computed using formula (1) (Cochran, 1963):
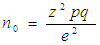 | (1) |
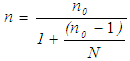 | (2) |
 = initial sample size
  = maximum variability (0.5)
 = +/-5% precision
  = constant for 95% confidence level = 1.96
 = sample size
 = known population size = 2,657 lichen substrates obtained from a complete count.Therefore, in this study, sample size statistics were substituted in formula (1). The corresponding initial sample size for this study was:
 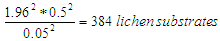 Thereafter, Finite Population Correction Factor was applied by substituting known population size
  in formula (2). Sample size
  after the substitution was:
 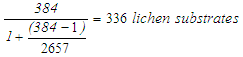 Therefore, sample size
  used for this study was = 336 lichen substrates. This sample size was distributed proportionately in each sampled site.Multi-Stage sampling was used as a sampling method. Firstly, stratified sampling was used where Nakuru town was divided into 6 strata. These strata were selected as sample sites. Thereafter, purposive sampling was used. In each stratum 4 sampling locations were selected based on; proximity to an ongoing point source(s) of outdoor air pollution and proximity to lichen substrates. Finally, systematic sampling was used; a line transect was placed on the ground from point source(s) of outdoor air pollution and was used as a guide to sample lichen species and to observe and record anthropogenic sources of outdoor air pollution, from point source of pollution along a 100 meter gradient. Lichen species collected at each sampling point were identified using taxonomy lists (Krog and Swinscow, 1988), while anthropogenic sources of outdoor air pollution observed at equivalent points were documented.
 4.3. Statistical Analysis
- Collected data was organized and coded. This was followed by data entry and analysis. Minitab software version 17 and SPSS (Statistical Package for Social Sciences) software version 20 were used for analysis of Descriptive Statistics, Chi-square Test for Association and Fisher’s exact test. Significant relations were tested at 95% Level of Confidence (α =0.05).
5. Results and Discussion
5.1. Anthropogenic Sources of Outdoor Air Pollution in Nakuru Town
- From the ecological survey which was conducted, a total of six (6) anthropogenic sources of outdoor air pollution were observed and recorded. Forests, which are sinks of outdoor air pollution, were also observed and recorded. This was for purposes of comparing findings of lichen species where forest areas occurred and where other anthropogenic sources of outdoor air pollution occurred. Figure 1 shows, anthropogenic sources of outdoor air pollution in Nakuru town from the most rampant to the least.Results from Figure 1 show that, motor vehicles are the most rampant anthropogenic sources of outdoor air pollution, in Nakuru town. This is because of dense network of roads which were observed in urban centers with high frequency of occurrence of motor vehicles. In addition, motor vehicles were observed in all sampled sites. Increasing motor vehicles in Nakuru town can be attributed to the nature of the study area, which is an urban setting that relies on motor vehicles for transportation of goods, services and raw materials for business enterprises and industrial processing. Furthermore, most urban workers and children commuting to and from work and schools within the town, rely on motor vehicles.
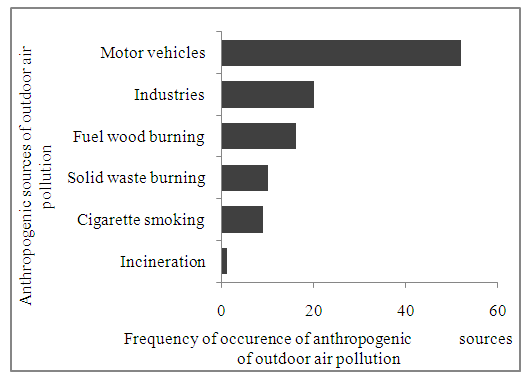 | Figure 1. Anthropogenic sources of outdoor air pollution in Nakuru town |
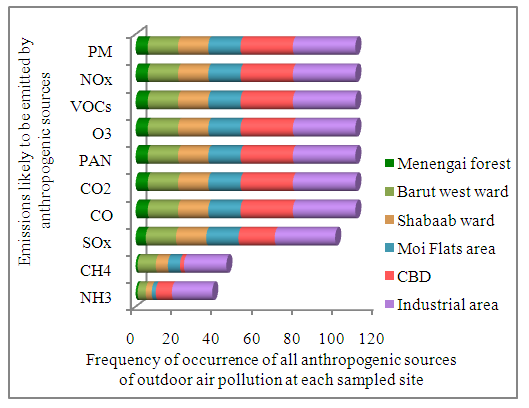 | Figure 2. Emissions likely to be emitted by anthropogenic sources of outdoor air pollution in Nakuru town |
5.2. Lichen Diversity in Sampled Sites of Nakuru Town
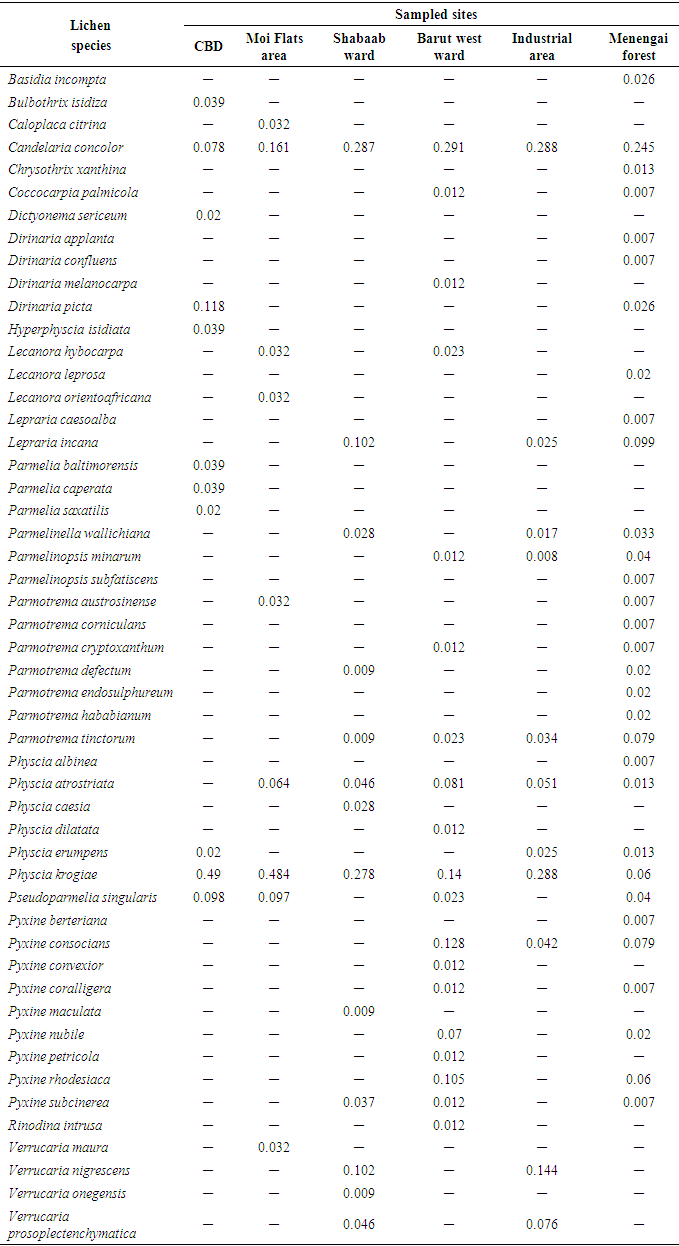
- This study identified a total of 51 lichen species in sampled sites of Nakuru town (Table 1). Values in Table 2 represent the relative proportion of each species in each sampled site. Lichen species identified were corticolous lichens which grow on barks of living plants as epiphytes.From the results illustrated by Table 1, Physcia krogiae and Candelaria concolor were the dominant lichen species appearing in all sampled sites of Nakuru town. This could be because, these species are tolerant to emissions produced by anthropogenic sources of outdoor air pollution in this town (Figure 1). A study conducted in Argentina also showed that, these species are the most frequent in urban environments, because they are tolerant to air pollution (Calvelo et al., 2009). In CBD, Physcia krogiae, Candelaria concolor and Pseudoparmelia singularis species were the most common lichen species (Table 1). Similarly, in Moi Flats area, Physcia krogiae, Candelaria concolor and Pseudoparmelia singularis species were prevalent. CBD and Moi Flats area were sampled sites which were characterized by high frequency of motor vehicles. These sites are also located in lowlands of the town (Kanani, 2012). According to a study conducted in South west Europe, Physcia and Candelaria lichen species are dominant in Mediterranean urban area while Pseudoparmelia lichen species have been observed in lowlands (Munzi et al., 2014).In Residential areas, notable lichen species were Candelaria concolor, Physcia krogiae, Lepraria incana and Verrucaria maura (Table 1). Candelaria concolor, Physcia krogiae and Verrucaria maura are tolerant lichen species, which are able to survive in areas with high air pollution and high temperatures (Davies, 1995; Geiser and Neitlich, 2007). Lepraria incana is also a lichen species which has the ability to survive in areas with both high and low air pollution (Nimis et al., 2002).In Agricultural areas, common lichen species identified were; Candelaria concolor, Physcia krogiae, and Pyxine berteriana. This could have been due to a mixture of anthropogenic sources of outdoor air pollution activities observed in these areas ranging from motor vehicles to fuel wood burning. Furthermore, small forests observed in agricultural areas allowed Pyxine species, which are sensitive lichen species (Saipunkaew et al., 2005), to thrive. In Industrial area, major lichen species identified were; Candelaria concolor, Physcia species and Verrucaria maura (Table 1), which are tolerant species. These findings can be attributed to emissions from industrial activities observed in this area. Similar findings were recorded in studies conducted in Poland and Britain which showed that, significant lichen species in industrial sites include; Candelaria, Physcia and Verrucaria maura species (Davies, 1995; Lisowska, 2011).In forested areas, dominant lichen species identified were Candelaria concolor, Parmotrema and Parmelia species (Table 1). Parmotrema and Parmelia species are sensitive lichen species associated with forested areas (Saipunkaew et al., 2005). Presence of Candelaria concolor species in forested areas could be due to minimal anthropogenic sources of outdoor air pollution, such as few motor vehicles, observed in these areas. Similar findings were recorded in a study conducted in Oregon and Washington, U.S.A, which revealed that, Candelaria, Parmotrema and Parmelia lichen species, are among common species found in forested areas (Geiser and Neitlich, 2007).
|
5.3. Association between Anthropogenic Sources of Outdoor Air Pollution and Lichen Diversity, in Nakuru Town
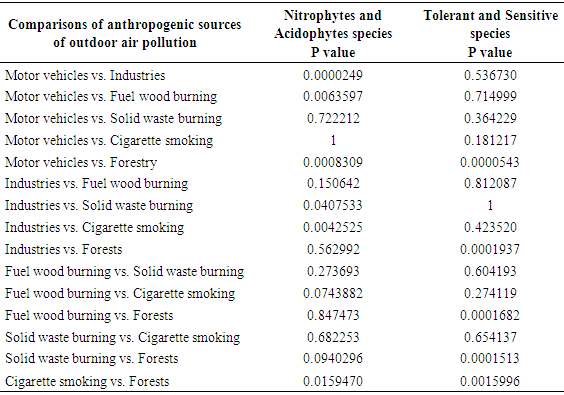
- Fisher’s exact test analysis was performed to assess the association between anthropogenic sources of outdoor air pollution and lichen diversity in sampled sites of Nakuru town (Table 2). With 15 pair wise comparisons (Table 2), Bonferroni correction for multiple tests was applied to correct for the multiple comparisons (McDonald, 2008). The critical p value for significance (0.05) was divided by the number of tests (15) and only individual tests with less than 0.05/15 or p<0.003 were considered to be significant (Table 2).Results revealed significant difference between motor vehicles and industrial activities in how they were affecting nitrophytes and acidophytes (Table 2). Nitrophytes are lichens which are able to tolerate high nitrogen levels and high pH situations (Jovan, 2008). They include lichen species belonging to Physciaceae lichen family which comprise of Physcia lichen species (Jovan, 2008). In this study, Physciaceae lichen family had the highest number of individual species in areas with the highest frequency of motor vehicles (Figure 3). Nitrogen oxides, mainly nitrogen dioxide (NO2) and nitric oxide (NO), are among the most important atmospheric pollutants emitted by motor vehicles (Colvile et al., 2000). A study carried out in Kavala city, Greece showed that, car exhausts contributed 63% of the nitrogen oxides in that city and consequently, among commonest lichen species found in that locality were Physcia species (Loppi and Pirintsos, 2013). A study carried out in Europe also showed that, areas of highest nitrogen oxides are located at roadsides and these areas are dominated by Physcia lichen species (Tregidgo et al., 2013). On the other hand, acidophytes are lichens which are able to tolerate high sulfur levels and low pH situations (Jovan, 2008). They include lichen species belonging to Verrucariaceae and Stereocaulaceae lichen families which comprise of Verrucaria and Lepraria lichen species respectively (Davies, 1995; Kukwa, 2006). Results of this study show that, Verrucariaceae lichen family had the highest number of individual species in areas with industries (Figure 3). Industrial processes are undoubtedly major sources of sulfur oxides (Tecer and Tagil, 2013). In line with that, a study carried out in Europe, indicated presence of Verrucaria lichen species in areas with industries (Davies, 1995). On the other hand, the number of lichen species belonging to Verrucariaceae lichen family was low in areas with motor vehicles, cigarette smoking and solid waste burning (Figure 3), which can be explained by dominance of nitrophytes in those areas (Giordani, 2007). Results of this study also indicated significant difference between motor vehicles and forests in how they were affecting presence of nitrophytes and acidophytes (Table 2). Nitrophytes were higher in areas with motor vehicles compared to forested areas while acidophytes (Stereocaulaceae lichen family) had higher number of individual species in forested areas compared to areas with motor vehicles (Figure 3). This could be due to presence of higher nitrogen oxides in areas with high frequency of motor vehicles compared to forested areas (Geiser and Neitlich, 2007). These results can also be credited to minimal anthropogenic sources of outdoor air pollution in forested areas allowing acidophytes to thrive. Similar findings were documented in a study conducted in England which recorded higher frequencies of nitrophytes in areas with high traffic density and lower frequencies of nitrophytes in areas with minimal transportation activities (Tregidgo et al., 2013). In accord with that, a study carried out in Europe recorded higher number of acidophyte lichen species in forested areas compared to nitrophyte lichen species (Svoboda et al., 2011).
|
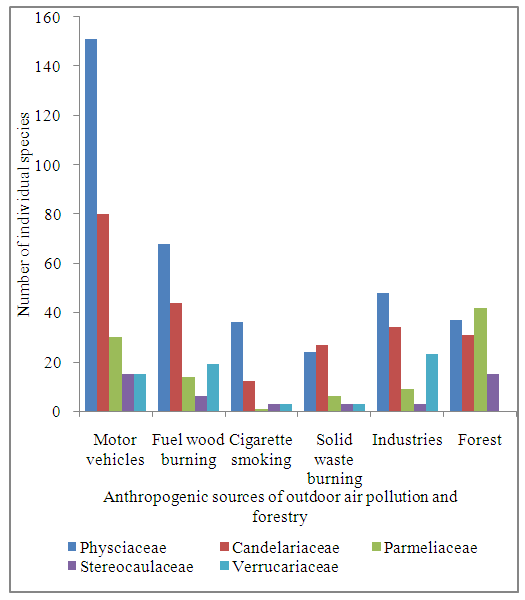 | Figure 3. Association between anthropogenic activities and lichen diversity in Nakuru town |
6. Conclusions and Recommendations
- This work identified six major anthropogenic sources of outdoor air pollution in Nakuru town. In descending order from the most rampant to the least they are; motor vehicles, industries, fuel wood burning, solid waste burning, cigarette smoking and incineration. Nitrophytes, such as Physcia lichen species, were most abundant in areas with high traffic density. On the other hand, acidophytes, such as Verrucaria and Lepraria lichen species, were most abundant in areas with industries and fuel wood burning activities. Tolerant lichen species such as Physcia krogiae and Candelaria concolor, were observed in all sampled sites, while sensitive lichen species such as Parmelia and Parmotrema were most abundant in forested areas. Based on the results of this study, it was concluded that, anthropogenic sources of outdoor air pollution have significant effect on urban lichen diversity, in Nakuru town, Kenya. Therefore, we recommend that, more research studies on lichens and outdoor air pollution should be done in Kenya. This is with an aim of conclusively determining, whether lichens should be adopted by public authorities as an alternative biological method to technological devices, for assessing outdoor air pollution, in Kenya.
ACKNOWLEDGEMENTS
- I would like to thank the Almighty God, for enabling me to complete this research study. I also thank Egerton University, Njoro, for allowing me to pursue my studies in Njoro campus. My appreciation goes to Department of Environmental Science, Egerton University for their constant support and availability. My sincere and humble thanks go to my supervisors Prof. Wilkister N. Moturi – Department of Environmental Science and Prof. Samuel T. Kariuki – Department of Biological Science for supervising my work. I also thank; my parents Mr. James Kimani and Mrs. Mary Kimani for their support, National Commission for Science, Technology and Innovation organization for issuance of research permit, County Government of Nakuru – Department of Environment for permission to carry out this study in Nakuru town and all my colleagues at Egerton University-Njoro campus for their constant encouragement.