Irfa’i
Environmental Health Department of Health Polytechnic Banjarmasin, Ministry of Health, Indonesia
Correspondence to: Irfa’i, Environmental Health Department of Health Polytechnic Banjarmasin, Ministry of Health, Indonesia.
| Email: |  |
Copyright © 2019 The Author(s). Published by Scientific & Academic Publishing.
This work is licensed under the Creative Commons Attribution International License (CC BY).
http://creativecommons.org/licenses/by/4.0/

Abstract
The main issue in the perspective expectation of tidal landfill is that it has great potential in polluting the environment. The volume of waste grows faster than the world population, and waste management is a very important issue for humans [1,2]. One of the pollutants caused by Landfiils is the formation of leachate. Leachate management can be done by land treatment treatment before leachate processed to LTP. Leachate management of leach without intervention obtained effluen leachate processed processing Leachate Processing discharged into the environment around TPA Basirih not meet the quality standards. Modeling of leachate management without intervention resulted that the COD concentration effluent of Leachate Processing Installation from 2016 onwards exceeded quality standard of waste. The result of simulation of model with intervention of land treatment treatment with HRT 75 hours resulted in effluent COD level that fulfill the quality standard requirement until 2017. For simulation of land treatment treatment with HRT 100 hours, 125 hours and 150 hours resulted in effluent COD level which fulfilled the standard quality requirement until final year of modeling (2025).
Keywords:
Model, Leachate Management, Land Treatment, Landfill
Cite this paper: Irfa’i, Leachate Management Model with Land Treatment Intervention in Tidal Area Landfill Case Study at Basirih Landfill, Banjarmasin, Indonesia, Resources and Environment, Vol. 9 No. 3, 2019, pp. 58-64. doi: 10.5923/j.re.20190903.02.
1. Introduction
The resulting leachate from the TPA is an important source of environmental pollution around the landfill. Increased waste of Banjarmasin city reaches 1,019 m3 per day and tends to increase from year to year will increase leachate production and more potential to pollute the environment. The presence of leachate from the landfill has a high risk of contaminating water and soil around the landfill [3]. Leachate contains dissolved organic matter, inorganic and metallic compounds [4]. The presence of leachate has been identified as one of the major threats to water and soil resources [5].The quantity of leachate in the landfill is determined by the rain intensity, the effective area of the landfill, the evaporation, the infiltration / porosity of the soil and the moisture content of the waste. The quality of the leachate composition is determined by the type of waste, the amount of waste, the amount of water that dissolves the waste pile and the operational system. The purpose of this research is to know leachate management model to the surrounding environment. Leachate management approach model is done by reducing the organic waste material at the collection stage. Leachate management model is required in the effort of leachate management, including collection, distribution, processing and disposal of leachate into the environment.Leachate production derived from liquids in the trash due to the decomposition process, as well as the rain water is involved in the waste and the waste decomposition that accumulates in the bottom of the landfill and seeps through the soil [6]. Contamination occurs because continuous leachate permeates into the environment from time to time without any environmental consequences [7]. The amount and characteristics of leachate that is formed is also influenced by the amount of organic waste material. Some authors report that more than 190 substances are identified in leachate, so nearly 1% of the material is calculated from the total organic carbon concentration [8]. Around landfills in tidal areas further increase the potential for leach contamination from the environment. The existence of landfill leachate should be managed and processed so as not to cause environmental pollution. To perform the processing required accurate data, contamination patterns, quantity and quality of landfill leachate in tidal land.Leachate management model in the landfill is influenced by the amount of garbage entering terurama organic waste, the area of leachate collection, leachate storage duration, leachate distribution and the ability of leachate processing Installation. Leachate processor is also influenced by leach quantity and quality, type and processing step used in leachate processing. The effluent of leachate treatment must be in accordance with the quality standard of liquid waste that is allowed to be disposed in the environment.The presence of leachate in the landfill area is influenced by the direction of groundwater flow, ground water velocity, soil porosity and the quality and quantity of pollutant leachate [9]. Surface water flows also have a role in landfill leachate distribution. Spreading through surface water flow is affected by inadequate landfills infrasctruture. Leachate protective leachate dikes result in leachate spread to. Leachate leach into the environment is not expected due to water runoff due to high rainfall intensity that can not be accommodated by Leachate treatment plant. This condition causes the leachate to spread to the environment. Tidal conditions also affect the pattern of pollutant spread.
2. Methods
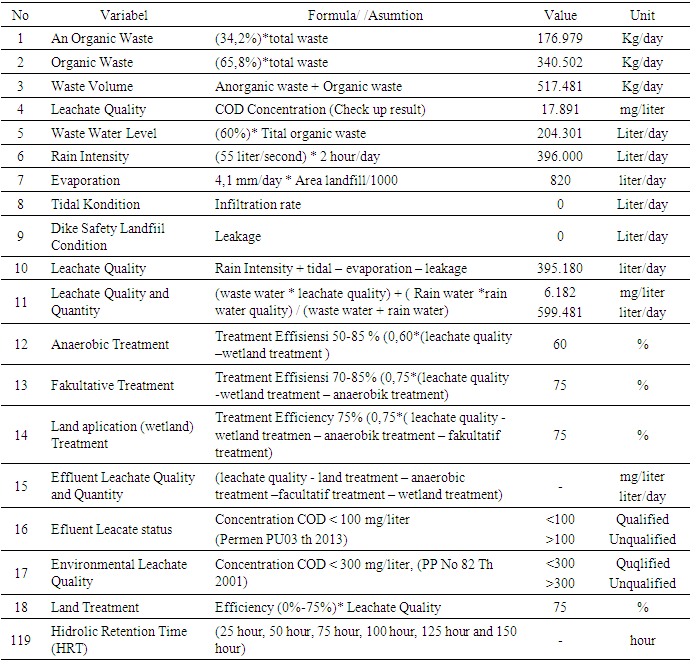
The method used in this research is survey method. This survey was conducted to examine the physical aspects of the landfill as a place for garbage and leachate collection, quantity and quality of waste, quantity and quality of leachate, and the ability of leachate processing installation in leachate processing. Assumption modeling assumption is done with the following data approach (Table 1):Table 1. Formula/asumtion in Managemen Leachate Model with Land Treatment Intervention
 |
| |
|
Primary data obtained are: Measurement of garbage volume, garbage composition, density and garbage density and the quality of landfill leachate is done by sampling and leach examination. Leachate quality measurement is preceded by newly formed leaching and examination of leachate, leachate located in the anaerobic processing unit, leachate located in facultative processing unit, and leachate located in land treatment treatment unit (effluent IPAL). The number of samples taken as many as 72 samples. Sampling of leachate quality is preceded by making wells for water sampling. Determination of sample point is done linearly from source (landfills) with distance 0 meter, 50 meter, 100 meter, 150 meter and 200 meter towards tide and towards low tide. While the sampling of river water is done at the upstream flow point and at the downstream point in the river around the landfill. Water leachate pollutants in this study were Biological Oxygen Demand (BOD5), Chemical Oxygen Demand (COD), Total Disolved Solid (TDS), Iron (Fe) and NH3N. While the leachate pollutant parameters analyzed in soil in this research are P2O5, SO4, Iron (Fe) and N-HN4 soluble. Observations on the distribution of leachate pollutants were conducted over a year. Primary and secondary data are analyzed and formulated to state the quality of leachate in the environment around the landfill.Modeling is done by using powersim software (power simulation). Powersim is one of the models used to create and simulate dynamic system models and business model simulations. Simulation is defined as a behavioral replication of a phenomenon of symptoms or processes in the system. The simulation aims to describe the symptoms or processes and to generate analysis and forecasting of the interaction symptoms of the behavior of that element or process in the future [10].Before simulating a model, it is necessary to connect one variable to another, thus forming a system that can simulate the actual condition/system [10]. Variable variables will be described with some symbols, the main one is the "flow symbol" which is always associated with "level symbol". The powersim program works on building flow charts, causal diagrams, creating time graphs and time tables, which illustrates the behavior of models created.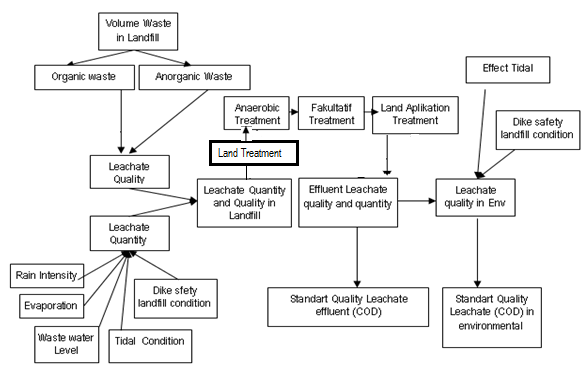 | Figure 1. The Circle Diagram of the Effect of the Leachate Management Model with Land Treatment Intervention |
In Figure 1, Trash consists of both organic and inorganic waste. The type and amount of waste will affect the quality and quantity of leachate. Increased waste generation will increase the amount of waste in the landfill. Increased waste in the landfill will increase pollutant levels in the landfill including increased COD in leachate. Increasing the concentration of pollutants in leachate will complicate in leachate treatment at the Leachate Treatment Plant (LTP) in the landfills. LTP processing capability has limit of processing and the amount of waste always increases so LTP is not able to process leachate optimally, so that the effluent of LTP does not meet waste effluent quality standard. By treating leachate on land treatment will reduce the concentration/pollutant (COD) in leachate, so that the LTP load becomes light and LTP ability in treating leachate has leachate effluent in accordance with the quality standard.
3. Results and Discussion
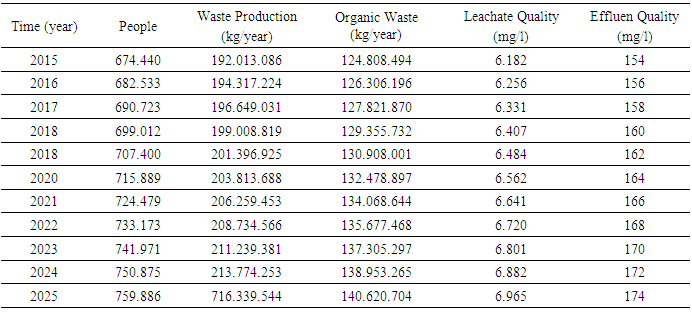
Leachate Management Model Without Intervention.Increasing waste generation in Banjarmasin City will increase the amount of waste in the TPA Basirih. Increased waste in the landfill will increase pollutant levels in the landfill including increased COD in leachate. Increasing the concentration of pollutants in leachate will complicate the leachate processing at the Leachate Treatment Plant (LTP) in the landfills. LPL processing capability has limit in processing, and also has limitation in processing waste amount. The amount of garbage is always increasing so the LTP is not able to process leachate optimally and the effluent LTP is not in accordance with the effluent quality standard. Inter action between the components in a system is a cause-effect diagram of an event or process. Between the components with each other interact and affect the performance of the system created [11]. Leachate management model without intervention is presented in Figure 1. Leachate management model without intervention meant no leach treating treatment in the processing other than those being treated using existing LTP. Leachate management runs naturally without any outside intervention except LTP processing with the sequence of Anaerobic-Facultative-Wetland processes on the currently operated LTP.Based on the simulation of leachate management model without intervention at initial condition (year 2015) that is population growth 1,2% per year in population amounted to 674,440 people. The number of waste generation at Basirih landfill is 517.481 kg per day. The composition of organic waste amounted to 340.502 kg / day (65.8%). Based on laboratory results obtained COD levels in leachate of 17.891 mg / liter. In leachate treatment model without intervention, leachate mixed with rain water, COD concentration in leachate is 6,182 mg / liter. Further leachate is carried out by way of treating leachate in LTP. The effluent issued by LTP TPA Basirih exceeds the specified quality standard, ie COD <100 mg per liter [12]. Assessment was also performed on leachate quality in the environment around the landfill with a quality standard for COD of <300 mg per gram [13]. The following is the result of leach modeling simulation without intervention.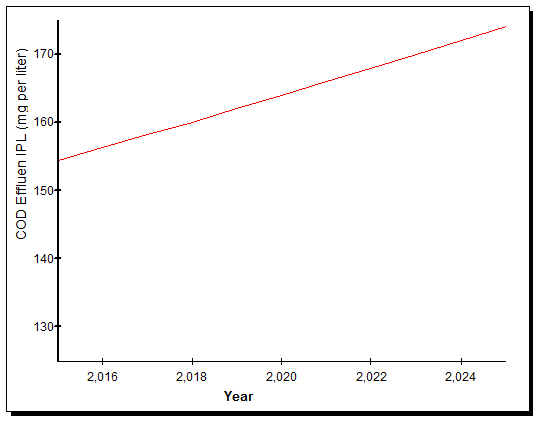 | Figure 2. Graph of COD Content in the Leprosy Management Model Without Intervention |
Based on simulation result, leachate management model without intervention (figure 2), effluent leachate result of LTP processing discharged to environment around TPA Basirih in condition not fulfill standard requirement (standart100 mg/l). In the graph above, the concentration of COD in 2015 amounted to 154.57 mg/liter. Based on the quality standard of water quality in the environment, COD concentration still meets the environmental quality standard requirement (standart 300 mg/l). The projected COD concentration of effluent LTP in the next year is increasing along with the increase of population and waste generation at TPA Basirih. To see the simulation results can be seen in Table 2 as follows:Table 2. COD levels in the Leachate Management Model Without Intervention
 |
| |
|
Based on table 2 above, the projection of leachate management model without intervention is obtained as follows: COD concentration of effluent LTP from 2015 until 2025 exceeds quality standard of waste. In the table is indicated by the results> 100 mg/l in the Effluent Quality column, but for the environmental quality standard environment still meets the environmental quality standard marked with <300 mg/lLeachate management model without intervention in TPA can be explained in the mathematical equation as follows: | (1) |
 | (2) |
 | (3) |
 | (4) |
 | (5) |
Note:KKL (t + dt) : Health Change Environment unity of time (COD mg/liter).KKL (t) : Environmental Health Change at t (COD mg/liter).KCODTPA : COD concentration of mixed leachate in landfill (mg/liter)JAS : Amount of waste water leachate (liters).KCODS : COD content in waste leachate (mg/liter).JAP : The amount of mixing water (liter).KCODAP : COD content of mixing water (mg/liter).KAs : Waste water content (%).JSO : The amount of organic waste (kg).Ah : The rain water discharge (liter/sec).Aps : The amount of water entering TPA due to ups and downs (liter).P : Evaporation (mm / day). Area of TPA/1000 (liter/day).Kb : The amount of water due to leakage of embankments (liters).RCODLTP : Removal of COD LTP (mg/liter).KCODLC : COD content of leachate mixture. (mg/liter).EfAn : Efficiency of anaerobic treatment (%).EfFak : Efficiency of facultative processing (%).EfWL : Efficiency of wetland processing (%).The results of this simulation illustrates that the ability of LTP TPA Basirih still not able to treat leachate well. Leachate management has not been carried out continuously on aspects of the waste process from the beginning to the end of the process. Leachate conditions treated by LTP have high levels of COD and other contaminants. Not yet done the treatment of land treatment cause the effluent result of LTP not according to standard.Leachate Management Model with Land Treatment Intervention.Leachate treatment with the addition of land treatment unit, not necessarily can reduce the level of COD effluent at that time. Decrease in COD effluent may occur after addition of treatment land treatment at residence (HRT) in accordance with processing requirements. The formation of leachate with the content of pollutants is the accumulation of waste decomposition process from time to time in the landfill. Treatment with the addition of land treatments unit will help to reduce pollution load on leachate before processing at LTP. Recycling and recovery of materials and energy are encouraged to protect natural resources and avoid wasteful land use [8]. To improve leachate efficiency, it can add a land aplication processing unit at the end of processing [14].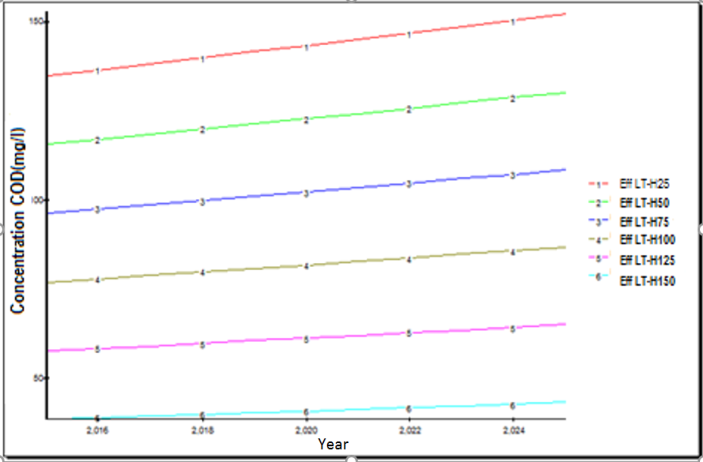 | Figure 3. Graph of COD Content in the Leachate Management Model with Intervention Land Treatment Processing |
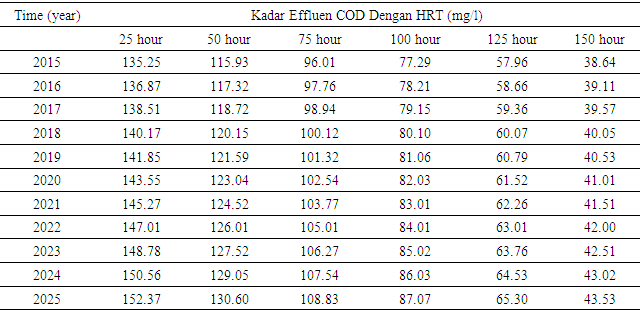
Based on simulation result, leachate management model with intervention (figure 3) was obtained effluent leachate result of LTP processing which discharged to environment around TPA Basirih in condition not fulfill standard requirement (standart100 mg/l) in land treatment with HRT 25 hours and HRT 50 hours. In the graph above, the addition of land treatment unit at HRT 75 hours produces the effluent LTP meet standard only until 2018. Projection on simulation with land treatment intervention on HRT 100 hours, 125 hours and 150 hours, effluent LTP COD concentration meet the standard until year 2024 and the following year. To see the simulation results can be seen in Table 3 as follows:Table 3. COD content in the Leachate Management Model with Intervention Land Treatment Processing
 |
| |
|
The simulation results of leachate modeling model with land treatment treatment intervention with variation of HRT can be explained as follows: Land Treatment Processing with 25 hr HRT resulted COD effluent level of LTP of 135.25 mg/l in 2015 to 152.37 mg/l in 2025 The HRT 50 hour simulation resulted in a COD effluent of LTP of 115.93 mg/l in 2015 to 130.6 mg/l in 2025. The 75 hour HRT simulation resulted in COD levels of effluent LTP of 96.61 mg/l by 2015 up to 108.83 mg/l by 2025. The 100 hour HRT simulation resulted in a COD effluent of 77.09 mg/l of COD from 2015 to 87.07 mg/l in 2025. The HRT 125 hour simulation resulted in COD effluent LTP amounting to 57.96 mg/l in 2015 to 65.30 mg/l in 2025. HRT 150 h simulation resulted in COD effluent of LTP of 38.64 mg/l in 2015 to 43.53 mg/l in 2025.Leachate management model with land treatment treatment intervention at TPA Basirih can be described in the mathematical equation as follows: | (6) |
 | (7) |
 | (8) |
 | (9) |
 | (10) |
Note:KKL (t + dt): Health Change Environment unity of time (COD mg/liter).KKL (t) : Environmental Health Change at t (COD mg/liter).KCODTPA : COD concentration of mixed leachate in landfills (mg/liter)JAS : Amount of waste water leachate (liters).KCODS : COD content in waste leachate (mg/liter).JAP : The amount of mixing water (liter).KCODAP : COD content of mixing water (mg/liter).KAs : Waste water content (%).JSO : The amount of organic waste (kg).Ah : The rain water discharge (liter/sec).Aps : The amount of water entering landfills due to ups and downs (liter).P : Evaporation (mm / day). Area of Landfills/1000 (liter/day).Kb : The amount of water due to leakage of embankments (liters).RCODLTP : Removal of COD LTP (mg/liter).KCODLC : COD content of leachate mixture. (mg/liter).EfAn : Efficiency of anaerobic treatment (%).EfFak : Efficiency of facultative processing (%).EfWL : Efficiency of wetland processing (%).EfLT : Efficiency of Land Treatment processing (%).In this simulation result, the intervention of land treatment treatment with HRT 75 hours resulted in effluent COD levels that meet the quality standard requirements until 2017. For simulation of land treatment treatment with HRT 100 hours, 125 hours and 150 hours resulted in effluent COD levels that met the standard quality requirements until the final year of modeling (2025). As for environmental quality, land treatment treatment intervention has result of COD Effluent LTP comply with environmental quality standard.
4. Conclusions and Suggestion
ConclusionModeling leachate management without the intervention of processed products obtained LTP leachate effluent released into the environment around the landfill Basirih not meet the requirements of the standard (standart100 mg/l). As seen in the graph above, the COD concentration in 2015 is 154.57 mg/liter. Based on simulation results of leachate management model with 10%, 20% and 30% organic waste reduction interventions (figure 3), effluent of leachate of processed LTP discharged to the environment around landfills did not meet the standard requirement (standart100 mg/l). The simulation results of leachate modeling model with 40% and 50% organic waste reduction interventions found that LTP leachate effluent discharged into the environment fulfill standard requirement (standard 100 mg/l) until 2025. Based on the water quality standard around the TPA Basirih, meet the requirements of environmental quality standard (standart 300 mg/l). SuggestionLandfill leachate treatment in landfill landfill with tidal location location needs to be done. This effort is done to reduce the load of pollutants that exist on leachate so that it can reduce the processing burden done LTP di landfills. For further research it is necessary to investigate the effectiveness of land treatment in various ways so that it can be found the formula of reduction of pollutants in leachate optimally.
THANK YOU NOTE
Our thanks go to Mr. Prof. Suyadi and Mr. DR Bagyo Yanuwiadi as Promoter and Co-Promoter. We also thank the Director of the Poltekkes of the Ministry of Health of Banjarmasin for funding support in the implementation of the task of study and to all the parties we can not mention one by one.
References
| [1] | Salem Z, Hamouri K, Djemaa R, Allia K., 2008. Evaluation of landfill leachate pollution and treatment. Desalination.; 220(1–3): 108–114. |
| [2] | Renou S, Givaudan JG, Poulain S, Dirassouyan F, Moulin P, 2008. Landfill leachate treatment: Review and opportunity. Journal of Hazardous Materials.; 150(3): 468–493. |
| [3] | Ikem A., O. Osibanjo, M.K.C. Sridhar, and A. Sobande, 2002., ‘Evaluation of Groundwater Quality Characteristics near Two waste Sites in Ibadan and Lagos, Nigeria’, Journal Water, Air, and Soil Poll, 2002, 140: 307–333. Kluwer Academic Publishers, the Netherlands. |
| [4] | Christensen, T.H., P. Kjeldsen, P.L. Bjerg, D.L. Jensen and J.B. Christensen et al., 2001. Biogeochemistry of landfill leachate plumes. Applied Geochem., 16: 659-718. |
| [5] | USEPA, 1984. A ground water protection strategy for the environmental protection agency. United States Environmental Protection Agency (USEPA), Office of Ground-Water Protection, Washington, DC., USA., August 1984. |
| [6] | Mor, S., K. Ravindra, R.P. Dahiya and A. Chandra, 2006. Leachate characterization and assessment of groundwater pollution near municipal solid waste landfill site. Environ. Monit. Assess., 118: 435-456. |
| [7] | Longe, E.O. and M.R. Balogun, 2010. Groundwater quality assessment near a municipal landfill, Lagos, Nigeria. Res. J. Applied Sci. Eng. Technol., 2: 39-44. |
| [8] | EEC., 1999. Council Directive on the landfill of waste. 99/31/EEC,. |
| [9] | Damanhuri, E. Sian. P Padmi. T, 2010 Waste Management: Handbook Lecture TL-3104, - Programs Environmental Engineering, Faculty of Civil and Environmental Engineering, Bandung Institute of Technology. |
| [10] | Muhammadi, E., Aminullah and B. Soesilo. 2001. Dynamic Systems Analysis: Environment, Social Economics, Management. UMP Press, Jakarta.Forrester, J. W. 2007b. System Dynamics - The Next Fifty Years. System Dynamics Review 23 (2-3): 359-370. |
| [11] | Regulation of the Minister of Public Works No. 03 of 2013 on Quality Standard of Liquid Waste of Landfill. |
| [12] | Government Regulation No. 82/2001 on Water Quality Management. |
| [13] | Tchobanoglous G, Theisen H, & Vigil S. 1993. Integrated Solid Waste Management, Engineering PrincWWTes and Management Issues. New York: McGraw-Hill, Inc. pp. 381-417. |
| [14] | Hermana. Joni, 2007. Alternative Potential of Leachate Processing Chemically. Workshop Inovase Waste Processing Technology Directorate of PLP Development, Directorate General of Human Settlements, State Minister of Public Works and Public Housing. |

 Abstract
 Reference
 Full-Text PDF
 Full-text HTML