Randrianiaina Jerry J. C. F., Rakotonirina Rija I., Ratiarimanana Jean R., Lahatra Razafindramisa Fils
Antananarivo University, Physics Department, Laboratory of Matter and Radiation Physics, Madagascar
Correspondence to: Randrianiaina Jerry J. C. F., Antananarivo University, Physics Department, Laboratory of Matter and Radiation Physics, Madagascar.
| Email: |  |
Copyright © 2018 The Author(s). Published by Scientific & Academic Publishing.
This work is licensed under the Creative Commons Attribution International License (CC BY).
http://creativecommons.org/licenses/by/4.0/

Abstract
This present study shows the performance of remote sensing coupled with Geographic Information System (GIS) to monitor surface water temperature in Lake Itasy. Lake Itasy is among of the continental lakes of Madagascar. Sited within the volcanic field of the Itasy. Its surface is about 35 km². We derived surface water temperature from Landsat 8 Thermal Infrared Sensor (TIRS) and Operational Land Imager (OLI) sensor data. The results obtained from the processed data reveal that the temperature on the surface lake varied between 19.0°C and 22.6°C on 06 May 2018 while it ranged from 18.1°C and 21.8°C on June 2018. It indicated that Lake Itasy water respects the Malagasy norm in point of view temperature.
Keywords:
Remote sensing, GIS, Surface water, Temperature, Itasy Lake
Cite this paper: Randrianiaina Jerry J. C. F., Rakotonirina Rija I., Ratiarimanana Jean R., Lahatra Razafindramisa Fils, Temperature Retrieval of Lake Itasy Using Remote Sensing, Resources and Environment, Vol. 8 No. 6, 2018, pp. 241-244. doi: 10.5923/j.re.20180806.01.
1. Introduction
The knowledge of water surface temperature is one of the key important parameters to follow the health of the lakes. It influences the available energy quality for the biologic productivity and the chemical processes in the lakes including the quantity of the oxygen dissolved that assures and protects the aquatic life. The excessive increase of the temperature entails a loss of biodiversity in all trophic rank. The variation of water temperature results from several factors such as the variation of the climate and the human activities. The objective of the study is to map the surface temperature distribution of Lake Itasy.Madagascar, like most developing countries, does not have the means and the budget allocated to make regular in-situ measurements necessary for the monitoring of the quality of surface water. Previous studies confirmed that remote sensing coupled with Geographic Information System (GIS) could offer integrated solutions to map quality of surface waters (Dewidar and Khedr, 2005; Hereher et al., 2010). There are more satellite data like Landsat8 that can be downloaded for free (https://earthexplorer.usgs.gov) and that were used in this work to determine the water temperature of the lake. The method we proposed here uses the Landsat 8 Operational Land Imager (OLI) Near Infrared band, red band and Thermal Infrared Sensor (TIRS) bands to estimate the temperature of Lake Itasy. Lake Itasy is a large continental lake of Madagascar.
2. Study Area and Data Used
2.1. Study Area
Lake Itasy is among of the continental lakes of Madagascar. Sited within the volcanic field of the Itasy, in region of Itasy and geographically located between 19° 04’ latitude South and 46° 47’ longitude East (Figure 1). It’s the third largest lake in Madagascar, whose surface is about 35 km².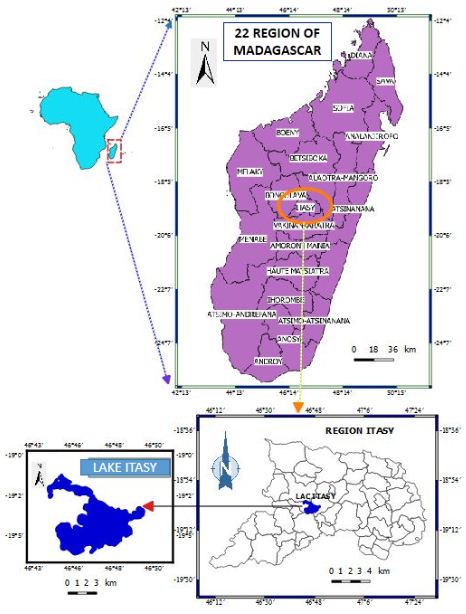 | Figure 1. Located of study area |
2.2. Data Used
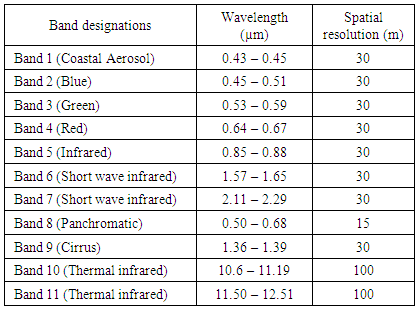
The Landsat 8 products are used in this work. Landsat8 was launched on 11 February 2013 ensuring the continuity of remote sensing data at high spatial resolution in the continuity of the mission of Landsat data.Landsat 8 carries two sensors: The Operational Land Imager (OLI) with 30 m multi-spectral resolutions and 15 m panchromatic, and the Thermal Infrared Sensors (TIRS) at a spatial resolution of 100 m using two bands between 10-12 µm. The characteristics of Landsat8 OLI/TIRS imagery were given in Table 1.Table 1. Landsat 8 characteristics (Landsat 8 Data Users Handbook, 2016)
 |
| |
|
3. Methodology
3.1. Top of Atmospheric (ToA) Radiance
Correcting the value of ToA reflectance in Thermal- infrared of Landsat-8 is necessary to reduce errors of the energy reflected from objects on the earth surfaces to the data collected from surrounding environment while recording data, including weather, topography, temperature and angle of incidence. ToA radiance is function of band-specific rescaling factor, digital number (DN) and band specific additive rescaling factor. It is given by Equation 1 (Barsi et al., 2003; Rajeshwari and Mani, 2014).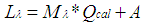 | (1) |
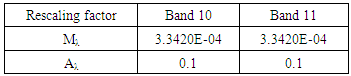
Where:Lλ: Top of atmospheric spectral radianceMλ: Band specific multiplicative rescaling factor (RADIANCE_MULT_BAND_X, where X is the band number 10 or 11)Qcal: Digital numberAλ: Band specific additive rescaling factor (RADIANCE_ADD_BAND_X, where X is the band number 10 or 11).Table 2. Rescaling factor
 |
| |
|
3.2. Top of Atmospheric (ToA) Reflectance
OLI band data can also be converted to ToA planetary reflectance using reflectance rescaling coefficients provided in the product metadata. The following equation is used to convert DN values to ToA reflectance for OLI data as follows by equation (http://landsat.usgs.gov/Landsat8 Using Product.php):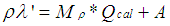 | (2) |
Where:ρλ’: ToA planetary reflectance, without correction for solar angleMρ: Band-specific multiplicative rescaling factorQcal: Digital numberAρ: Band-specific additive rescaling factorCorrecting ToA reflectance with sun angle value is given by equation (3): | (3) |
θ: sun elevation angle.
3.3. Brightness Temperature
Brightness temperature is the microwave radiation radiance traveling upward from the top of Earth’s atmosphere. The calibration process has been done for converting thermal DN values of thermal bands of TIRS to brightness temperature (Rajeshwari and Mani, 2014). ToA spectral radiance of (Lλ) was needed to calculate brightness temperature. Having converted DN to spectral radiance, the brightness temperature TB can be calculated by equation (4).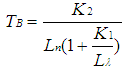 | (4) |
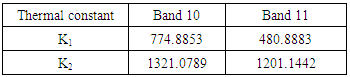
Where: Lλ: Top of atmospheric spectral radianceK1 and K2: Thermal conversion constant.Table 3. Thermal constant
 |
| |
|
3.4. Normalized Difference Vegetation Index (NDVI)
NDVI is the one vegetation index. Since the urban thermal environment is related to the reduction of evapotranspiration from the surface vegetation cover, it is useful to recognize the relationship between surface vegetation cover and water availability (Yue et al., 2007). The recent research has shown that NDVI is a good indicator of surface radiant temperature (Lo et al., 1997). The NDVI is calculated from these individual measurements as follows: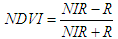 | (5) |
NIR and R are the Near-Infrared and Red band.
3.5. Emissivity (E)
Emissivity is the important parameter necessary for temperature surface retrieval utilizing thermal remote sensing data. The surface emissivity varies with land cover and viewing angles. Emissivity was calculated by equation (6) (Sorbino et al., 2008). | (6) |
Pv is the proportional vegetation or fraction of vegetation obtained using following equation (Carlson and Ripley, 1997): | (7) |
NDVImin, NDVImax are the minimum and maximum NDVI value.
3.6. Surface Temperature
The previous research was utilizing the single channel from TIRS data of the Landsat 8 OLI to estimate land surface temperature (water surface temperature). And this study water surface temperature was estimated by two TIRS channels data of Landsat8. Water surface temperature can be calculated by: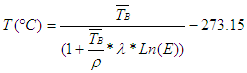 | (8) |
Where:  : Average brightness temperature, with TB,i and TB,j are the brightness temperature of band 10 and 11 respectively,λ: wavelength at 11.197 µm,
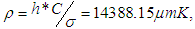 h: Planck’s constant (6.626*10-34 JK-1),σ: Boltzmann constant (1.38*10-23 JK-1),E : Emissivity,C: velocity of light (2.998*108 ms-1).
4. Result and Discussion
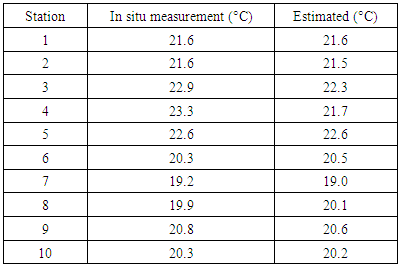
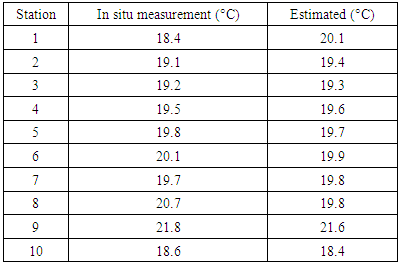
The spatial distribution of water surface temperature of Lake Itasy is shown in Figure 2 and 3, dated respectively on 06 May 2018 and 23 June 2018. For the Figure 2, water surface temperature ranged from 19.0°C and 22.6°C, higher surface water temperature is in the peripheral of the lake which as a low depth. The spatial distribution of water temperature in the Figure 3 ranged from 18.1°C and 21.8°C. The obtained values indicate that Lake Itasy water respects the Malagasy norm namely inferior to 30°C (Water surface classifications according to decree n°2003/464 in 15/04/03). The comparison of the in-situ measurements results to the estimated ones by utilizing the algorithm (equation (8)) is presented in Table 4 and Table 5. It shows a good concordance of the two values.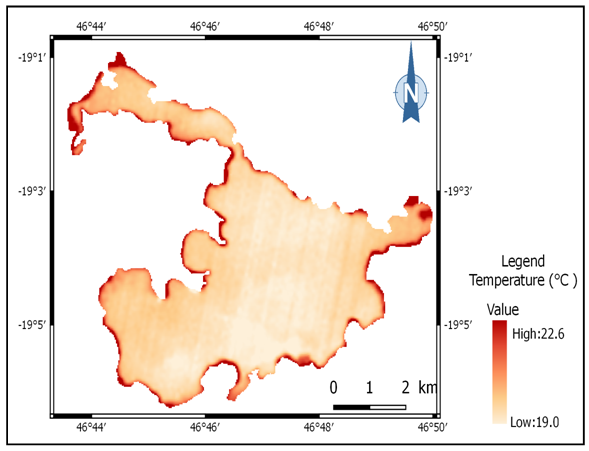 | Figure 2. Map temperature of Itasy Lake (06/05/2018) |
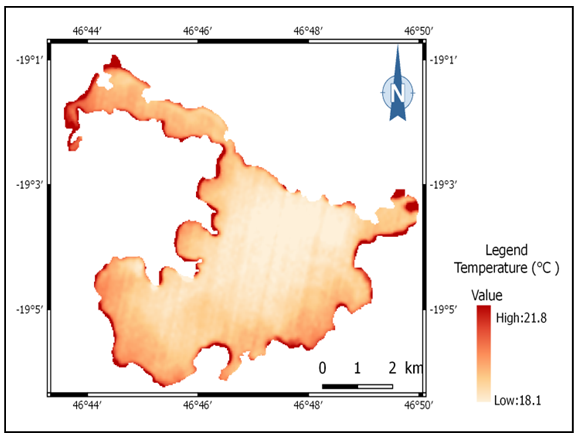 | Figure 3. Map temperature of Itasy Lake (23/06/2018) |
Table 4. In situ measurement compared with estimated
 |
| |
|
Table 5. In situ measurement compared with estimated
 |
| |
|
5. Conclusions
The temperature is the one key parameter for the Lake surface water quality. In this study, we examined the potential of remote sensing data coupled with GIS to detect Itasy Lake water surface temperature on 06 May 2018 and 23 June 2018. OLI and TIRS bands of Landsat 8 data has been used. The results show that Itasy Lake water is in the class of good quality in point of view temperature according to the Malagasy norm. Thus water surface temperature distribution can be calculated using the methodology adopted in this work utilizing the Landsat 8 with multiband and TIRS images.
References
| [1] | Barsi, J.A.; Schott, J.R.; Hook, S.J.; Raqueno, N.G.; Markham, B.L.; and Radocinski, R.G. 2014. Landsat-8 thermal infrared sensor (TIRS) vicarious radiometric calibration. Remote Sensing, 6 (11), 11607-11626. |
| [2] | Bernales, A.M.; Antolihao, J.A.; Samonte, C.; Campomanes, F.; Rojas, R.J.; Dela Serna, A.M. and Silapan, J. 2016. Modelling the relationship between land surface temperature and landscape patterns of land use cover classification using multi linear regression models. ISPRS - International Archives of the Photogrammetry, Remote Sensing and Spatial Information, vol. XLI-B8, p. 851-856. |
| [3] | Carlson, T. N.; Ripley D. A. 1997. On the relation between NDVI, fractional vegetation cover, and leaf area index. Remote Sensing of Environment, 62, pp.241-252. |
| [4] | Dewidar, Kh. and Khedr, A. 2005. Remote Sensing of Water Quality for Burullus Lake, Egypt. Geocarto International, 20(3): 43-49. |
| [5] | Hereher, M.; Salem, M. and Darwish, D. 2010. Mapping water quality of Burullus Lagoon using remote sensing and geographic information system. Journal of American Science. |
| [6] | Landsat 8 Data Users Handbook, 2015. Retrieved March 29, from http://landsat.usgs.gov/documents/Landsat8DataUsersHandbook.pdf. |
| [7] | Lo, C. P.; Quattrochi, D. A; and Luvall, J. C.1997. Application of high resolution thermal infrared remote sensing data and GIS to assess the urban heat island effect. International Journal of Remote Sensing, 18, 287-304. |
| [8] | Rajeshwari, A. and Mani, N.D. 2014. Estimation of Land Surface Temperature of Dindigul District using Landsat 8 Data. International Journal of Research in Engineering and Technology, 3 (5), 122-126. |
| [9] | Santana, I. D. M.; De Jesus, J.B. 2017. Estimation of land surface temperature in caatinga area using Landsat 8 data. Journal of Hyperspectral Remote Sensing, p.8. |
| [10] | Sobrino, J.A.; Jiménez-Muñoz, J.C.; Sòria , G.; Romaguera, M.; Guanter, L.; Moreno, J.; Plaza, A. and Martinez, P. 2008. Land Surface Emissivity Retrieval from Different VNIR and TIR Sensors. IEEE Transactions on Geoscience and Remote Sensing, 6, 316-327. |
| [11] | Yue, W.; Xu, J.; Tan, W. and Xu, L. 2007. The relationship between land surface temperature and NDVI with remote sensing: application to Shanghai Landsat 7 ETM+ data. International Journal of Remote Sensing, vol. 28, n°15, p.3205 −3226. |

 Abstract
 Reference
 Full-Text PDF
 Full-text HTML