-
Paper Information
- Paper Submission
-
Journal Information
- About This Journal
- Editorial Board
- Current Issue
- Archive
- Author Guidelines
- Contact Us
Resources and Environment
p-ISSN: 2163-2618 e-ISSN: 2163-2634
2018; 8(5): 217-222
doi:10.5923/j.re.20180805.01

Investigation of Trace Metals in Water Samples Taken from Kura River
 Abstract
 Reference
 Full-Text PDF
 Full-text HTML
M. M. Ahmadov1, F. Y. Humbatov1, S. M. Ahmadova2, A. Sardarli3
1Institute of Radiation Problems, Azerbaijan National Academy of Sciences, Baku, Azerbaijan Republic
2Department Radiotechnics and Communication, Azerbaijan Technical University, Baku, Azerbaijan Republic
3Department of Indigenous Science, the Environment, and Economic Development, First Nations University of Canada, Prince Albert, Canada
Correspondence to: A. Sardarli, Department of Indigenous Science, the Environment, and Economic Development, First Nations University of Canada, Prince Albert, Canada.
| Email: |  |
Copyright © 2018 The Author(s). Published by Scientific & Academic Publishing.
This work is licensed under the Creative Commons Attribution International License (CC BY).
http://creativecommons.org/licenses/by/4.0/

The present study was conducted to investigate the trace metal contents (Al, As, Ba, Cd, Co, Cr, Cu, Mo, Mn, Pb, Ni, Sr, V, U and Th) of water samples, which were collected from 10 different sites along the river Kura in Azerbaijan Republic. Agilent 7700x Series ICP-MS was used for measurements. The mean concentration of studied metals in the water, followed the decreasing order of Sr > Ba > Al > Fe >Mo > V > As > Cu > U > Ni > Cr > Co > Pb. The concentration of Cadmium and Thorium in all samples were less than 0.02 μg/L and 0.01 μg/L respectively. The measured metals content in water samples for all sites has been found to be less than the limit of recommended by the World Health Organization. The analysis of results showed strong concentration correlation (R: 0.8-1) between groups of elements: 1) Al-Cu-Fe-Ni, 2) Cu-Ni-Co, 3) Al-Pb-Fe, 4) Mo-U- Sr and 5) Ba-Cr at p-value < 0.01 level and may indicate same source. A strong negative correlation exists between Fe and Ba R=-0.65 and is an indication of distinct sources for the metals in the river.
Keywords: Kura River, Trace metals, Agilent 7700 Series ICP-MS, Azerbaijan
Cite this paper: M. M. Ahmadov, F. Y. Humbatov, S. M. Ahmadova, A. Sardarli, Investigation of Trace Metals in Water Samples Taken from Kura River, Resources and Environment, Vol. 8 No. 5, 2018, pp. 217-222. doi: 10.5923/j.re.20180805.01.
1. Introduction
- The river Kura and its main tributary Aras constitute the main waterways of the South Caucasus. Kura and its tributaries receive inputs of water from at least five countries: Armenia, Azerbaijan, Georgia, Iran, and Turkey, before it finally reaches the Caspian Sea. This provides potential for transboundary water pollution within the Kura–Aras watershed. Azerbaijan, situated along the lower stretches of Kura–Aras, is particularly exposed to pollution from countries located further up along the rivers [1, 2]. Figure 1 shows a map of the South Caucasus and surrounding areas, indicating how the Kura–Aras river system may be influenced by ecosystems of different countries. The Kura river starts in Turkey, flows through the main urbanized areas of Georgia including the capital city Tbilisi, and then continues into Azerbaijan. On its way, Kura also receives contributions from some tributaries originating in Armenian territory, contributing to the Azerbaijani section of the Kura river via Georgian territory or directly. Aras also has its initial sources in Turkey and then follows the Turkey/Armenia, Iran/Armenia, and Iran/Azerbaijan borders until it finally enters Azerbaijan territory and joins Kura at Sabirabad, about 100 km from the outlet in the Caspian Sea. This means that there may be considerable potential for transboundary transfer of water pollutants into Azerbaijan, and finally into the Caspian Sea, from other countries in the region. Water pollution is a complex process that leads to changes in water composition, aquatic flora and fauna, and causes water quality deterioration. The economic and recreational use of such poor-quality water becomes dangerous to human health [3-5]. Recognition of the importance of trace metal concentrations evidence in natural waters and/or environment is growing in pollution monitoring studies. For instance, authors of [6] reported about the determined trace metals in drinking water in Irbid (Jordan), and results showed that the level of most elements (As, Ba, Cd, Pb, Cr, Cu, Fe, Zn, Mn, Ni, and Se) were within the Jordanian standards and WHO standards for drinking water. In [7], the occurrence of heavy metals in water of San Petro River in Mexico was studied. The results confirmed that the San Pedro River is contaminated with heavy metals and other contaminants that might affect human health as well as the health of the ecosystem. The assessment of heavy metals pollution in surface water in Ganga in West Bengal showed that the dominance of various heavy metals in the surface water of the river Ganga followed the sequence: Fe >Mn > Ni > Cr >Pb > Zn > Cu > Cd [8]. The investigation of different heavy metals in surface water from Transylvania/Romania showed that toxic heavy metals were detected in water samples in the range of few ppb [9]. In work [10] authors have analyzed different heavy metals in water samples from Malaysia and results showed that the concentrations of heavy metals in water samples were below the detection limit. Monitoring and assessment of the water pollution has become a very critical area of study because of direct implications of water pollution on aquatic life and human beings. The contamination of surface water by heavy metals is a serious ecological problem as some of them, like Hg and Pb, are toxic even at low concentrations, are non-degradable and can bio-accumulate through the food chain. Though some metals, like Fe, Cu and Zn, are essential micronutrients, they can be detrimental to the physiology of the living organisms at higher concentrations [11, 12]. Heavy metals are widespread pollutants of great environmental concern, as they are non-degradable, toxic, and persistent with serious ecological ramification on aquatic ecology [13].
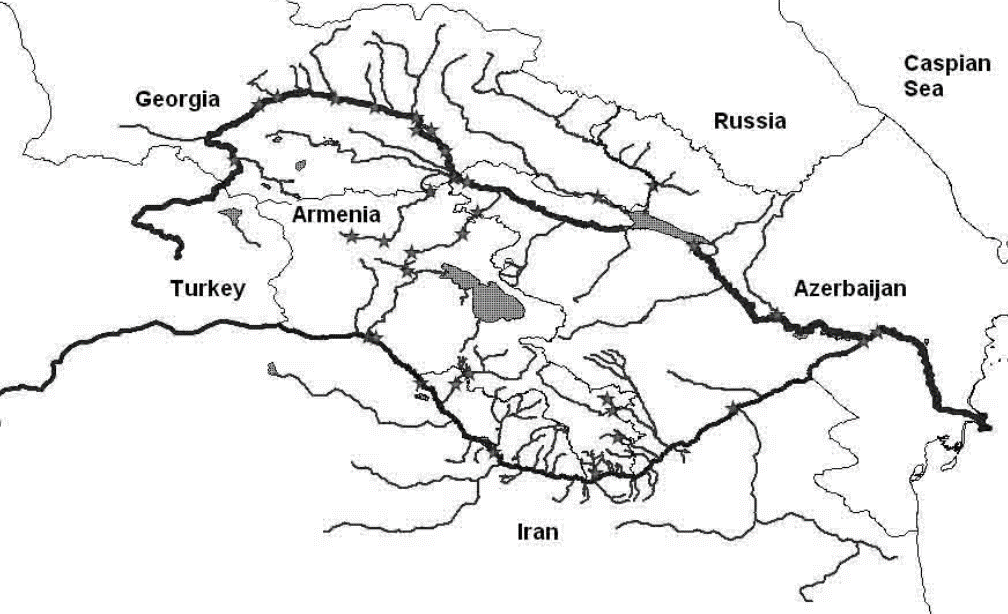 | Figure 1. Kura-Aras watershed |
2. Materials and Methods
- Humans have always depended on aquatic resources for food, medicines and materials as well as recreational and commercial purposes such as fishing and tourism [14]. Determination of natural radio-nuclides such as U and Th in water samples are also important. The determination of uranium and thorium concentrations in geological samples is very important in the exploration of the natural resources of these elements. Of these geological samples, natural waters have special importance as they are indicators of uranium and thorium anomalies.Uranium concentrations of 0.5-1.0 ppb exist in the waters of South Greenland [15]. In the survey of radioactivity in Boyuk Menderes River, Turkey, detected uranium and radium concentrations of 0.24-17.65 ppb and 0.016- 0.751 Bq/l respectively [16]. Bolivar et al. conducted hydro geochemical and stream-sediment reconnaissance in the Montrose quadrangle (Colorado) and determined that the uranium concentration in waters there varied within the range of 0.02-856 ppb [17]. Uranium concentration in 498 drinking water samples taken from four districts of SW-Punjab India has been found to vary between 0.5–579 μgl−1 with an average of 73.5 μgl−1 [18]. The concentration of uranium in various rivers of India such as Yamuna (0.09–3.61 ppb) and Chambal (0.2–1.74 ppb) [19], Bhagirathi (2.11–3.96 ppb) and Alakanda (1.86 ppb) [20] have been previously studied. Springs and streams in Himachal Pradesh, India had 0.07 to 4.65 ppb of uranium [21]. The estimated worldwide averages for dissolved uranium in rivers range between 0.3-0.6 ppb [22] and reach to abnormal high values in some cases due to chemical weathering of uraniferous rocks such as in Platte River of the North American High Plains Region where uranium contents reach up to 31.7 ppb [23]. It has been determined the concentrations of dissolved uranium in forty major rivers from around the world have an average concentration of 0.31 ppb [24]. They noted that this value could be biased by the very high levels observed in the Ganges-Brahmaputra and the Yellow River. Excluding these two river systems, the global average of uranium is reduced to 0.19 ppb. Compared to uranium, thorium is a highly particle-reactive element and does not readily occur as a dissolved ion [25].The present study was conducted to investigate the heavy metal contents (Al, As, Ba, Cd, Co, Cr, Cu, Mo, Mn, Pb, Ni, Sr, V, U and Th) of water samples in ten different sites along the river Kura in Azerbaijan region; the coordinates are shown in Table 1.
 | Table 1. The geographical coordinates of sampling stations |
3. Results and Discussion
- The samples were analysed for Al, As, Ba, Cd, Co, Cr, Cu, Mo, Mn, Sr, Pb, Cu, Ni, V, U and Th using an Agilent model 7700x inductively coupled plasma -mass spectrometry. The 1/% ₋ solutions of multi-element calibration standards in HNO3, were prepared by corresponding dilution of from 10 mg/L multi-element stock standard solutions in 5% HNO3 (Part # 8500-6940). The blank and calibration solutions were measured in optimized conditions. The calibration curve was automatically plotted by the instrument. The linear correlation coefficient (R) in all calibration curves was better than 0.9995. Instrument drift and matrix effects during measurement were corrected by using Sc, Ge, Rh, In, Tb, and Bi, containing internal standards, which were prepared by appropriate dilution from stock ICP-MS Internal Standard (Mix Part# 5188-6525); they were added on-line at the time of analysis using a second channel of the peristaltic pump. For quality control purposes, duplicate samples, matrix-spike samples were analysed. The 7700x ICP-MS Operating Conditions were used for He mode.CRMs were purchased from the NRCC (National Research Council of Canada) and at the Absolute standard and were analysed to validate our procedure: SLRS-5 (river water) and SRM 1640 a respectively. The values and ranges of element concentrations in the water samples are presented in Tables 2 and 3. The concentrations of the analysed elements in water samples were as following: Al: ranged between 0.487—30.62 ug/L, average concentration-9.814 ug/L, As: ranged between 1.031–2.986 ug/L, average concentration-1.947 ug/L, Ba: ranged between 27.74—57.47 ug/L, average concentration-40.32 ug/L, Cr: ranged between 0.110—1.250 ug/L, average concentration-0.348 ug/L, Co: ranged between 0.024—0.050 ug/L, average concentration-0.035 ug/L, Cu: ranged between 1.186–3.200 ug/L, average concentration-1.940 ug/L, Mn: ranged between 0.264–4.358 ug/L, average concentration-0.930, Mo: ranged between 1.238–8.597 ug/L, average concentration-3.538 ug/L, Ni: ranged between 0.346–0.992 ug/L, average concentration-0.632 ug/L, Fe: ranged between 0.673–16.70 ug/L, average concentration-4.889 ug/L, Pb: ranged between 0.010-0.031 ug/L, average concentration-0.020 ug/L, V:, ranged between 1.792-3.459 ug/L, average concentration 2.631 ug/L, Sr: ranged between 265.4—1060 ug/L, average concentration-564.2 ug/L and U: ranged between 0.697—2.919 ug/L, average concentration-1.434 ug/L respectively (Table 2). The values of cadmium and thorium on all sampling points were less than 0.02 μg/L and 0.01 μg/L respectively.
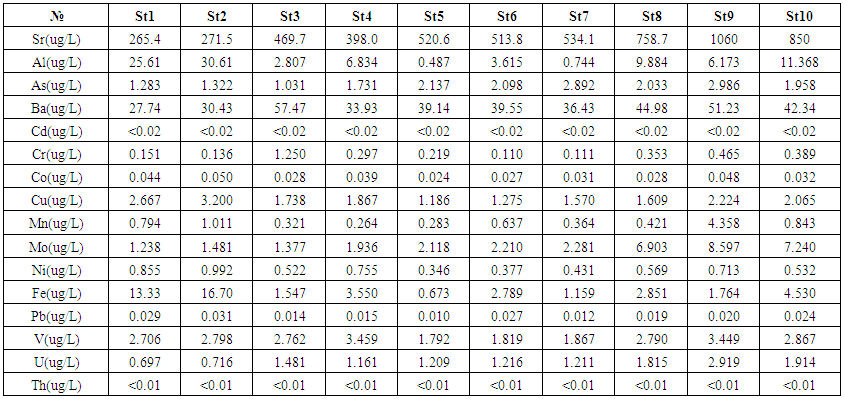 | Table 2. The concentrations of the analysed elements in water samples |
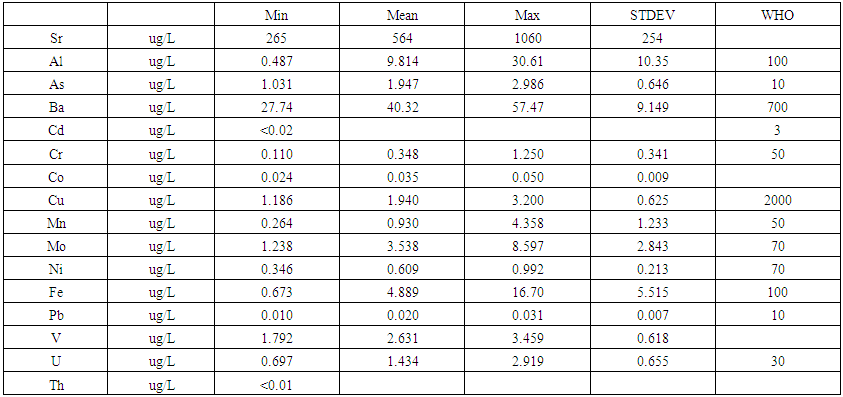 | Table 3. Descriptive statistic results of concentrations of heavy metals compared to WHO guidelines |
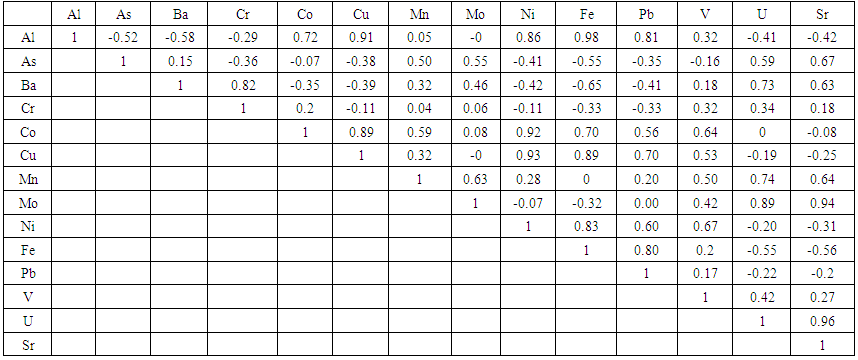 | Table 4. Pearson correlation matrix, between different metals in the water of Kura River |
4. Conclusions
- Within the presented project, we studied the concentration of trace metals in the Azerbaijani region of the Kura River. The mean concentration of studied metals in water followed a decreasing order of Sr > Ba > Al > Fe > Mo > V > As > Cu > U > Ni > Cr > Co > Pb. The measured metals content in water samples in all sites has been found to be less than the limit recommended by the World Health Organization. Correlation analysis provides an effective way to reveal the relationships between multiple variables and thus has been helpful for understanding influencing factors as well as the sources of chemical components. Significant correlation relationships between heavy metals pairs were reported, suggesting existence of a common source of these metals in the water. For estimation the origin of observed metals in samples, the additional investigations are continued in laboratory. Based on the results of our studies, it is recommended: (1) to regularly monitor water quality at the intersections of Kura with the flowing waters; (1) within the country, to build water treatment plant facilities on the drainage waters poured into the Kura, (2) to build water reservoirs over the rivers flowing into Kura from the neighboring countries.