-
Paper Information
- Paper Submission
-
Journal Information
- About This Journal
- Editorial Board
- Current Issue
- Archive
- Author Guidelines
- Contact Us
Resources and Environment
p-ISSN: 2163-2618 e-ISSN: 2163-2634
2018; 8(4): 185-197
doi:10.5923/j.re.20180804.01

Assessment of Groundwater Nitrate Level and Source of Pollution in Dire Dawa, Eastern Ethiopia
 Abstract
 Reference
 Full-Text PDF
 Full-text HTML
Mesfin Sahele1, Moltot Zewdie2, Kannan Narayanan3
1Water Supply and Sanitation Collaborative Council, UNOPS, Ethiopian Sanitation and Hygiene Program, Ethiopia
2Department of Water Resources and Irrigation Engineering, Institute of Technology, Hawassa University, Ethiopia
3Department of Water supply and Environmental Engineering, Institute of Technology, Hawassa University, Hawassa, Ethiopia
Correspondence to: Kannan Narayanan, Department of Water supply and Environmental Engineering, Institute of Technology, Hawassa University, Hawassa, Ethiopia.
| Email: |  |
Copyright © 2018 The Author(s). Published by Scientific & Academic Publishing.
This work is licensed under the Creative Commons Attribution International License (CC BY).
http://creativecommons.org/licenses/by/4.0/

This research was conducted to study the ground water nitrate level, bacterial contamination and its sources. Water samples were collected from 32 water points in both rural and urban areas for testing nitrate, chloride, sulphate and fecal coliform. The research revealed that nearly 86 percent of the study area was polluted with nitrate which exceeds the natural/normal 9 mg l-1 nitrate in the groundwater. The pollution was very high in the urban centre and advances from the south eastern part towards the north and north-western part of the study area. The maximum concentration of nitrate (89 mg l-1) was found in Addis Ketema area while minimum concentration (0.86 mg l-1) at Tome area which is far away from the town. Moreover, the result showed that the concentration of nitrate unevenly declines with increasing water well depth. Source of nitrate was mainly attributed to infiltration of sewage from the pit latrines. Fecal coliform was found in 36 percent of the water wells covering nearly 56 percent of the study area and indicates the source of pollution is faeces. In general, the nitrate and bacterial pollution is mainly due to infiltration of sewage from the pit latrines.
Keywords: Nitrate, Dire Dawa, Groundwater, Quality, Water well, Pollution
Cite this paper: Mesfin Sahele, Moltot Zewdie, Kannan Narayanan, Assessment of Groundwater Nitrate Level and Source of Pollution in Dire Dawa, Eastern Ethiopia, Resources and Environment, Vol. 8 No. 4, 2018, pp. 185-197. doi: 10.5923/j.re.20180804.01.
Article Outline
1. Introduction
1.1. Background
- Water is vital for the existence of all living organisms, but this valued resource is increasingly being threatened as human populations grow (UNEP GEMS, 2008; Dessie, 2010). One of the targets of the Sustainable Development Goal is to achieve universal and equitable access to safe and affordable drinking water for all by the year 2030. Recent statistics confirm that 6.6 billion (91%) people worldwide and 51.7 million (57%) Ethiopians had access to safe water (UNICEF and WHO, 2015). Nowadays, NO3− contamination in groundwater has become a widely concerned environmental problem (Xue et al., 2009). Nitrate (NO3-) pollution is a major problem of water wells in Dire Dawa city. Many water wells showed more than two-fold increase in two decades (Taye, 1999). The maximum concentration of 45 mg/l of nitrate was observed in the groundwater sampled from the middle of the city (Greitzer, 1959), 320 mg/l (Ketema, 1982) while 266 mg/l (MoWR, 2003) in food complex water well (Eyilachew, 2010).Groundwater NO3− contamination is a threat to human health (Gu et al., 2013). Drinking water containing elevated levels of nitrate has been associated with the risk of methemoglobinemia or ‘blue baby syndrome’ (Fan and Steinberg, 1996; Pastén-Zapata et al., 2014) and cancer through the formation of carcinogenic N-nitroso compounds (Weyer et al., 2001). Because of these issues, the World Health Organization (WHO) has set an upper limit of 50 mg/L for drinking water (WHO, 2011).Nitrate concentrations above the WHO's maximum contamination level are relatively common in some regions, especially in the emerging developing countries (Burow et al., 2010; Gu et al., 2013). In Dire Dawa, the occurrence of groundwater nitrate pollution has accompanied the population growth (Taye, 1999). The current trend of settlements over the Sabian water wellfield & unmanageable liquid wastes are accountable for contamination of the groundwater. The unlimited human activities endanger the water quality as most residential areas are not provided with proper waste disposal systems (WWDSE, 2004). Since, constructed wellheads are poorly designed & completed (MS Consult, 2011), they could also contribute to pollution of groundwater. Some abandoned water wells did not properly seal to avoid groundwater pollution. 89% of the people use very poor unlined pit latrines. Due to these facts, groundwater pollution remains the major problems (CSA, 2007). Re-assessment of Sabian wellfield by Ethiopian Institute of Geological Survey showed that nitrates concentration increased by 70% from 1994 (22.8 mg/l) to 1999 (38.9 mg/l) in Sabian water wells (WWDSE, 2002). In addition, the feasibility study and Water Abstraction report for Harar Water Supply project clearly showed that the nitrate amount in Aseliso water wells are 0 to 0.3mg/l of nitrate against 50 mg/l of WHO guideline value (WHO, 2008 and MS Consult, 2011). From what has been observed so far, the Dire Dawa city groundwater needs updating of its nitrate level as over 13 years have passed since WWDSE revised and produced the nitrate zonation map. Therefore, this research is targeted to perform a detailed study of the groundwater quality of the Dire Dawa city with respect to nitrate, chloride and possible source of nitrate pollution. The study result brings verifiable groundwater nitrate data, contributed to addressing problems related to sustainable utilization of groundwater, thereby defined the degree of nitrate contamination. In addition, it will also help to improve the awareness of the concerned institutions towards water quality of the area and the likely public-health burden related to nitrate.
2. Materials and Methods
2.1. Description of the Study Area
- Dire Dawa is located 510 km east of Addis Ababa and it is generally characterized by arid or semi-arid climate without perennial stream, with mean annual temperature and rainfall of 25.3°C and 618mm respectively (WWDSE, 2004). The study area covers UTM 1059754 N to 1067650 N and 804511 E to 816913 E (Fig 1). It has an estimated land of 9,962.6 ha with a mean altitude of 1160 masl and an estimated population of 232,854 (67.5%) urban people (CSA, 2007). The first piped water supply for the city was constructed in the year 1914 using Lega Hare spring. The current water supply system designed as Phase-I by the Associated Engineering Service Limited (AESL) and was commissioned in 1992 to serve until 2002 G.C. These systems consisted of the Lega Hare spring and nine boreholes from Sabian wellfield (MS Consult, 2011).
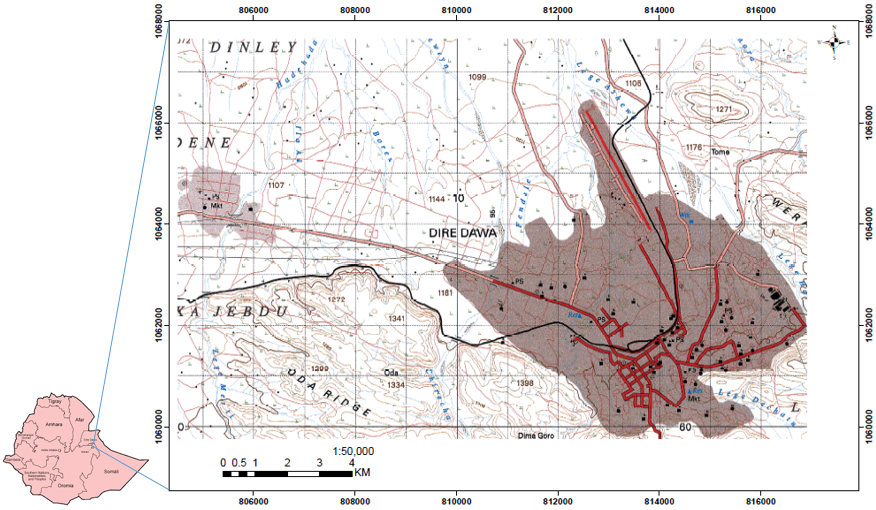 | Figure 1. Location map of the study area (EMA, 2000) |
2.2. Materials
- The study employed the following materials and instrumentation during the primary and secondary assessment of the research work in the sampling to analyze the sampled data. × Half litre plastic bottle, marker and masking tape for water sample collection and labelling× Icebox and ice bag for storage and transportation of collected water samples× 1:50,000 topographic map (printed and scanned copy) for locating the sampling points, × GPS map 76 for locating of water sources,× Digital photo and video camera,× Photometer 7100 and Patho screen for testing the sampled water× AutoCAD 2007, Arc GIS 10.3, Surfer 10 and Global mapper 12 GIS software for data entry, analysis, mapping and reporting
2.3. Data Collection Methods
- Both primary and secondary data sources were assessed to generate data for the research. The first phase was desk review of the available and pertinent literatures, reports and maps to nitrate and Dire Dawa (DD). The second phase was primary data generation through collection of groundwater samples, preparation of 1:50,000 base map, GPS location of water sources, photographing and videoing of water sources and laboratory analysis of water for nitrate, chloride, sulphate and fecal coliform. Data obtained from the fieldwork, laboratory analysis and literature was assessed from water quality perspective. To gain more information and to counter check the various data obtained from the secondary and primary sources, the nitrate and fecal coliform bacteriological data were interpreted against the field observation and Ethiopia and WHO guideline values.
2.4. Sampling and Sample Size Determination
- In many water bodies the issues of where to sample and how many samples to take in order to give representative results for the whole water body need more than an intuitive choice of sampling design. Nevertheless, the task of deciding the optimum number of samples to take and the most suitable locations in a water body in order to characterize its water quality in a meaningful way, and with the most economic use of resources, can be quite discouraging (Deborah, 1996).One time groundwater samples including geographic coordinates were manually collected from the 29 water wells against the planned 28 water samples in the month of December which comes in dry season. Since the study area comes under arid region with low rainfall of less than 620mm, the influence of season on pollutant is limited. The water wells were grouped into five locations with each group consisting of 13, 4, 3, 5 and 3 water wells at Dire Dawa central area, Sabian, Tome, Boren & Melka respectively (Fig 2). The basis of the stratification includes population density, relative age of settlement (old or young), presence of wellfield (old & new), exposed surface geologic material (sand or clay) and relative location of the water well (fully in town or town periphery). In addition, three deep water well water samples were taken from different rural areas and two hand dug wells in the town. These additional samples were served as comparator between hand dug wells to depth of 30 meter and deep water well above 60 m depth range in rural and urban water wells.
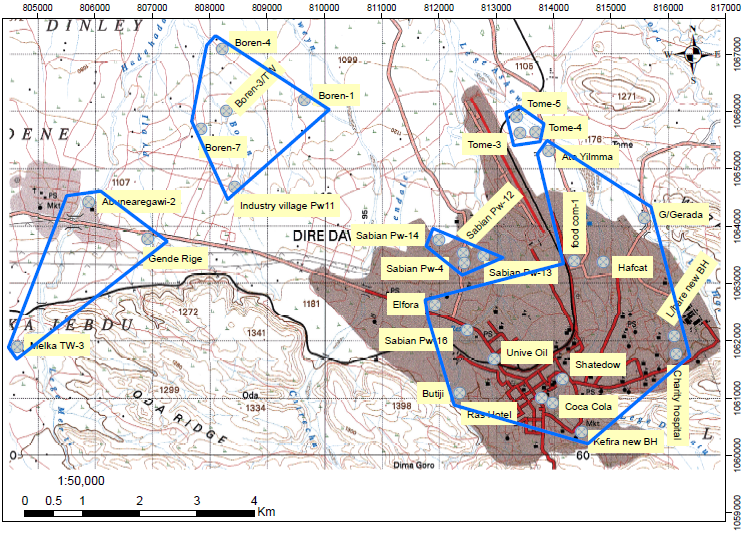 | Figure 2. Spatial distribution of sampled water wells |
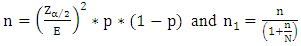 | (1) |
 Confidence level at 90% is equivalent to 1.64 ensure optimum sample size E – margin of error, assume 10% p - proportion of polluted sample, 21.4% 1-p – proportion of non-polluted sample, 78.6%
 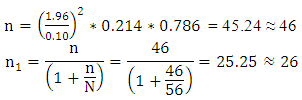 This research employed stratified groundwater sampling as there was heterogeneity in the location of water wells and age of settlement (history of settlement) of the water wells. In view of this, simple random sampling was then employed to draw samples from the five stratum/sampling areas that appear to be "representative" of average conditions. The sample size of each strata was determined by using probability proportion to sampling size method (Maskurul et al., 2015).
2.5. Water Quality Analysis
- The software was used to generate graphs and maps of nitrate, chloride, sulphate and bacteria. Photometer 7100 and membrane filtration instruments were also employed to analyze the nitrate, and fecal coliform bacteriological condition of the collected groundwater samples mainly to understand the degree of nitrate pollution and the sources associated with it. The research also considered chloride and sulphate concentration as there was positive correlation between these ions and concentration of nitrate in the groundwater (Taye, 1999; WWDSE, 2004; Eyilachew, 2010 and Qianqian et al., 2015). In order to efficiently use the thesis budget and time, relevant nitrate, chloride, sulphate and fecal coliform load of Dire Dawa water wells were dealt mainly to substantiate the study subject. Finally, the results were used to generate the nitrate level, the bacteriological load of the groundwater in the city and to indicate the source of nitrate pollution. The accepted approach in tracing microorganism in water is to analyze for indicator organisms that inhabit the gut in large numbers and are excreted in human/animal faeces. The presence of these indicator organisms in water is evidence of fecal contamination (UNEP/WHO, 1996 and Potakit, 2011). The group of indicator bacteria tested for with the Potakit + are called Coliforms; more specifically the focus is on the enumeration of Thermotolerant Coliforms (sometimes called Fecal Coliforms). These are bacteria that originate from fecal sources (UNEP/WHO, 1996 and Potakit, 2011). Thermotolerant Coliforms or Fecal Coliforms are used in water microbiological testing to denote coliform organisms which grow at 44 or 44.5°C (UNEP/WHO, 1996 and Potakit, 2011). Total coliform and Fecal Coliforms were determined using Membrane Filtration Plate Count method as explained in standard methods (APHA, 1998).
3. Results and Discussion
3.1. Groundwater Nitrate Level
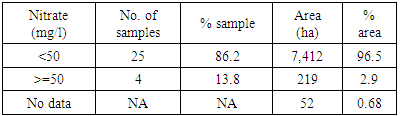
- The analysis result of the 28 water samples indicated that the concentration of nitrate spatially varied between 0.86 mg/l and 88.9 mg/l within the study area. The summary of nitrate analysis of groundwater indicated that 13.8% of the groundwater samples which cover 2.9% of the study area have nitrate values above 50 mg/l (Table 1). The nitrate concentration in the central part of the city is above 50 mg/l exceeded the WHO and Ethiopia standard of nitrate in drinking water (WHO, 2011; ESA, 2013). Therefore, the 2.9% groundwater area has been seriously affected by the nitrate pollution and limits its suitability as drinking water source. The remaining 86.2% of groundwater samples from the areas which covers 96.5% of the total study area had nitrate values below 50 mg/l and it is in full compliance with WHO and Ethiopia drinking water guideline value of below 50 mg/l nitrate (WHO, 2011; ESA, 2013) and are safe for drinking water need of the city.
|
|
3.2. Spatial Variability of Nitrate
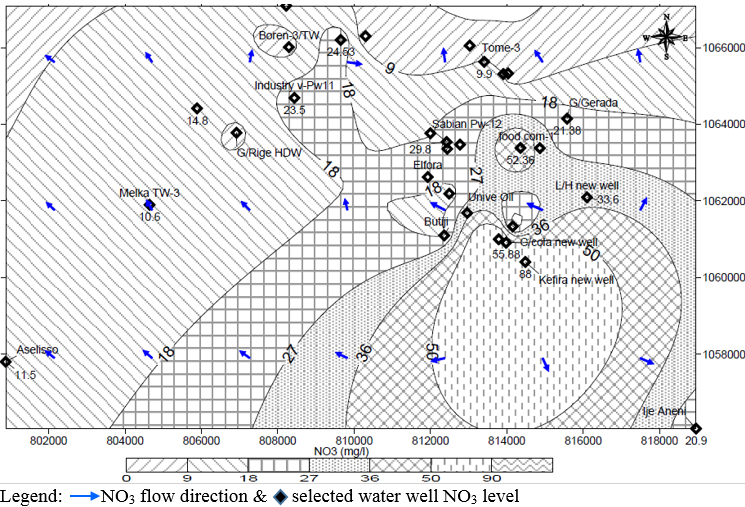
- The spatial distribution and flow direction of nitrate indicate the spatial variability of nitrate concentration (Fig 3). Accordingly, the southeast and south part of the study area (central part of the DD city) has the maximum/peak nitrate concentration of 88 mg/l at Ras Hotel and Addis Ketema areas where as the minimum/lowest value of 0.86 mg/l and 2.91 mg/l of nitrate found in Tome and Boren water wellfields respectively. Different scholars indicated that groundwater nitrate concentrations have gradually increased with rapid urbanization, economic development and population density. They also indicated that domestic waste discharge was the main source of pollution during rapid urbanization. The high levels of urbanization and population density would appear to be causing high levels of domestic wastewater being discharged into the environment, and resulting in the increased nitrate concentration in the groundwater (Taye, 1999; Eyilachew 2010 and Qianqian, 2015).
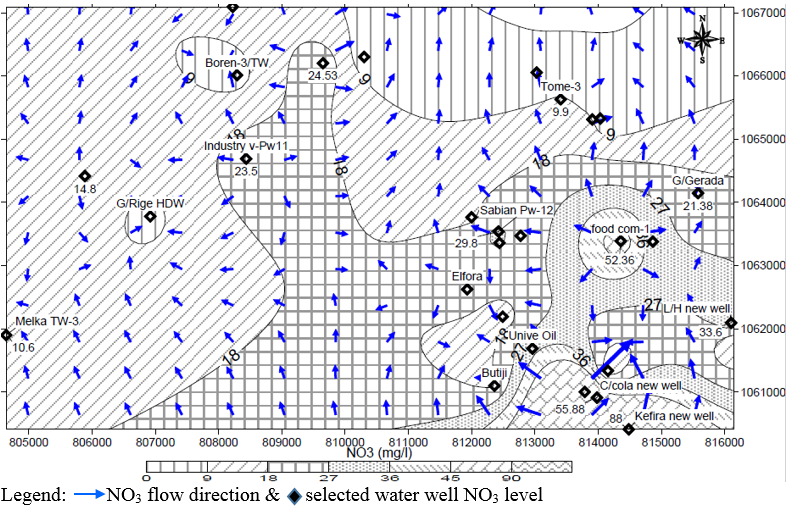 | Figure 3. Spatial distribution of nitrate with flow direction |
|
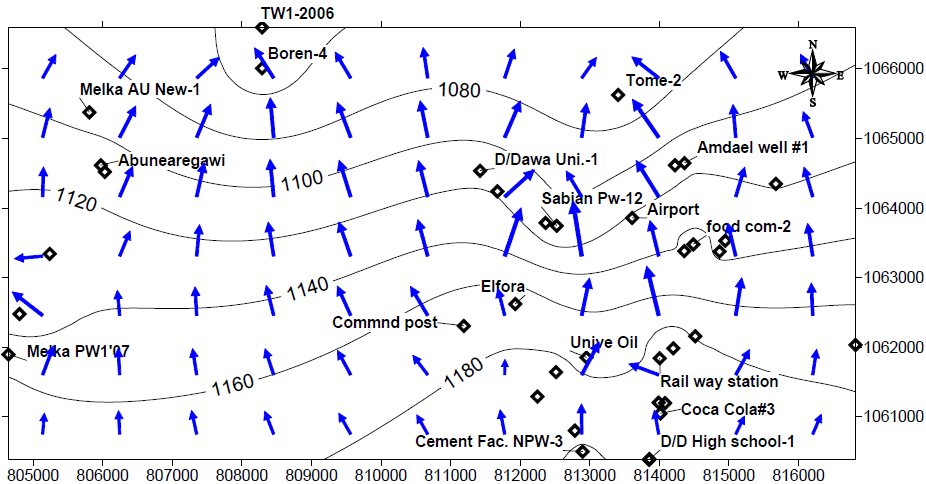 | Figure 4. DD Groundwater level with flow direction |
3.3. Nitrate Concentration with Depth
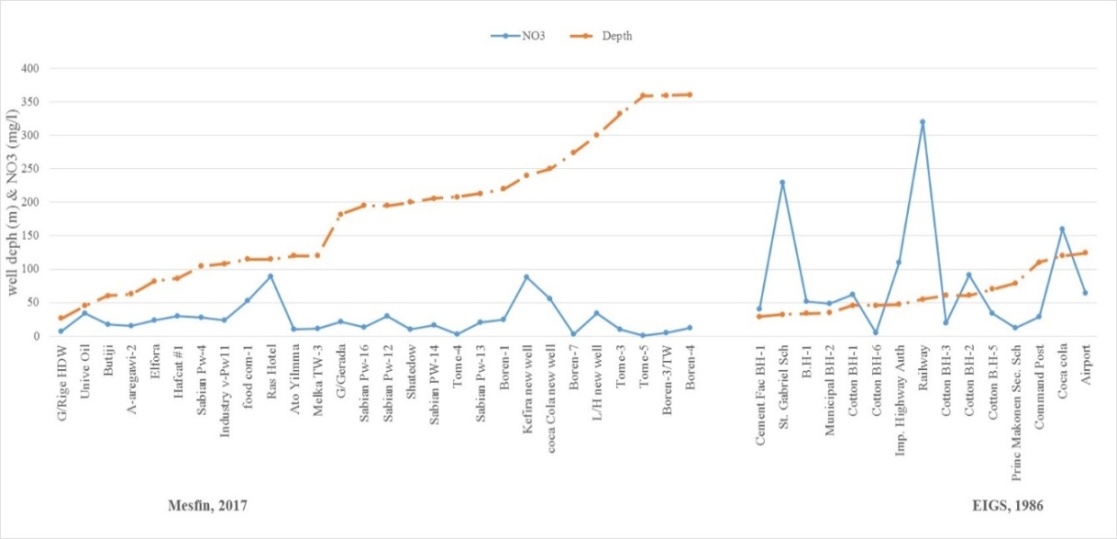
- The plot of nitrate against the depth of sampled water well indicated that shallow water wells are more liable to contamination and have high concentration of nitrate as compared to deep water wells (Fig 5). The concentration of nitrate tends to decline with increasing depth in the groundwater. The water quality analysis carried out by EIGS in 1986 mainly collected water samples from hand dug wells and shallow water wells that were highly prone to contamination and located in the centre of the city. Unlike EIGS 1986, water samples were mainly collected from the deep water wells where nitrate tend to reduce as a result of possible reduction in nitrate pollution due to prevalence of anaerobic environment. The plot of nitrate with depth indicated that the maximum and minimum concentration of 320 mg/l and 5 mg/l value were recorded in shallow water wells of depth 54.9 m and 45.7 m in the central and peripheral part of the town at railway and cotton factory areas respectively. Similarly, the maximum and minimum values of 88.9 mg/l and 0.86 mg/l of nitrate are recorded in the water wells at depth of 120 m and 361 m respectively.
 | Figure 5. Occurrence of nitrate in shallow and deep water wells |
3.4. Bacteriological Analysis
- The critical level in terms of fecal pathogen indicator is 0.0 E. coli per 100 ml of water (WHO, 2006). The use of poorly constructed pit latrine in permeable sandy formation like Dire Dawa, may result in drinking water contamination due to pollutants leaching into an aquifer. The bacteriological analysis of the 28 water samples indicated that 36% of the sampled groundwater sources covering 56.2% of the study area were contaminated with fecal coliform (Fig 6). The largest bacterial colony count (32 count/100 ml) is found in the unprotected 26 m deep in town located hand dug well followed by 24, 16 and 14 bacterial colony count at water well depths of 119 m, 250 m deep water well and 108 m in Aselisso, Coca and Industry villages respectively. The Coca water well which is deeper than both Aselisso and Industry village should have low bacterial count. However, its mid-town location and probably semi-confined nature of the aquifer that might have facilitated direct recharging of contaminated surface runoff contributed to the high bacteria count against the relatively shallower depth of rural located water wells in Aselisso and Industry village.
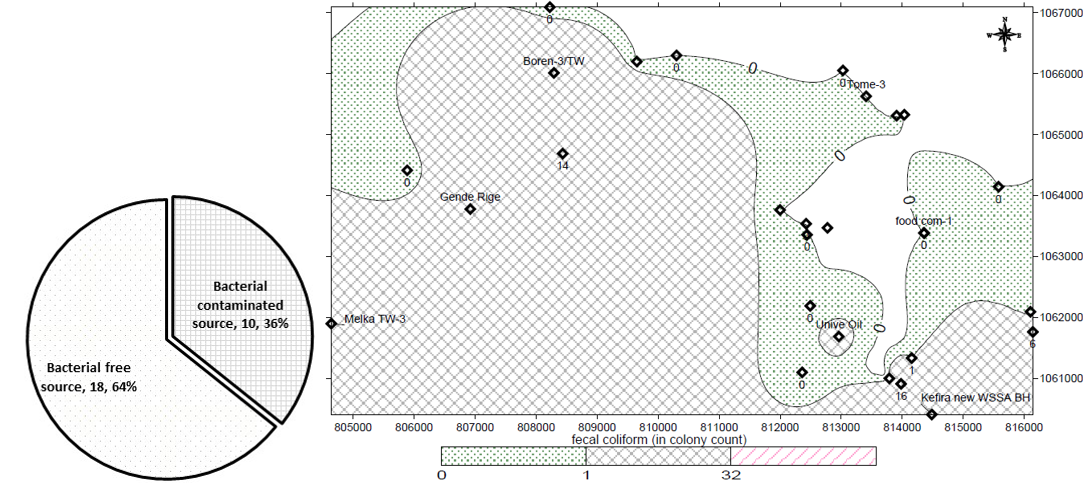 | Figure 6. Proportion and spatial distribution of fecal coliform in sampled sources |
3.5. Source of Groundwater Nitrate Pollution
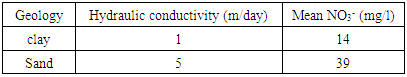
- The presence of fecal coliform in 12 of the sampled water wells is a clear indicator that fecal contaminant is attributed to the pollution of the water well with fecal origin. It is evident from the discussion of hydrogeology of the Dire Dawa area and associated groundwater quality of the geologic formations, there is lack of Caliche rock in the area that naturally contributes for nitrate in the groundwater (WWDSE, 2004). In addition, the low concentration of nitrate in the rural water well as opposed to high concentration in the urban centre signifies that fertilizer is not the main source of nitrate concentration in the groundwater of Dire Dawa.
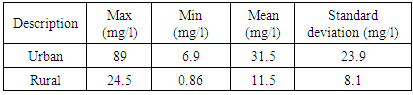
3.6. Nitrate Concentration in Urban and Rural Water Wells
- The rapid growth of urban population in developing countries leads to unplanned settlements where limited pit latrines or septic tanks are the only options available for sewage disposal (Wakida, 2008). Urban sources of nitrate-N may have a high impact on groundwater quality because of the high concentration of potential sources in a smaller area than agricultural land (Wakida and Lerner, 2005). The plot of nitrate including water wells in the rural areas (Fig 7) indicated that urban areas are more polluted with an average of 30.2 mg/l of nitrate against 11 mg/l of rural areas. In addition, the maximum nitrate concentration of 89 mg/l was found in the urban against 24.5 mg/l in the rural are recorded (Table 4). The high concentration of nitrate in the urban centre is mainly attributed to 89% households utilize pit latrine built in permeable sand layer that facilitate easy infiltration of excreta into the groundwater. In addition, the high urban population density mainly 20 to 100 and 100 to 200 persons per hectare against 0 to 20 persons per hectare in the rural areas. More people per hectare means more waste generated and discharge into the groundwater.
 | Figure 7. Nitrate zonation including rural area water wells |
|
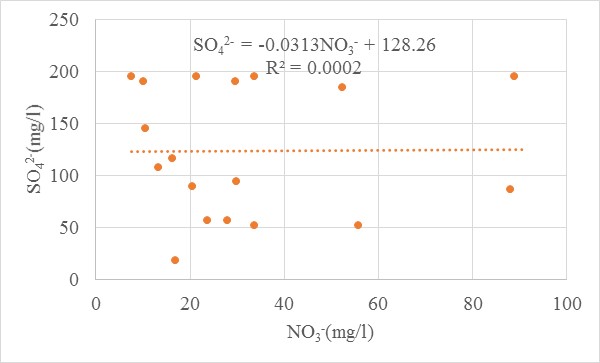
3.7. Chloride and Sulphate Analysis
- Widory et al. (2005) and Lee et al. (2008), found out that there is no relationship between the NO3− and Cl− in the PRD region of China due to more complex sources of pollution. Similarly, the plot of chloride versus nitrate and sulphate versus nitrate indicated there is very weak/poor correlation in the DD city area as the contamination is not limited to human waste but also it includes wastes from beverage, textile, garages, oil and flour industries (Fig 8).
 | Figure 8. Nitrate versus sulphate within DD city |
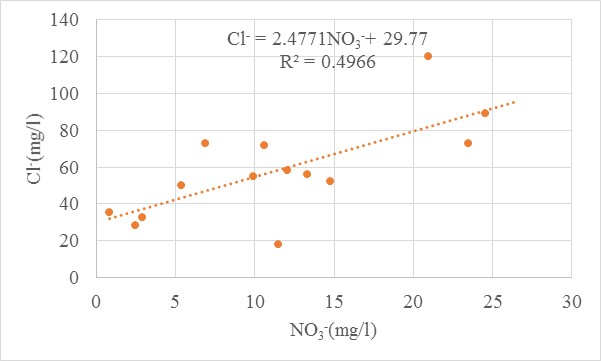 | Figure 9. Correlation of Nitrate with chloride away from DD |
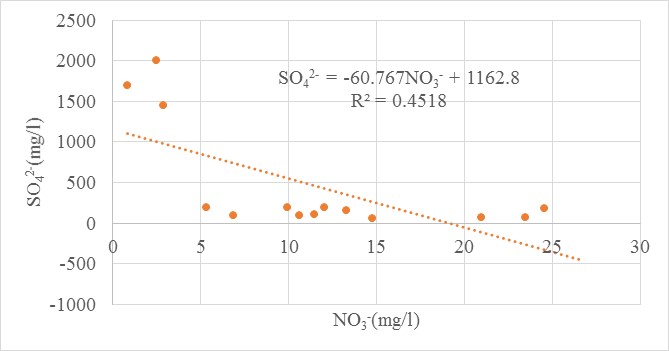 | Figure 10. Correlation of Nitrate with sulphate away from DD |
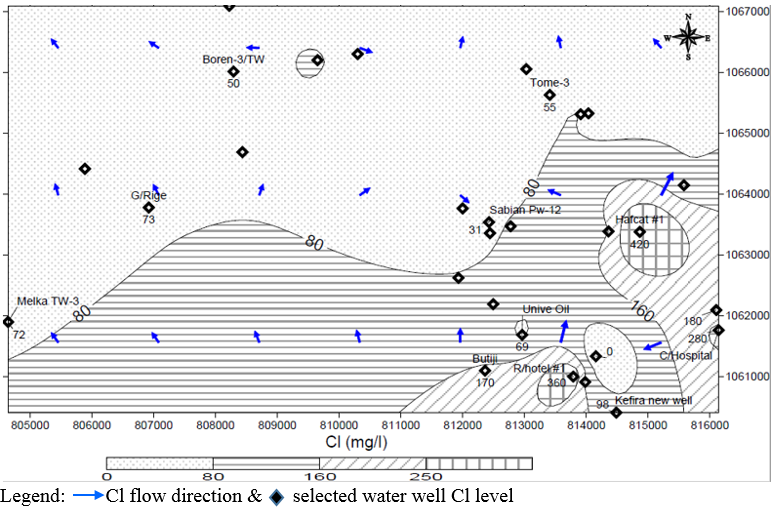 | Figure 11. Chloride zonation mapping and flow direction |
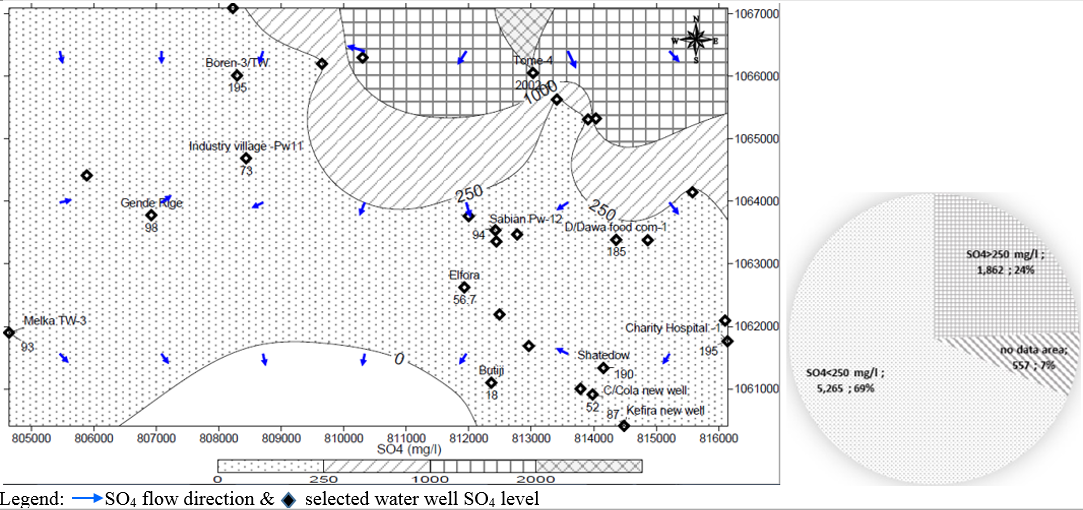 | Figure 12. Spatial distribution and areal coverage of sulphate |
4. Conclusions and Recommendations
4.1. Conclusions
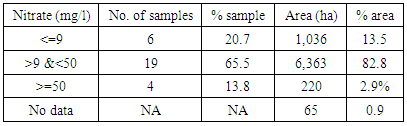
- The study reveals that 79.3% of groundwater samples with 85.7% areal coverage have nitrate values above 9 mg/l of which 13.8% of groundwater source with 2.9% areal coverage have potential threat to induce blue baby syndrome. The spatial distribution of nitrate indicated that the southeast and south part of the study area has the maximum nitrate concentration of 88 mg/l at Ras Hotel and Addis Ketema areas where as the concentration of nitrate declines towards north, northwest and west of the study area and reach its lowest value of 0.86 mg/l and 2.91 mg/l at Tome and Boren wellfields respectively. The plot of nitrate including the water wells in the rural areas indicated that urban areas are more polluted with maximum and average values of 88.9 mg/l and 30.2 mg/l of nitrate against 24.5 mg/l and 11.5 mg/l of rural areas. If fertilizer was the major source of nitrate, there should be high concentration in the rural water wells than urban water wells and the nitrate might have been flowing from rural towards urban areas. Rather nitrate is currently advancing from urban centres towards the periphery and rural areas. The plot of nitrate with depth also indicated that the maximum concentration of 320 mg/l was found in shallow water well (54.9 m depth) at the location of railway where as minimum (0.9 mg/l) nitrate concentration was recorded in deep water well (361 m depth) respectively. Generally, nitrate tends to decline with depth mainly attributed to the prevalence of anaerobic environment that lead to denitrification or degrading of nitrate to nitrogen. The spatial distribution of fecal coliform contaminated sources indicated that 28.6% of the contaminated groundwater source falls within the urban areas where as 7.1% of the groundwater sources were from the wellfield located in the rural setting. Hence, the presence of fecal coliform in the urban and rural water wells clearly indicated that the source is mainly human waste specifically excreta as only Hafcat and Amdale areas had animal farming nearer to the sampled groundwater sources as compared to presence and utilization of 89% pit latrine mainly built in the permeable sandy layer. The closer examination of bacterial free groundwater sources signifies that water well depth and relative location of the water well in the urban and rural setting are not the sole determinant factor rather the confined aquifer nature of the water well was the main limiting factor. There is very weak/poor correlation between nitrate with chloride and sulphate which shows that the contamination is not limited to anthropogenic source alone. However, there is positive correlation of nitrate versus chloride and negative correlation for sulphate for water sources located in the rural areas as the contamination is mainly related to human induced waste. In some places like Tome and Boren, the natural contribution of sulphate is highly significant and the geologic well log shows the presence of marine sediment rich sulphate (MS consult, 2015). The spatial mapping and distribution of chloride indicated that 10.3% of groundwater sources covering 1.8% of the studied area exceeded the 250 mg/l chloride guideline value (WHO, 2011; ESA, 2013). These high-level chloride concentration areas lie within the DD city and overlap with the high concentration of nitrate in the specific localities of coca cola and Hafcat. Similarly, the analysis of sulphate indicated that 10.3% groundwater sources with 24.2% area coverage exceeded the 250 mg/l guideline value (WHO, 2011; ESA, 2013). Unlike nitrate and chloride, sulphate showed reversed flow direction. The high concentration of sulphate in Tome and Boren area is attributed to the presence of sulphate rich geologic formation like marine sediment known to contain gypsum (MS consult, 2015). In general, it could be concluded that there was uneven high (88 mg/l) concentration of nitrate in the urban centre and it declines towards the periphery and rural areas. The research also finds out that 87% of the study area showed above normal/natural (9 mg/l) concentration of nitrate in the groundwater. Furthermore, shallow water wells are more polluted than deep water wells and the concentration of nitrate declines with increasing water well depth. The fecal coliform was found in 36% of the water wells covering nearly 56% of the study areas. Hence, the source of nitrate pollution is mainly attributed to infiltration of sewage from the pit latrines. Since annual rainfall is less than 600mm, seasonal variation of ground water quality is less pronounced.
4.2. Recommendations
- In areas, like Dire Dawa where groundwater is the sole source, proper excreta management is crucial. Hence, the city administration together with DD WSSA, Environment and Sanitation and Beautification Agency should consider the following recommendations: × Delineate buffer zone based on simulation of nitrate propagation × Resident should have to construct water tight/proof latrine substructure × High nitrate concentration water wells should be excluded from the list of water distribution source for drinking needs for instance Addis Ketema× The DD city Water Supply and Sewerage Authority must always disinfect the water prior to distribution× The DD Water Supply and Sewerage Authority could make use of drilling deep water wells as a temporary solution to reduce the effect of nitrate