-
Paper Information
- Previous Paper
- Paper Submission
-
Journal Information
- About This Journal
- Editorial Board
- Current Issue
- Archive
- Author Guidelines
- Contact Us
Resources and Environment
p-ISSN: 2163-2618 e-ISSN: 2163-2634
2018; 8(3): 174-183
doi:10.5923/j.re.20180803.09

Modeling of the Dynamics and Prediction of Transparency of a Mesotropic Tropical Lake: Bakré Lake (Abidjan, Côte d'Ivoire)
 Abstract
 Reference
 Full-Text PDF
 Full-text HTML
Yapo Habib Kpidi1, Mamadou Guy-Richard Koné2, Tiama Guy Ballet1, Lamoussa Ouattara2, Ossey Bernard Yapo1, 3, Nahossé Ziao2
1Laboratoire des Sciences de l’Environnement (LSE), (UFR-SGE), Université Nangui Abrogoua, 02 BP 801 Abidjan 02 - Côte-d’Ivoire
2Laboratoire de Thermodynamique et Physico-chimie du Milieu (LTPCM), (UFR-SFA), Université Nangui Abrogoua, 02 BP 801 Abidjan 02 - Côte-d’Ivoire
3Laboratoire Central de l’Environnement, Centre Ivoirien Anti-pollution (LCE-CIAPOL)
Correspondence to: Mamadou Guy-Richard Koné, Laboratoire de Thermodynamique et Physico-chimie du Milieu (LTPCM), (UFR-SFA), Université Nangui Abrogoua, 02 BP 801 Abidjan 02 - Côte-d’Ivoire.
| Email: |  |
Copyright © 2018 The Author(s). Published by Scientific & Academic Publishing.
This work is licensed under the Creative Commons Attribution International License (CC BY).
http://creativecommons.org/licenses/by/4.0/

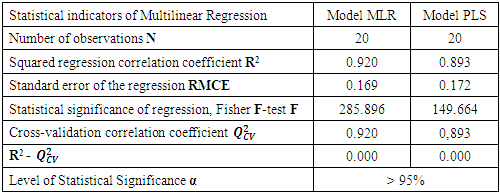
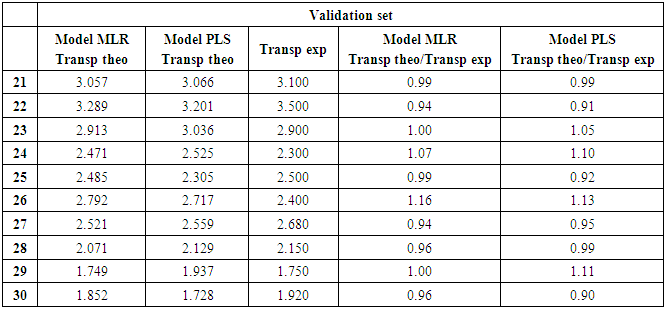
In this study, thirty samples were collected bimonthly from August 2015 to December 2016 at six locations of Bakré Lake and analyzed. Lake Bakré, located in the sub-equatorial Attiean climate, between the Atlantic Ocean in the South and the Ebrié Lagoon in the North, is an endorheic lake with a surface outfall, Abidjan (Côte d'Ivoire). A modeling study was conducted in order to determine a quantitative and qualitative relationship between transparency and five (5) physico-chemical descriptors (temperature, turbidity, nitrite ((NO2-), nitrates (NO3-) and ammonium (NH4+)). These descriptors were used as the explanatory and predictive parameters of the transparency of the selected samples taken at from Lake M'koa in a previous study. This study was conducted by using the Principal Component Analysis (PCA), the Ascending Hierarchical Classification (AHC). And then multilinear regression (MLR) and partial least squares (PLS) quantitative and qualitative models were proposed. These models were accredited to have good statistical indicators and so have been validated according to the principles established by the Organization for Economic Co-operation and Development (OECD). The statistical indicators of the MLR reveal more efficient predictions with the coefficient of determination R2 = 0,920, the standard error RMCE = 0.169, correlation coefficient of cross-validation Q2cv = 0.920, and Fisher test F = 285.896. This model is acceptable with 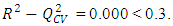 The values of the Transp theo / Transp exp report of the validation set tend (is closed) to unity, and the obtained results suggest that the combination of these 5 descriptors could be useful for predicting the property of Transparency. In addition, temperature is the priority (useful) descriptor for the prediction of transparency on the Bakré Lake stations.
Keywords: Eutrophication, Transparency, Quantitative Structure-Property Relationship (QSPR), Physico-Chemical Descriptors
Cite this paper: Yapo Habib Kpidi, Mamadou Guy-Richard Koné, Tiama Guy Ballet, Lamoussa Ouattara, Ossey Bernard Yapo, Nahossé Ziao, Modeling of the Dynamics and Prediction of Transparency of a Mesotropic Tropical Lake: Bakré Lake (Abidjan, Côte d'Ivoire), Resources and Environment, Vol. 8 No. 3, 2018, pp. 174-183. doi: 10.5923/j.re.20180803.09.
Article Outline
1. Introduction
- Water is a useful and indispensable resource for the life of any living organism. Maintaining its quality healthy is a major problem for societies that they must face according to the growing water needs [1, 2]. The deterioration of the quality of these waters seems to come from strong anthropic pressures (agricultural activities, industrial and / or domestic effluents discharged into the receiving environment without being treated before). The quality of water is therefore the main cause of most public health problems in developing countries [3, 4]. The assessment of the trophic state of the aquatic environment consists in carrying out physico-chemical and biological measurements of a group of environmental variables those seem to be dependent on several constraints. Nowadays, there is growing interest in developing alternative methods for monitoring the quality of the aquatic environment and the rational management of its resources in order to remove these constraints. Eutrophication is defined as a natural aging process of aquatic environments. It can be accelerated by anthropogenic activities on their watershed [5]. In addition, the functioning of aquatic ecosystems is governed by dynamic equilibria. However, eutrophication is an operating imbalance triggered off by a change in the quantities, relative proportions or forms of nitrogen and phosphorus entering in these aquatic systems. The nature and intensity of the responses therefore depend on environmental factors favoring eutrophication. However, the preservation of these remarkable ecosystems for their undeniable ecological and socio-economical roles and the sustainability of good environmental health status are therefore an urgent and useful necessity for coming generations (sustainable development). Thus, the control of the factors that can disturb the equilibrium of these lacustrine ecosystems seem to be a major interest [6]. To stop the eutrophication of these aquatic systems, a continuous monitoring of their physico-chemical and biological qualities and other eutrophication factors must be done. This indispensable monitoring seems to be expensive in terms of equipment and reagents. To overcome the considerable demands and investments in terms of logistics and chemical products necessary for taking (sporadic) punctual or continuous measurements [7]. The development of alternative methods for the rational management of water resources is an opportunity. Although mathematical models of eutrophic ecosystems have been developed to understand and represent ecological dynamics, some of them have been used to estimate eutrophication risks and to evaluate the necessary reduction of nutrient supplies. It is an approach which seems to be based on models those are qualified to be statistical. They seek (try) to predict one or more eutrophication descriptors according to causal variables which were measured in the working area [8, 9]. Thus, transparency is a variable which can be modeled and seems to reflect the influence of dissolved organic compound and particle those are released into water. These last ones color water and make it cloudy. Thus, a Quantitative Structure Property Study (QSPR) is used to elaborate models by using physico-chemical descriptors. This statistical approach can combine methods such as linear regression, partial least squares regression, and so on. Generally all the descriptors of the equation of the QSPR model must be a function of at least 1/5 of the initial data, here we have thirty (30) samples. The main aim of this study is to design statistical models by multiple regressions (linear and partial least squares) which are capable to predict the transparency property of the waters of Lake Bakré by using environmental variables. Specifically, the question is to identify meaningful and expressive explanatory variables of transparency in order to develop simulation tools that will be useful for integrating and sustaining the management of water resources.
2. Materials and Methods
2.1. Presentation of the Study Area
- Located in the sub-equatorial Attiean climate, between the Atlantic Ocean in the South and the Ebrié Lagoon in the North, Lake Bakré, Abidjan (Côte d'Ivoire) is an endorheic lake with a surface emissary, the Vri (Figure 1). It is located between 4°02'57 "and 4°07'49" west longitude and 5°14'54"and 5°15'48" north latitude. A shallow natural lake with an average depth of 7.07 m, approximately 9 km long with an area of approximately 5.636 km2, Bakré Lake is infiltrated and comprises an East-West main channel and four North-South secondary channels [10].
 | Figure 1. Mapping of the study area |
2.2. Physico-Chemical Descriptors
- Temperature, turbidity, nitrate (NO3-), nitrite (NO2-) and ammonium (NH4+) are the physico-chemical descriptors used for transparency modeling. The transparency property was measured by the Secchi disk. Indeed, immersed until complete disappearance, the Secchi disk came slowly back and the depth at which the disc becomes visible then determines the transparency of the area or the depth according to Rodier et al. [11]. Water transparency depends on the amount of particles in the water. These particles can be algae or sediment from erosion, the more particles the less water transparency. In other words, when the water is murky or cloudy and contains a lot of particles, the light cannot penetrate as deeply into the water column. These materials may be of mineral origin (silt, clay) or organic (plant and animal debris, microorganisms, algae, chemical compounds). This property is inversely proportional to the turbidity which allows to identify the visual information on the water. Turbidity reflects the presence of suspended particles in the water (organic debris, clays, microscopic organisms, etc.). It reduces both photosynthesis and the dissolved oxygen content because of the presence of biodegradable colloids [11]. Water quality monitoring using modeling is essential to map its turbidity [12]. Water turbidity is a good indicator in predicting the state of health of the wetland in order to maintain its ecosystem [13]. Temperature is the most important kinetic factor for all chemical and biological reactions in aquatic environments. It plays a fundamental role in the kinetics of physico-chemical and biological reactions and the value of equilibrium constants. In addition, a temperature above 15°C promotes the development of microorganisms, intensifies the biodegradation of organic matter [14]. Dissolved oxygen is too important as parameter in assessing the health status of a lake. It depends mainly on the (breathing) respiration of the planktonic populations’ photosynthesis and the mineralization of biomass [15]. Nitrate (NO3-), nitrite (NO2-) and ammonium (NH4+) are the inorganic nitrogen forms and current pollutants in both surface water and groundwater causing enormous health problems in humans and animals [16, 17]. These different physico-chemical descriptors were determined by kpidi et al. [18]. The modeling was done using the multilinear and least square regression method implemented in Excel spreadsheets [19] and XLSTAT version 2014 [20].
2.3. Estimation of the Predictive Capacity of a Model
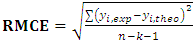
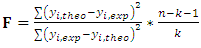
- The transparency of the thirty (30) samples of our study shows a variation ranging from 1.75 m to 3.50 m. Thus, this range of reduced variation in concentrations allows to define a better quantitative relationship between the transparency and the physico-chemical descriptors of taken samples. The quality of a model is determined by basing ourselves on various statistical analysis indicators such as the coefficient of determination R2, the standard error (RMCE), the correlation coefficients of the cross-validation Q2cv and Fischer’s one which is F. R2, RMCE and F relate to the adjustment of calculated and experimental values. They describe the predictive power within the limits of the model and allow to estimate the accuracy of the calculated values on the test set [21-23]. Concerning the cross-validation coefficient Q2cv, it gives information on the predictive power of the model, which can be "internal" because it is calculated from the structures which are used to build this model. The coefficient of determination R² gives an evaluation of the dispersion of the calculated values around the experimental ones. The quality of the modeling is better when the points evaluated by the coefficient R2 are closer to the adjustment line [24, 25]. R2 is expressed as follows:
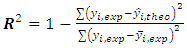 | (3) |
 Experimental value of transparency;
  Calculated value of transparency and
 Experimental mean value of transparencyThe closer the value of R² is to 1, the better the computed and experimental values are correlated. Moreover, the variance
  is determined by the relation 4 below:
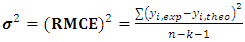 | (4) |
 | (5) |
 | (6) |
 which permits to evaluate the accuracy of the prediction on the test set is defined by the following relation:
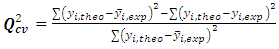 | (7) |
2.4. Statistical Analyzes
- Principal Component Analysis (PCA) is a data analysis tool that allows to explain the structure of correlations or covariances using linear combinations of original data. Its use makes it possible to interpret the data in a reduced space [26, 27]. It was used to appreciate, certainly, the relations between the different measured variables, but especially to access their structure in order to be able to group them by zone. Grouping by zone thus meets the checked target of this approach, which is to correlate the classes of physico-chemical descriptors obtained at the sampling stations. The Ascending Hierarchical Classification (AHC) aims to partition a set of samples into homogeneous classes [28, 29]. It organizes samples according to a number of variables and modalities. It groups them too hierarchically on a dendrogram. It aggregates samples that have a similarity between them by using the measurement of the distance between samples in order to form classes. It is realized by using the data of individuals and variables. AHC allowed to establish a typology of the samples according to the temperature, turbidity, NO2-, NO3- and NH4+. The Multiple Linear Regression Statistical Technique (MLR) is used to study the relationship between a dependent variable (Property) and several independent variables (descriptors). This statistical method minimizes the differences between the actual and predicted values. It also allowed to select descriptors used as input parameters in Partial Least Squares (PLS) regression. The Partial Least Squares (PLS) regression analysis also improves the structure-property relationship in order to evaluate quantitatively the property. It is the most current tool for studying multidimensional data.MLR and PLS were generated from XLSTAT version 2014 [20] to predict transparency. The equations of the different models were evaluated by the coefficient R2, the mean squared error (RMCE), the Fischer test (F) and the cross correlation coefficient (Q2CV) [30, 31, 32].
2.5. Criterion of Acceptance of a Model
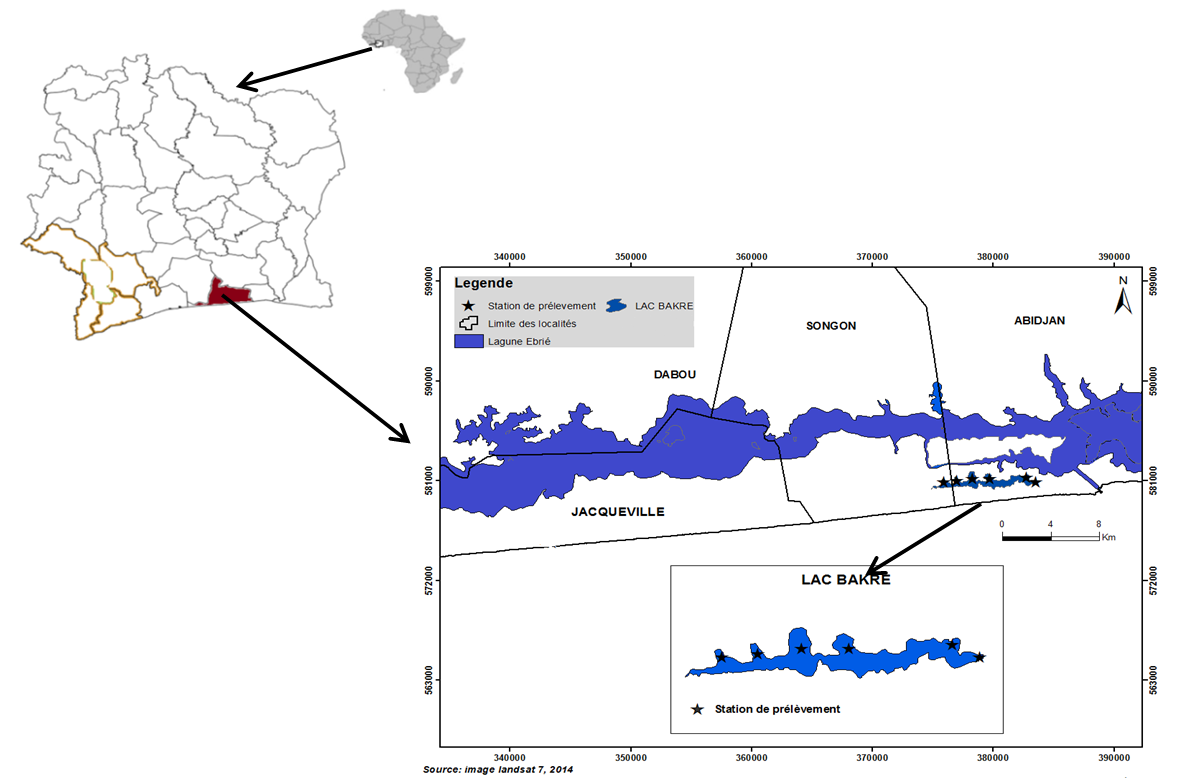
- The performance of a mathematical model, according to Eriksson et al. [33, 34], is characterized by a value of
 for a satisfactory model and an excellent one is characterized by,
  According to these authors, a test game, will be qualified to be an efficient model if the following acceptance criterion R2-Q2CV < 0,3 is respected.
3. Results and Discussion
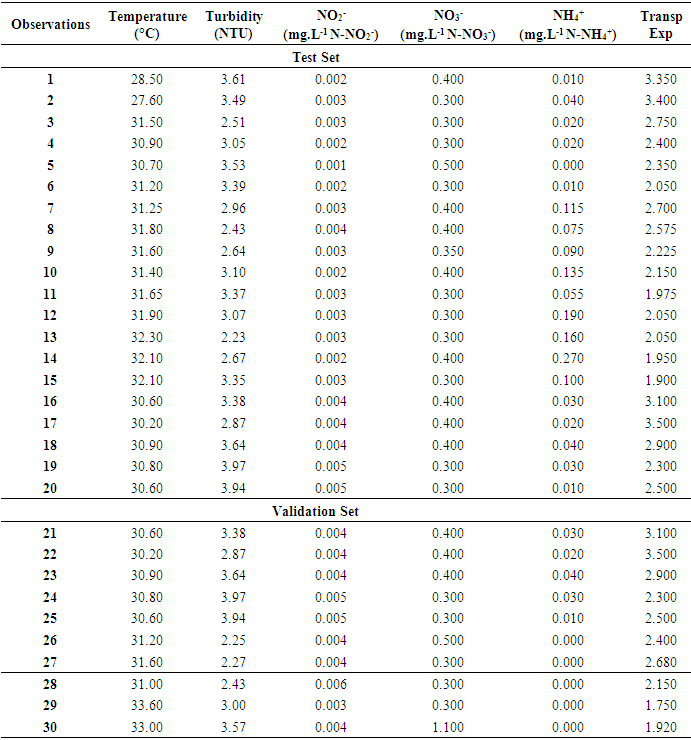
- The set of descriptor values for twenty (20) samples of the test set and ten (10) other samples of the validation set are presented in Table 1.
|
3.1. Typology of the Waters of Lake Bakré
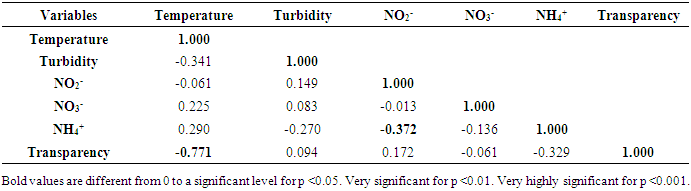
- The Pearson correlation matrix (n) (Table 2), the correlation circle (Figure 2), the Cartesian diagrams according to F1 and F2 (Figures 3 and 4) and the dendrogram of the stations are shown below.
|
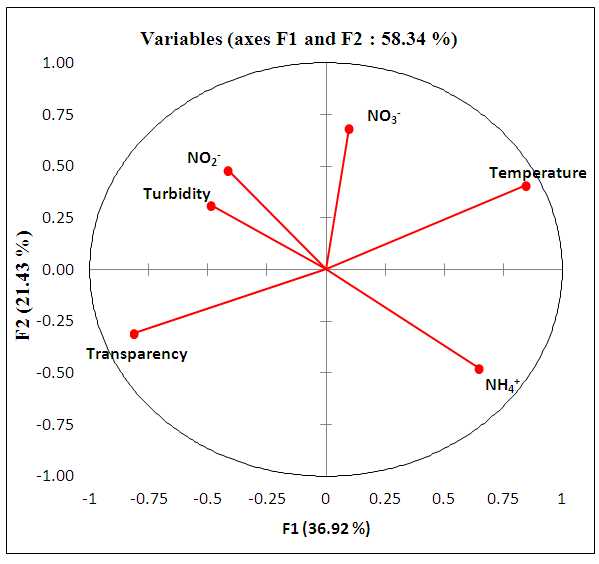 | Figure 2. Correlation circle of physico-chemical descriptors according to F1 x F2 |
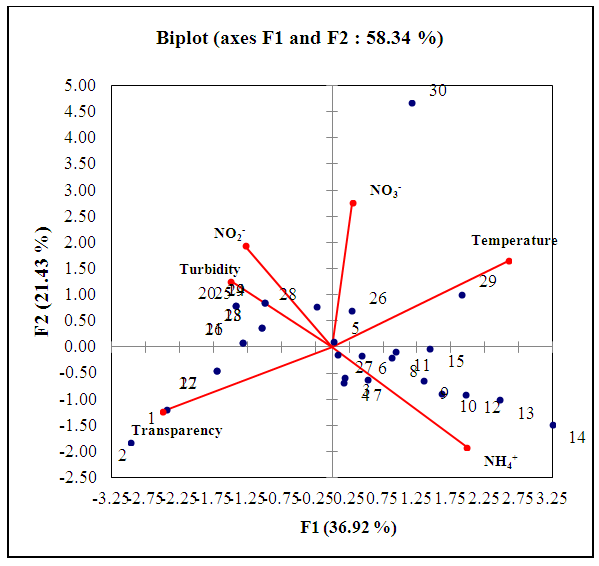 | Figure 3. Cartesian diagram according to F1 and F2: correlation between used descriptors and transparency |
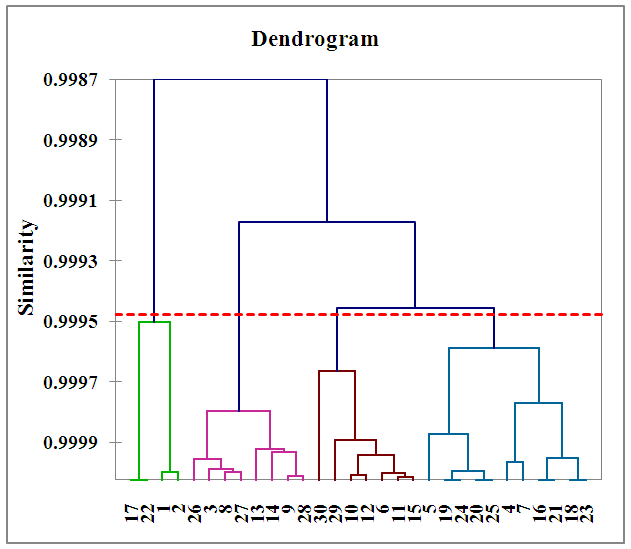 | Figure 4. Dendrograms of the samples |
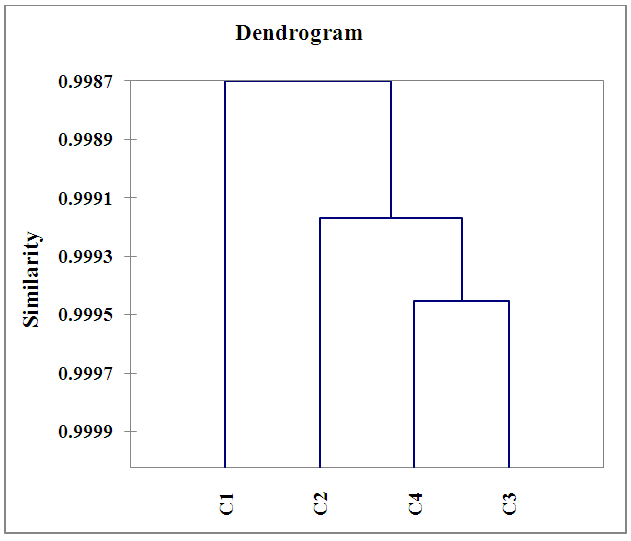 | Figure 5. Dendrograms of the groups |
3.2. Multilinear Regression (MLR) and Partial Least Squares (PLS) Models
- It should be noted that the negative or positive sign of the coefficient of a descriptor of the model reflects the effect of proportionality between the evolution of transparency and this physico-chemical parameter of the regression equation. Thus, the negative sign indicates that when the value of the descriptor is high, the transparency decreases while the positive sign reflects the opposite effect. Table 3 presents the best MLR and PLS models obtained for the different experimental values of transparency as well as the statistical indicators. Figures 6 and 7 show the adjustment line of the experimental and theoretical transparency data of the test sets (blue dots) and validation sets (red dots) of the model. It should be underlined that these models were established using the same test and validation sets of Table 1.Model MLR:
 Model PLS:
|

 The regression lines established by the experimental and theoretical test and validation set transparency data for the MLR and PLS models are shown in Figures 6 and 7.
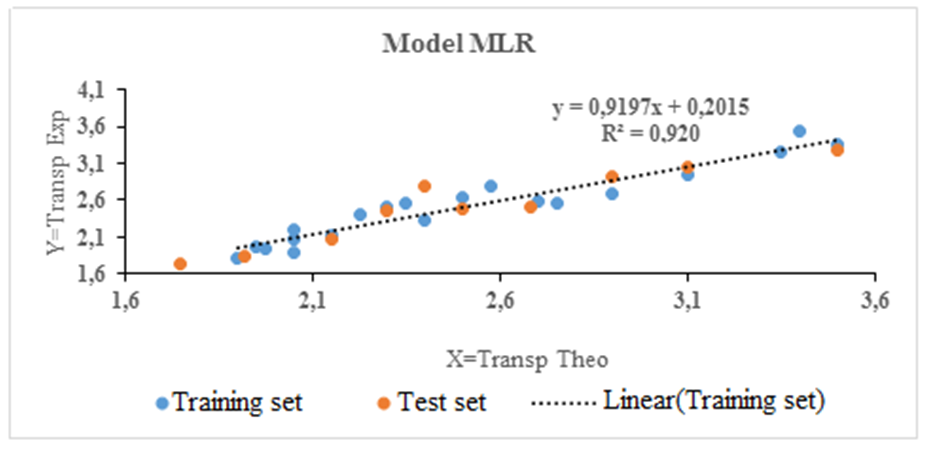 | Figure 6. Regression line of the MLR test and validation phases |
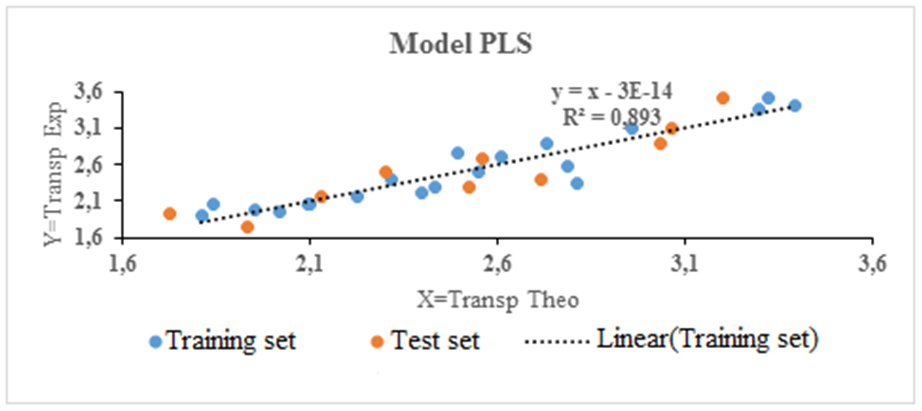 | Figure 7. Regression line of the PLS test and validation phases |
|
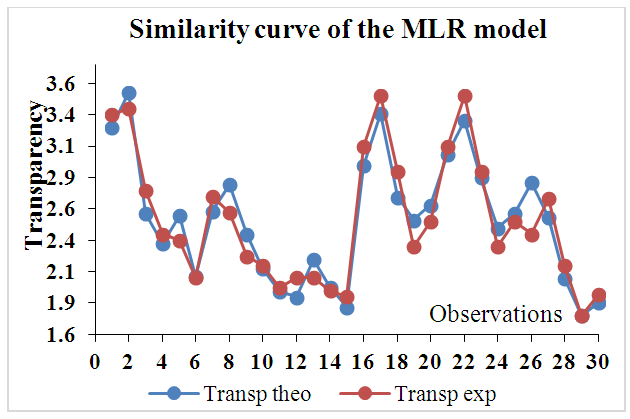 | Figure 8. Similarity curve of the experimental and predicted values of the MLR model |
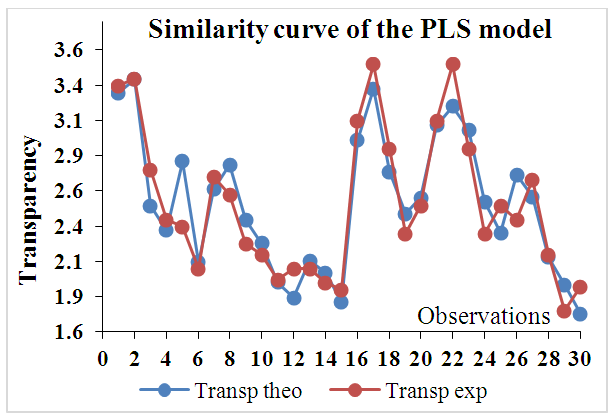 | Figure 9. Similarity curve of the experimental and predicted values of the PLS model |
3.3. Analysis of the Contribution of the Descriptors
- The contributions of the four physico-chemical descriptors in the prediction of the transparency of the sampled waters were illustrated by the normalized coefficients shown in Figure 10.
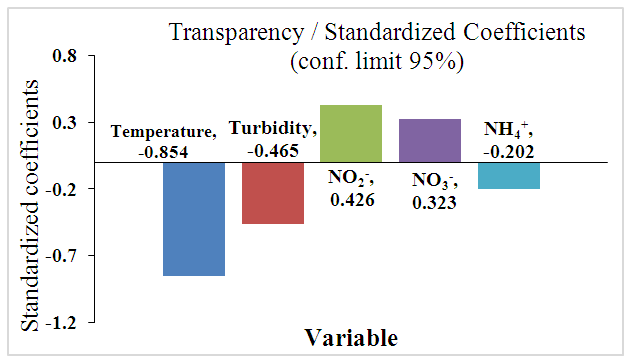 | Figure 10. Contribution of physico-chemical descriptors in models |
4. Conclusions
- This study has permitted to highlight relationships between transparency, which is a fundamental property of water to transmit light, and the measured physico-chemical descriptors of the samples. The physico-chemical descriptors (Temperature, turbidity, NO3-, NO2-, NH4+) allow to explain and predict the property of transparency because there are strong correlations between these calculated and experimental values. Multivariate analysis revealed 4 classes. Class C1 is characterized by the transparency of water expressing its ability to let the light pass through water. This parameter is inversely proportional to the temperature. Classes C2 and C4 are characterized by inorganic nitrogen pollution (NH4+) and finally class C3 is determined by turbidity. The study of the robustness of the two models (MLR and PLS) presented a good stability and an excellent power of prediction. In addition, the MLR model (R2= 0.920, RMCE = 0.169, F= 285.896) is better and is an effective tool for predicting transparency at Bakré Lake. Moreover, the study of the contribution of physico-chemical descriptors has shown that temperature is the most important one in terms of priority to predict the transparency of Lake Bakré.