-
Paper Information
- Next Paper
- Paper Submission
-
Journal Information
- About This Journal
- Editorial Board
- Current Issue
- Archive
- Author Guidelines
- Contact Us
Resources and Environment
p-ISSN: 2163-2618 e-ISSN: 2163-2634
2018; 8(3): 148-154
doi:10.5923/j.re.20180803.06

Analysis of Physico-Chemical Properties of Sumber Maron River in Malang, Indonesia during Dry Season
 Abstract
 Reference
 Full-Text PDF
 Full-text HTML
Faiza Tawati1, Yenny Risjani2, M. Sasmito Djati3, Bagio4, Amin Setyo Leksono4
1Doctorate Program of Environmental Science, Brawijaya University, Malang, Indonesia
2Faculty of Fisheries and Marine Science, Brawijaya University, Malang, Indonesia
3Department of Biology, Faculty of Science, Brawijaya University, Malang, Indonesia
4Department of Biology, Faculty of Mathematic and Natural Science, Brawijaya University, Malang, Indonesia
Correspondence to: Faiza Tawati, Doctorate Program of Environmental Science, Brawijaya University, Malang, Indonesia.
| Email: |  |
Copyright © 2018 The Author(s). Published by Scientific & Academic Publishing.
This work is licensed under the Creative Commons Attribution International License (CC BY).
http://creativecommons.org/licenses/by/4.0/

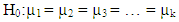
Changes in some chemical and physical properties of water are one of the causes of water pollution. These changes are also an indicator of water quality. The purpose of this study is to analyze water quality in the Sumber Maron river located in Kepanjen, Malang. Three sampling sites were selected spatially along the waterway from head stream (A), middle stream (B), and downstream (C) of the river as the sources of the water samples taken during the dry season. Using ANOVA and cluster analysis of the water quality, the physical and chemical properties of river water quality were analyzed from 11 water quality parameters: temperature, electrical conductivity, pH, total suspended solids, alkali, calcium, magnesium, sodium, dissolved oxygen, chemical oxygen demand, salinity and E. coli. The results indicated that COD and TDS are higher than the permissible limits in the Global Health Facility, while all the parameters of water quality are within the FAO standard for irrigation purposes. It indicates that the human activity in Sumber Maron has affected the water quality. Based on Indonesia government regulation No.82/2001, the water in Sumber Maron river was still suitable for irrigation and tourism (class II), except the levels of TDS and COD.
Keywords: Sumber Maron, Water quality, Parameters, Water pollution, Physic-chemical properties
Cite this paper: Faiza Tawati, Yenny Risjani, M. Sasmito Djati, Bagio, Amin Setyo Leksono, Analysis of Physico-Chemical Properties of Sumber Maron River in Malang, Indonesia during Dry Season, Resources and Environment, Vol. 8 No. 3, 2018, pp. 148-154. doi: 10.5923/j.re.20180803.06.
Article Outline
1. Introduction
- Water quality parameters are important for the survival of aquatic plants and animals. Some important physical and chemical factors affecting the aquatic environment are temperature, precipitation, pH, conductivity, salinity and dissolved oxygen. Others are phosphates, nitrates, chlorides, turbidity, transparency, other dissolved gases, and water depth. Temperature can be defined as the degree of heat or coldness in the body of organisms whether in water or on earth (Kutty, 1987). It is very important in water, because it detects larval life and metabolic rate of aquatic organisms. The concentration of dissolved gases and their solubility in water also depends on the prevailing air temperature. (Largler et al., 1977).Water quality provides up-to-date information about the Physical and chemical parameters for water provide a basis for assessing water suitability for specific uses and for improving existing conditions. There is no single measure of water quality where water quality can be tested with many properties and many natural substances and contaminants. Increasing anthropogenic activity due to industrial profiling has contributed to the deterioration of water quality, including climate, precipitation, soil type and vegetation cover.The water quality of rivers and lakes changes with seasons and geographical areas, even when there is no pollution (Chitmanat and Traichaiyaporn, 2010). The deterioration of water quality has led to the destruction of ecosystem balance, contamination and contamination of soil and surface water sources Degradation of water quality worldwide is caused by many anthropogenic activities that release pollutants into the environment so that they have adverse effects on aquatic ecosystems. Water quality can be regarded as a variable network such as pH, oxygen concentration, temperature, etc. and any changes in these physical and chemical variables can affet aquatic biota in various ways (Kolawole et al., 2011). Since water quality is directly related to health and important for the determination of water utilities, it is very important and important to test water quality before being used for drinking, domestic, agricultural or industrial purposes. The use of river water for various purposes is governed by physicochemical and biological qualities of water (Singh et al., 2013).Rivers are the most important freshwater source for humans. The social, economic and political developments, in the past, were largely related to the availability and distribution of fresh water contained in river systems. The use of main river water can be summarized as follows: drinking water supply sources, irrigation of agricultural land, industrial and municipal water supply, industrial and municipal waste disposal, navigation, fishery, recreational boating and body recreation (Jutting WSS, 1956).Kepanjen is a sub-district which is also the administrative center of Malang Regency, East Java Province, Indonesia since 2008. Kepanjen sub district is located 20 km south of Malang City. It is an agricultural and rural area where there are many rice fields, water ponds and the location of Sumber Maron river. Sumber Maron river is an area that attracts tourists and visitors. This is one of ecotourism located in the south of Malang where there are animals and natural plants. As Indonesia lies on the equator, Sumber Maron has a tropical climate characterized by heavy rain, high humidity, and high temperatures. The rainy season is from October to March, while the dry season is from April to September. Rainfall ranges from one year to an average of 180-320cm (70-125) in lowland areas, while rising to an average height of 610 cm (240) in some mountainous areas. This makes irrigation using the Sumber Maron river as an alternative option for the region. Thus, Sumber Maron river is widely used for domestic purposes, recreation, drinking and irrigation in the area. To the river, different municipal waste is thrown away, cars are washed, most children use it to bathe and drink from the river. Therefore, continuous monitoring of pollutant loads in this river water is necessary to protect public health from the dangerous use of this water. Therefore, this study aims to focus on the quality of chemical physiology of the Sumber Maron river water and the effects of pollutants during the dry season, providing recommendations for promoting sustainable water use (Faiza et al., 2018).
2. Materials and Methods
2.1. Description of the Study Area
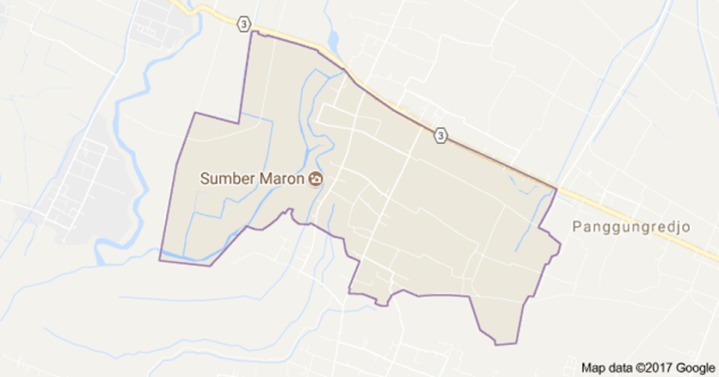
- The study was carried out in Sumber Maron River one of tourism objects with a clear source of water and small waterfall as its main attraction located in Kepanjen, Malang Indonesia. Local people used the area around Sumber Maron as a cultivation area of paddy plants, bathing and washing place, a tourist attraction. The 18 sampling points of the study area were randomly selected using GPS (global positioning systems) of three places including Site A (near the source), Site B (near the bridge construction), and Site C (the place of the big rock). Each site was divided into three areas, consisting of A1, A2, A3, B1, B2, B3, C1, C2, and C3 as the location to take the water samples (Faiza et al., 2018). In this study, the quality of Sumber Maron river water including chemical and physical properties was analysed (APHA, 1998).
 | Figure 1 |
2.2. Sample Collection
- The study area was determined through the first visit of the river Sumber Maron and taking a section of the river whose length was determined by Google Map by the researcher and the supervisor of the study. The samples were obtained from three different places of the river section: the location (A), the beginning of the river, the location (B) (which is almost the middle of the river), the location (C) and it is close to the end of the river. Determination of water and sediment quality including physical and chemical properties was conducted in the laboratory of the Jasa Tirta Malang and the laboratory of the Department of Biology, Brawijaya University. In this study, random sampling of water and sediment was taken from all locations. This study was conducted in rainy season. The water and sediment samples from Sumber Maron river were collected for this study following standard procedure as described by APHA (1998). A sample of the dry season was taken in August 2017.
2.3. Data Analysis
- The water quality parameters were analyzed using standard analytical methods (APHA, 1998; Sinha and Biswas, 2011). Parameters consisting of water temperature, electrical conductivity, pH, total solids, total suspended solids, total solids and alkali, calcium, magnesium, sodium, dissolved oxygen, chemical oxygen demand and salinity samples were analyzed in the laboratory (APHA, 1998). Standard laboratory methods for analyzing chemical oxygen demand were following APHA (1998), while the examination of water samples employed for the analyzing total solids, total suspended solids, total dissolved solids, calcium, and magnesium was determined using TAHP. All chemicals used were of high purity and analytical grade. Fresh reagents were used and great care was taken to avoid chemical contamination.
2.4. Statistical Analysis
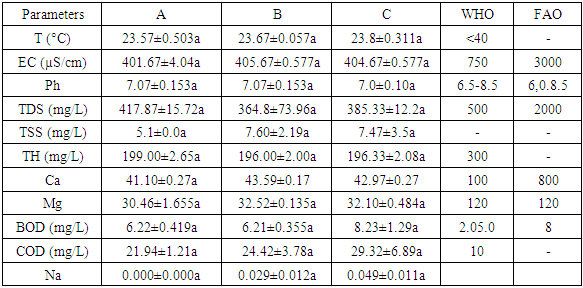
- All the laboratory results of the parameters were analysed by using ANOVA analysis of variance to determine whether there were any statistically significant differences between the means of three or more independent (unrelated) groups. Specifically, it tests the null hypothesis:
 | (1) |
2.5. Physico-Chemical Parameters
- It is very important to test the water before it is used for drinking, or for domestic, agricultural or in-dustrial purposes. Water must be tested with different physical chemical parameters. The selection of parameters for water testing depends only on the purpose we will use for that water, while chemical tests should be performed for BOD, COD, dissolved oxygen, alkali and other analysis. For more high quality water and purity. It is clear that drinking water must pass these tests in its entirety and must contain the required quantity of the allowable level.
3. Results and Discussion
3.1. Temperature
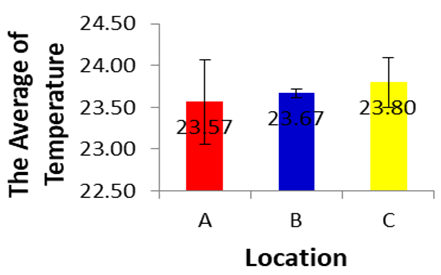
- Naturally water bodies show changes in temperature daily and seasonally due to different activities that can contribute to changes in surface water temperature. Water temperatures were obtained during the sampling collection period for all sites. Generally, the river temperature varies from 0.714 (p>0.05), and it can be concluded that there are no differences in temperature in each location during dry season. In addition, it describes the natural state of the surrounding environmental (Loomer and Cooke, 2003). Heat is primarily important for its effects on some chemical and biological reactions occurring in water and aquatic organisms (Saksena and Garg, 2008). There is a swift of the temperature along with the changing of the sampling time. The sampling time was August 2017. The changing may be due to different weather, humidity and exposure to sunlight from the first sampling, as well as the effect of bright weather on the temperature. Government regulations (GR) No. 82/2001 (Class II), water temperatures in three stations still meet national quality standards.
 | Figure 2 |
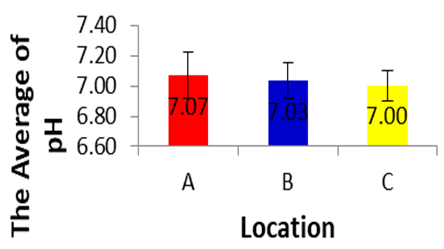
3.2. PH
- pH values vary from a minimum of 7.0±0.10 in the site c and a maximum of 7.07±0.153 in the site A. These values are within the permissible limit of WHO and FAO set for drinking and irrigation purposes (Fatoki and Muyima, 2001). Based on the results of analysis of variance for pH in each location during dry season, showed a significance value of 0.813 (p>0.05), and it can be concluded that there are no differences in pH in each location during dry season.
 | Figure 3 |
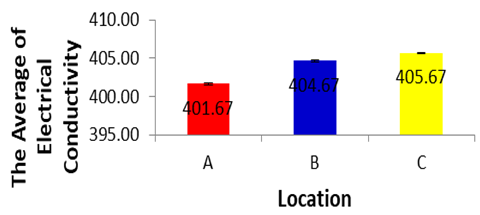
3.3. Electrical Conductivity (EC)
- Conductivity shows significant correlation with ten parameters such as temperature, pH value, alkalinity, total hardness, calcium, total solids, total dissolved solids, chemical oxygen demand, chloride and iron concentration of water. (Navneet Kumar et al., 2010) suggested that the underground drinking water quality of study area can be checked effectively by controlling conductivity of water and this may also be applied to water quality management of other study areas. It is measured with the help of EC meter which measures the resistance offered by the water between two platinized electrodes. The instrument is standardized with known values of conductance observed with standard KCl solution. The values of electrical conductivity vary in the three sites and fall within the criteria set by the World Health Organization for drinking purposes and below the limit set by FAO for irrigation, from 401.67±4.04 in the site A and 404.67±0.577 in the site B and 405.67±0.577 in the site C indicating a high amount of dissolved inorganic substances in their ionizing form (Senila and Levei, 2007).Other studies have also shown that the values of EC are in the range of 225 to 3350 μm / cm (Akkaraboyina and Raju, 2012), and 2130 μS/cm (Aisien, 2003), which is similar to our findings from the Sumber Maron river ranging from 243 to 270. The Electrical Conductivity during dry season Based on the results of analysis of variance for Electrical Conductivity in each location during dry season, showed a significance value of 0.182 (p>0.05), and it can be concluded that there are no differences in Electrical Conductivity in each location during dry season (Senila and Levei E, 2007).
 | Figure 4 |
3.4. Oxygen Demand (BOD)
- DO is one of the most important parameter. Its correlation with water body gives direct and indirect information e.g. bacterial activity, photosynthesis, availability of nutrients, stratification etc. (Premlata, 2009). The high DO in dry season is due to duration of bright sunlight has influence on the % of soluble gases (O² & CO²). During dry season the long days and intense sunlight seem to accelerate photosynthesis by phytoplankton, utilizing CO2 and giving off oxygen. This possibly accounts for the greater qualities of O2 recorded during dry season (Krishnamurthy R, 1990). Based on the results of analysis of variance for Electrical Conductivity in each location during dry season, showed a significance value of 0.182 (p>0.05), it can be concluded that there are no differences in electrical conductivity in each location during dry season.
 | Figure 5 |
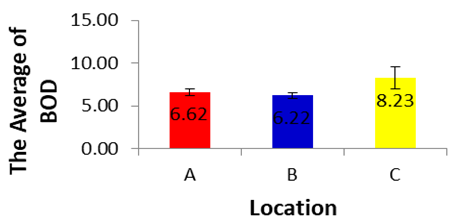
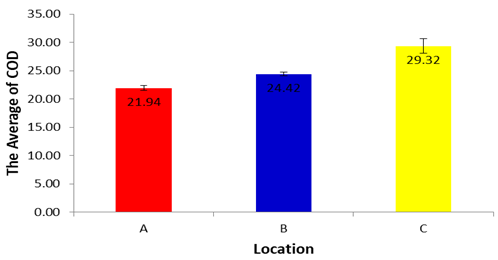
3.5. Biochemical and Chemical Oxygen Demand (BOD and COD)
- BOD which is sensitive for organic pollution ranges from 6.22±0.419 in the site A to 6.21±0.355 in the site B and 8.23±1.29 mg/L for SumberMaron River water. This is within the recommended values of (Said, Stevens, and Sehlke, 2004], and FAO (Fatoki, Muyima, and Lujiza, 2001). The results of analysis of variance for BOD in each location during dry season showed a significance value of 0.821 (p>0.05) and it can be concluded that there are no differences in BOD in each location during dry season.COD is related to organic and inorganic pollutants which cause unfavorable conditions for the growth of microorganisms. The permissible limit is 10 mg/L. Average COD concentration for Sumber Maron river water ranges from 21.94±1.21 to 24.42±3.78 mg/L, higher than the value found by Said, Stevens, and Sehlke, 2004). This condition may be caused by the presence of chemicals such as oxygen demand in nature coming from washing of different vehicles and surface runoff. Similar kind of studies conducted in rivers like Cauvery and Arasalar in India also reported COD value in the range of 25 to 68 and 32.34 to 57.56 mg/L, respectively (Bai, Bouwmeester, and Mohan, 2009). The COD during dry season in location A, B and C did not differ significantly for one each other (p>0.05).
 | Figure 6 |
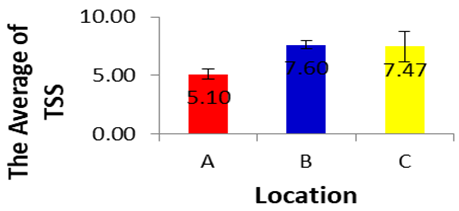
3.6. Total Suspended Solids (TSS)
- The total suspended water content depends on the amount of suspended particles, soil and silt directly associated with water turbidity. The present study shows that the mean TSS value varies from 5.1 ± 1 to 273.33 ± 3.63. These values are due to surface runoff and disposal of domestic waste water. Based on the results of analysis of variance for TSS in each location during dry season, showed a significance value of 0.409 (p<0.05), it can be concluded that there are differences in TSS in each location during dry season. The TSS during dry season in location A, B and C did not differ significantly for one each other (p>0.05). Based on the average of the TSS in each location during dry season can be established sequence of the lowest up to an average of the highest TSS, as follows. 5.1±0.0, 7.47±3.5, 7.60±2.19. Most of the physico- chemical parameters are determined by standard methods prescribed by ASTM and APHA.
 | Figure 7 |
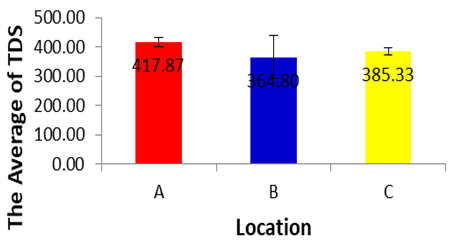
3.7. Total Dissolved Solids (TDS)
- Based on the results of analysis of variance for TDS in each location during dry season, The TDS during dry season in location A, B and C did not differ significantly for one each other (p>0.05) Based on the average of the TDS in each location during dry season can be established sequence of the lowest up to an average of the highest TDS, as fo lows.364.8±73.96 location (B), 385.33±12.2 (C), 417.87±15.72(A). It can be concluded that there are no differences in TDS in each location during dry season, and exceed the maximum permissible, limits of WHO for the drinking purpose and lower than the limit given by FAO for irrigation water (Ayers and Westcot, 1994; WHO, 2008). Higher TDS can be toxic to aquatic life through increases in salinity or changes in the composition of the water. Primary sources for higher TDS in the river water might be due to agricultural runoff, discharge of domestic waste from the town and other human activities like washing of different vehicle at and around the river (Annalakshmi and Amsath, 2012). Jayalakshmi et al. (2011) also reported similar TDS values (221 to 3534 mg/L) for river water.
 | Figure 8 |
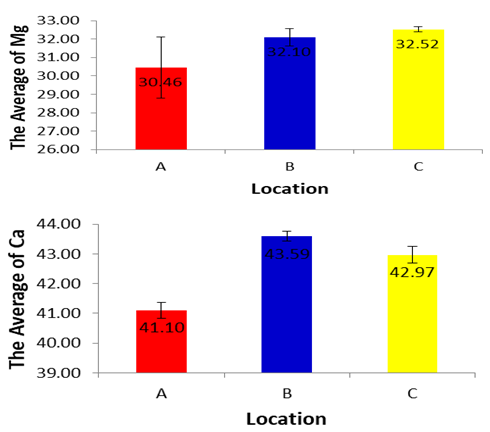
3.8. Calcium and Magnesium
- It is measured by complexometric titration with standard solution of ETDA using Patton’s and Reeder’s indicator under the pH conditions of more than 12.0. These conditions are achieved by adding a fixed volume of 4N Sodium Hydroxide. The volume of titre (EDTA solution) against the known volume of sample gives the concentration of calcium in the sample. It is also measured by complexometric titration with standard solution of EDTA using Eriochrome black T as indicator under the buffer conditions of pH 10.0. The buffer solution is made from Ammonium Chloride and Ammonium Hydroxide. The solution resists the pH variations during titration.
 | Figure 9 |
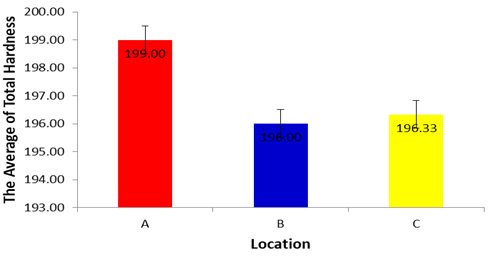
3.9. Total Hardness
- Based on the results of analysis of variance for Total Hardness in each location during dry season, showed a significance value of 0.280 (p>0.05), it can be concluded that there are no differences in Total Hardness in each location during dry season. The Total Hardness during dry season in location A, B and C did not differ significantly for one each other (p>0.05). Based on the average of the Total Hardness in each location during dry season can be established sequence of the lowest up to an average of the highest Total Hardness the result is shown as follows: 196.00±2.00 in location (B), 196.33±2.08 (C), 199.00±2.65 (A). Based on hardness, water classified into three different categories: soft water (0 to 75 mg/L), moderately hard water (76 to 150 mg/L) and hard water (151 to 300 mg/L) (Soni et al., 1013). Accordingly, muron River categorized as hard water. The recorded values for TH for all studied sites, are higher than the permissible limit of WHO (2008). Higher TH values are mainly due to weathering of Ca and Mg-rich rocks in the area (Zeitoun and Mehana, 2014). This is related to the dominant limestone rock in the area which occupies the elevation in the topography. The data indicate that the muron River water is unsuitable for drinking purposes. Other studies related to river water also indicated higher (Murhekar, 2011).
 | Figure 10 |
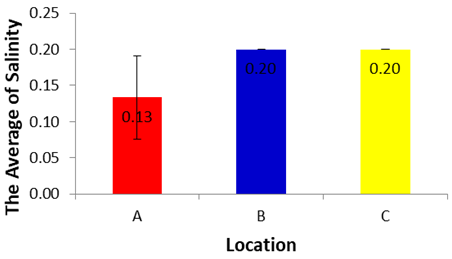
3.10. Salinity
- Based on the results of analysis of variance for Salinity in each location during dry season, showed a significance value of 0.079 (p>0.05), it can be concluded that there are no differences in Salinity in each location during dry season. The Salinity during dry season in location A, B and C did not differ significantly for one each other (p>0.05).Based on the average of the Salinity in each location during dry season can be established sequence of the lowest up to an average of the highest salinity, as follows: 0.13±0.06 (A), 0.20±0.00 (B), and 0.20±0.00 (C).
 | Figure 11 |
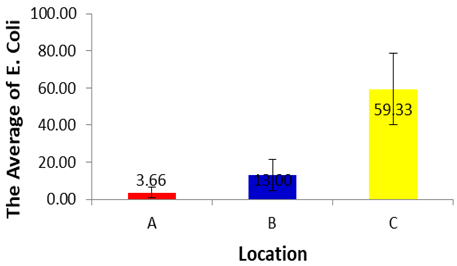
3.11. E. Coli
- The E. Coli during dry season in location A have different significantly with E. Coli in location C (p<0.05), but did not different significantly with E. Coli in location B (p>0.05). Then the test results comparing multiple (Tukey 's Test) in each treatment showed that the E. Coli in location B have different significantly with E. Coli in location C (p<0.05), but did not different significantly with E. Coli in location A (p>0.05). Based on the average of the E. Coli in each location during dry season can be established sequence of the lowest up to an average of the highest E. Coli, as follows. (A) 3.66±2.89, (B) 13.00±8.54 and (C) 59.33±29.26.
 | Figure 12 |
4. Conclusions
- Physico chemical parameter study is very important to get exact idea about the quality of water and we can compare results of different physico chemical parameter values with standard values. (Aftab Begum et al. 2005) A water quality analysis has been carried out at Sumber Maron river on the basis of selective water quality criteria relevant to reference to the appropriateness of water for drinking and agriculture. The current analysis concludes that most of the concentrations of the physical and chemical parameters studied in the Sumber Maron river waters were in the recommended drinking water and irrigation parameters. The physical and chemical water quality standards obtained in the study differ from those permitted by the World Health Organization (WHO) standards for drinking water, but are within the limits of FAO (Aires and Westcott, 1994) for irrigation purposes. The height of the TDS code, as observed in the study, is often associated with diseases that may infect microorganisms such as bacteria and other parasites. These increased values also indicate some contaminants that the river water will be unsafe for domestic and swimming purposes, and the ANOVA test also showed statistically significant differences between the different sampling sites that may be attributed to various factors such as precipitation and changes in human activities that led to river loading with different contaminants during the sampling and analysis period. Thus, the study indicated that the entire river is generally contaminated, posing a major threat to aquatic life and the river and the people who use it for domestic and other activities. This may be due to improper disposal of wastewater, surface, agricultural runoff and wastewater from various local activities. Thus, water is not potable for domestic purposes and tourism without some forms of physical and chemical treatment while it is useful for agricultural purposes. It is therefore recommended that the effective management of the Sumber Maron river is required to reduce some of the problems associated with human health. There is also an urgent need for public awareness of the state of water and the application of relevant legal laws with regard to the proper handling of industrial and household discharge before entering the river course.
ACKNOWLEDGEMENTS
- This study was conducted in the rainy season (August 2017), water samples were analyzed by the use of the research laboratory at Water Company Jasa Tirta Malang and thus all resources used are acknowledged. It is pleased and thank you to my first supervisor, Prof. Yenny Risjani, Brawijaya University for her kind help in sample preparation and M. Sasmito Djati, Dr. Bagio and Dr. Amin Setyo Leksono from Brawijaya University for their kind help in guiding this research steps and drawing the map of study area.