-
Paper Information
- Next Paper
- Previous Paper
- Paper Submission
-
Journal Information
- About This Journal
- Editorial Board
- Current Issue
- Archive
- Author Guidelines
- Contact Us
Resources and Environment
p-ISSN: 2163-2618 e-ISSN: 2163-2634
2018; 8(3): 103-126
doi:10.5923/j.re.20180803.03

Geospatial Analysis of Morphometric Characteristics of River Hawul Basin, North-East Nigeria
 Abstract
 Reference
 Full-Text PDF
 Full-text HTML
Ikusemoran Mayomi, Manu H. Yelwa, Abdussalam B.
Department of Geography, University of Maiduguri, Nigeria
Correspondence to: Ikusemoran Mayomi, Department of Geography, University of Maiduguri, Nigeria.
| Email: |  |
Copyright © 2018 The Author(s). Published by Scientific & Academic Publishing.
This work is licensed under the Creative Commons Attribution International License (CC BY).
http://creativecommons.org/licenses/by/4.0/

Hawul Basin is one of the prominent river basins in north eastern part of Nigeria. In this paper, quantitative techniques which solely involved the use of formula and geospatial techniques (GIS applications) were used to examine the morphometric characteristics (linear, aerial and relief) of the basin. Various formula were adopted to obtain some of the major morphometric characteristics of the basin especially the linear parameters like stream order, stream number, stream length, stream length ratio, bifurcation ratio among others. Geospatial techniques was also used to map out and calculate the distance and areas of the following: relief, drainage, stream order, slope, relative and absolute relief, aspect, ruggedness index, drainage density, stream density and the longitudinal profiles of some selected years of the main river valley. It was revealed in this paper that Hawul Basin is located mainly within the River Gongola plains covering a total land area of 11617.26 km2, out of which 4816.79 km2 (41.46%) lies in Adamawa State and 6726.37 km2 (57.91%) in Borno State and the remaining 74.06 km2 (0.63%) in Yobe State. The major findings of the morphometric characteristics of the basin include: Hawul Basin has high groundwater recharge, low storage capacity and hence, low possibility of flood occurrence. The basin was found to be more of oval than circular or elongated in shape. The basin was also found to be in the early stage of its erosion circle. The basin could also be considered as a region of permeable subsoil material under dense vegetative cover with low relief. Six out of the nine soil types, covering a total land area of 80.45% of the basin were found to be highly permeable. The slope of the basin is gentle with low density of drainage network. The basin has dendritic drainage pattern. It was recommended that two riparian states should harness the potentials of the basin and there should be proper landuse planning and management within the basin in order to maintain and sustain the current environmental conditions of the basin.
Keywords: Drainage Basin, Hawul Basin, Geospatial, Morphometric Characteristics
Cite this paper: Ikusemoran Mayomi, Manu H. Yelwa, Abdussalam B., Geospatial Analysis of Morphometric Characteristics of River Hawul Basin, North-East Nigeria, Resources and Environment, Vol. 8 No. 3, 2018, pp. 103-126. doi: 10.5923/j.re.20180803.03.
Article Outline
1. Introduction
- A watershed, also called a drainage basin or catchment area, is defined as an area in which all water flowing into it goes to a common outlet drains down slope, along drainage to a common lowest point or basin [1]. The drainage basin acts as a funnel by collecting all the water within the area covered by the basin and channeling it to a single point [2]. According to [3], the need for a comprehensive study of drainage basin characteristics is necessitated by the spatio- temporal variation exhibited by the geometric attributes of the basin. Moreover, the study of the hydrological and morphometric characteristics of a drainage basin helps in the analysis of the general hydrological processes of the basin; examine flood vulnerability areas, study river regime, soil erosion and deposition, vegetation cover and changes, groundwater and water conservation among others. River Hawul basin is one of the most important River basins in north east Nigeria. It is a relatively large River Basin occupying some parts of the land area of Adamawa and Borno States. In Adamawa State, the basin occupies the north western part sharing border with the main Benue Basin. In Borno State, apart from the Lake Chad Basin, Hawul and Yedzeram Basins are the other River Basins in the State. In spite the strategic location of this large basin, not much has been done by the two riparian states to properly harness the potentials of the River Basin either for agricultural or other purposes [4]. The need to study the Hawul River basin becomes necessary in order to assess not only the morphometric characteristics but also the size of the basin, the size of the suitable areas for human use as well as the proportions of these sizes in each state and in each LGA. Initially, analysis of morphometric characteristics of drainage basin was based on mere description using fieldwork data, the authenticity of the information derived from such data depends on the expertise and experience of the analyst. The search for more reliable methods lead to the use of quantitative techniques which were considered better than the mere description as reported by) [5], that quantification of the morphometric parameters of a drainage basin has proved to be of immense benefit in river basin evaluation, watershed prioritization for soil and water conservation, and in the management of natural resources at the watershed level [6]. Studies involving the quantitative analysis of drainage basin geometry show that the geometric analysis of drainage basins has found utility in the realm of flood peak prediction, estimation of erosion rates, sediment yield assessment, river catchment evaluation and development studies, landslide susceptibility assessment, and watershed prioritization for soil and water conservation [7], amongst others. Today, remotely sensed data and GIS techniques have been widely used in the analysis of morphometric characteristics of drainage basins. Before the advent of Remote Sensing and GIS technology, when basins were merely described, the studies were often carried out manually with equipments that are prone to errors, coupled with inadequate skilled manpower, inability to cover large areas, time, labour and energy consumption among others. All these factors make the results of such studies to be limited in scope and hence, subject to errors and inaccuracy. The use of remotely sensed data and GIS techniques have eased the study of the hydrological and morphormetric parameters of drainage basin with large area coverage and high accuracy and reliability of generated data and information. In this paper, both geospatial and quantitative techniques were used to assess the morphometric characteristics of Hawul Basin in order to harness the advantages of the two methods in the analysis of the basin. Therefore, the main objectives of this paper are:(i) To delineate and analyze the location and size of the basin in the two riparian states.(ii) To examine the linear, aerial and the relief characteristics of the basin.(iii) To relate the morphometric characteristics of the basin to probable environmental hazards like floods, soil erosion among others.
2. Study Area
- River Hawul is one of the major tributaries to River Gongola which in turn, a tributary to River Benue. It forms a natural boundary between Adamawa State in the North West and Borno State in the South West. It is also a boundary between Shani LGA in Borno State and Guyuk/Shelleng LGAs in Adamawa State. Other LGAs with Hawul River as boundary include; Hawul LGA in Borno State and Shelleng/Gombi/ in Adamawa State, Askira Uba LGA in Borno State and Hong LGA in Adamawa State (Fig.1).
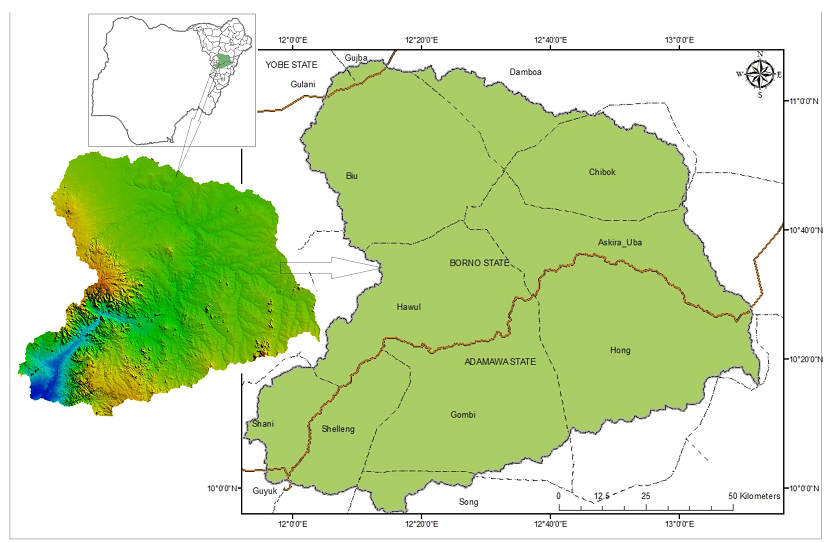 | Figure 1. The Study Area |
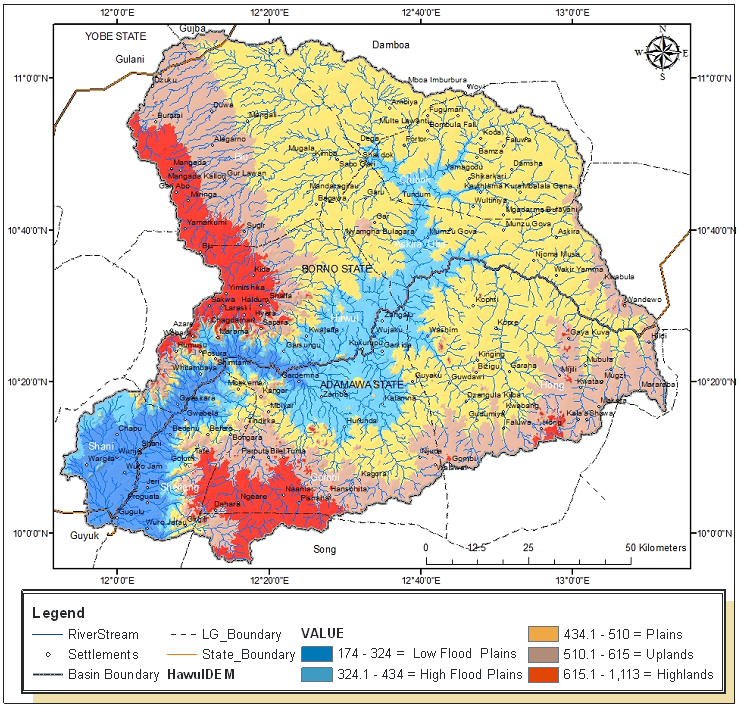 | Figure 2. The Relief and Drainage of Hawul Basin |
|
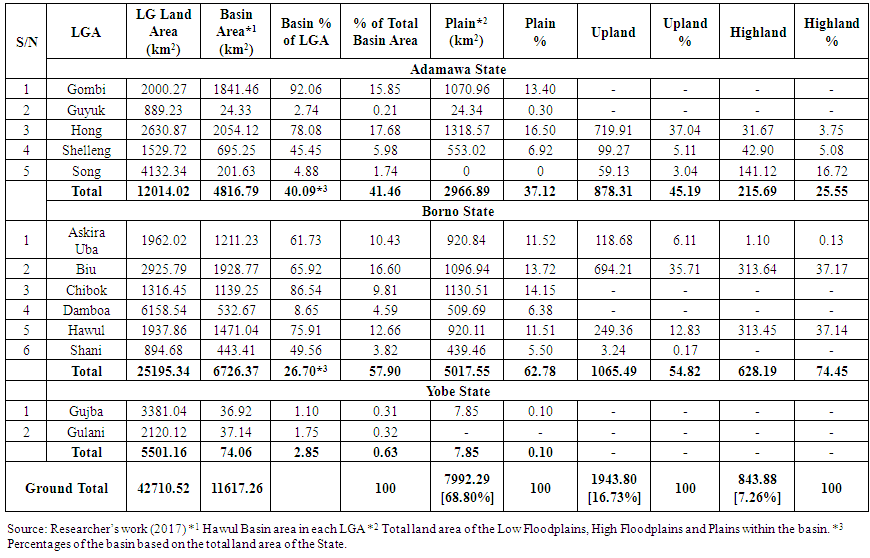 | Table 2. Hawul Basin land area in each riparian States and LGAs |
3. Materials and Methods
- The materials that were acquired for this paper include GIS software such as ArcGIS 10.2, and Global Mapper V 13.2. ASTERDEM data of Hawul basin was obtained online and from which the DEM, contours, elevation and the main rivers and streams were delineated, Topographical map from which names of rivers, settlements, and other features of interest were obtained. Global Positioning System (Germin 76) was also used to obtain the coordinates of the villages and other points of interest.MethodsIn this paper, quantitative and geospatial techniques were implored to analyze the mophormetric characteristics of Hawul basin. In quantitative technique, each of the characteristics of the basin was assessed based on the formula as shown in Table. 3. The following steps were undertaken in the geospatial aspect.(i) Acquisition of DEM Map: The Digital Elevation Model (DEM) of the basin was acquired online using the ASTERDEM data. ASTERDEM was used because of its high spatial resolution of 15m.(ii) Basin Extraction: The actual land area of the basin was extracted from the DEM map using the basin extraction tool of ArcGIS which gives accurate size and shape of the basin.(iii) Classification of the Extracted Basin: The DEM map of the basin was classified into five: low floodplains, high floodplains, plains, upland and highland areas so as to examine the topography of the basin.(iv) Acquisition of Rivers and Streams: All the Rivers and streams in the basin were obtained using the flow accumulation module of ArcGIS. All the lines in the flow accumulation were converted to polyline as rivers or streams based on the width of the flow lines. In fact, no single river or stream was digitized in this paper (they were only converted) which maintains high positional accuracy of all the rivers and streams.(v) Calculation of Area, Length, Distances etc: All the area and linear attributes such as areas, lengths, distances, perimeters among others were calculated using the appropriate module of ArcGIS.(vi) Slopes and Stream Order: The slope was generated from the ASTERDEM data using the slope creation module of the ARCGIS. The Straller’s stream ordering method was used in this paper. The stream order was generated using the stream ordering module of ArcGIS.(vii) River Profile: Google Pro software was used to generate longitudinal profile of the 6th Order stream of River Hawul of ten year period from 1985 to 2015, that is, 1985, 1995, 2005 and 2015. The profile was taken from the beginning of the 6th order stream in Chibok LGA (Fig.3) to the point where it empties its water into River Gongola in Shani LGA.(viii) Geospatial techniques were used to generate digital maps and area calculations of relief and absolute relief, basin slope, ruggedness index, drainage density, sub-basin, stream density, basin aspect, stream frequency and the longitudinal profiles of the basin.(ix) The soil map of the basin was extracted and digitized from the dominant soil map of Nigeria. The identified soil types on the basin were digitized while the area of each soil type was also calculated in ArcGIS environment.(x) The coordinates of One hundred and thirty eight (138) villages were obtained and added to the terrain and soils digital maps so as to assess the villages that fall in each unit.
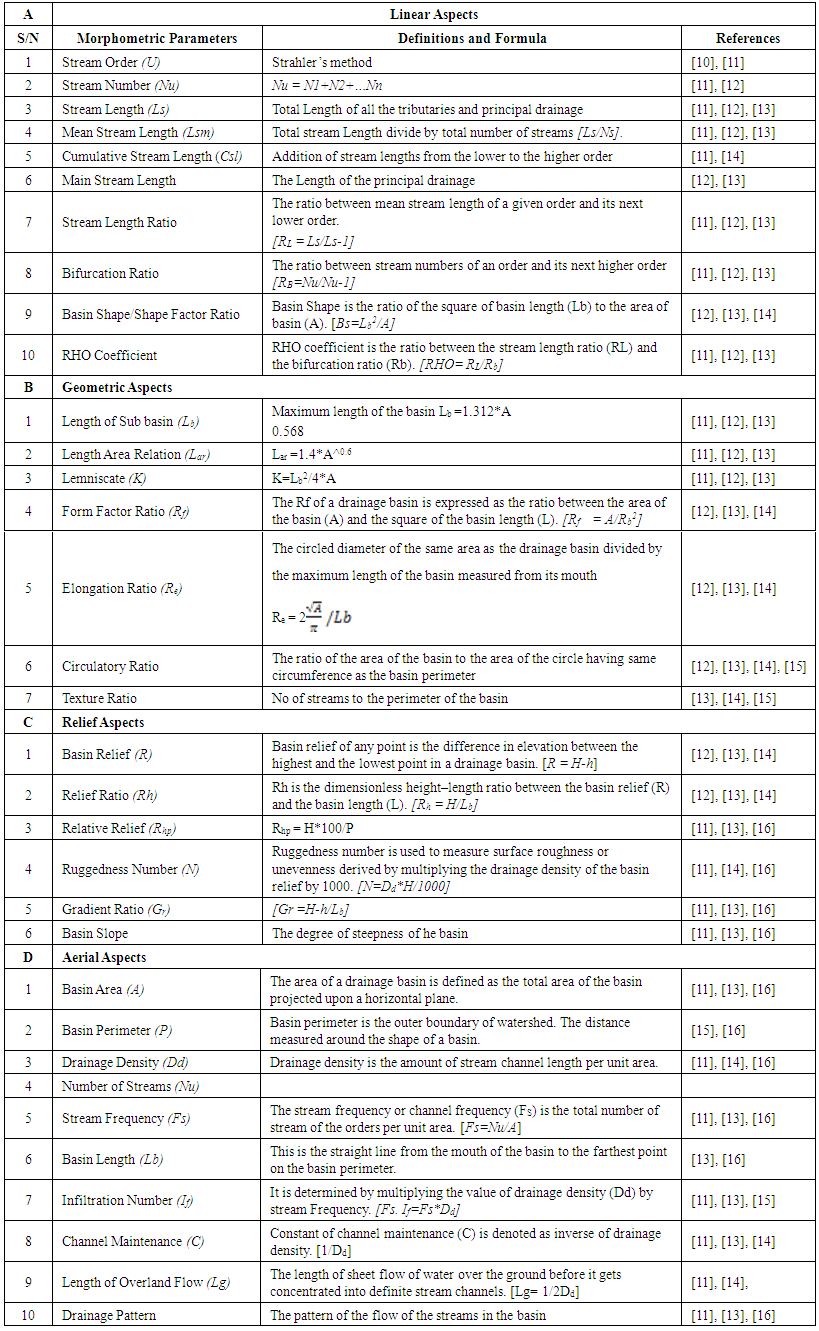 | Table 3. Morphometric parameters and their various formula |
4. Results
4.1. Linear Aspects
4.1.1. Stream Order (U)
- The stream order refers to the hierarchy of streams within an area [14]. The stream order of the Hawul Basin as shown in Fig.3 revealed that the basin has 6th order as the highest. The number of streams in each order is highlighted in Table 1. The main significance of stream order is that it shows the rate of discharge in a basin.
4.1.2. Stream Number (Nu)
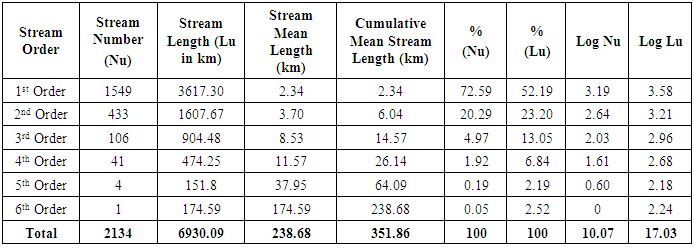
- The stream number denotes the numbers of streams in each stream order as shown in Table 4. which reveals a large number of first order streams followed by the second and third order in a decreasing magnitude. This trend of decreasing stream orders agree with the law of stream numbers [14]). Altogether, there were 2134 streams within the basin. The high number of the first order streams in the basin (1549) suggests the degree of topographic dissection in the upper reaches of the basin, which is a manifestation of the influence of the relief in the catchment.
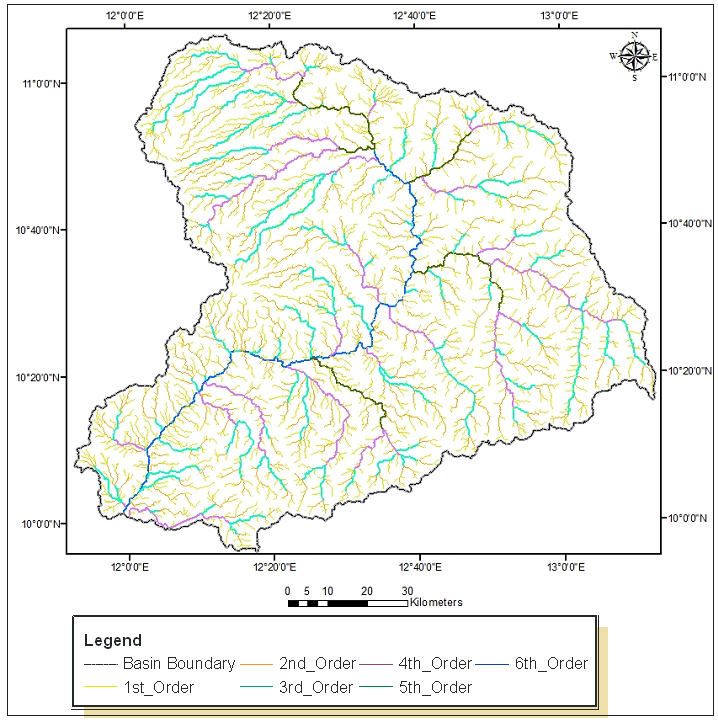 | Figure 3. Stream Order of Hawul Basin (Straller’s method) |
|
4.1.3. Stream Length (Ls)
- The stream length of Hawul Basin is presented in Table 4. The stream length decreased from the first order to the highest order except the 5th order where the stream length is shorter than that of the 6th order. This finding confirms the reports of [14], [15] that in well-drained and permeable drainage basins, the number of streams with long length is fewer when compared to the number of small-length streams which predominate in less permeable basins. This can be interpreted that longer streams are generally indicative of flatter slopes, while streams of smaller lengths are usually indication of larger slopes [13], [14]. In Hawul Basin, (Fig.2) higher order streams with long distances (stream mean length) like 4th to 6th order were found on the plains or river valley areas, while lower order streams with numerous short courses (first and second order streams) are more in upland and highland areas (Fig. 1).
4.1.4. Stream Mean Length (Lsm)
- The mean stream length as presented in Table.4 shows a decreasing pattern from highest to the least stream order. The total mean length of all the streams in the basin was 238.68km. This finding suggests that there are several long streams in the basin as revealed in Fig.3.
4.1.5. Cumulative Stream Length (Csl)
- The cumulative stream length as shown in Table 4 revealed a geometrical progression from the least to the highest order. This agrees with Horton’s law as stated in [14] that “the cumulative length of stream segment of successive orders tend to form a geometric series beginning with the mean length of the first order segment and increasing according to a constant length ratio”.
4.1.6. Main Stream Length
- The main stream length of Hawul Basin is the length of the 6th order, that is, the principal stream as shown in Table 4 which has a total length of 174.59km.
4.1.7. Stream Length Ratio
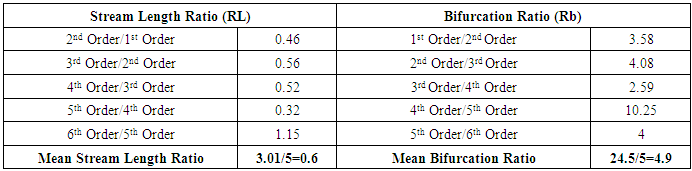
- The calculated mean length ratio is shown in Table 5 which reveals that the mean length ratio of Hawul Basin is 0.6km.
|
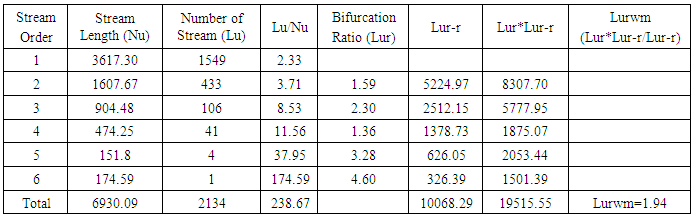
4.1.7.1. Weighted Stream Length Ratio
- Strahler (1952) in [17] arrived at a more representative stream number, by using a weighted mean stream length ratio obtained by multiplying the stream length ratio for each successive pair of orders by the total numbers of streams involved in the ratio and taking the mean of the sum of the values. This method was also adopted in this study as presented in Table 6. It was obtained by using this formular [17].
|
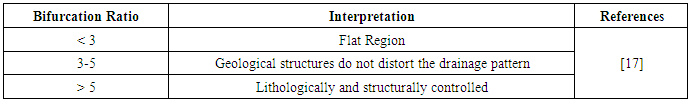
4.1.8. Bifurcation Ratio (RB)
- In the works of [11] and [15] bifurcation ratio is an indicator of the complexity and degree of dissection of a drainage basin. In Hawul Basin, the RB ranges from 4 to 10.25, while mean RB was 4.9. According to [11] and [15], bifurcation ratios range between 2.0 and 5.0 indicates sub basins in which the geologic structure does not exercise a dominant influence on the drainage pattern and indicates that the basin is falling under normal basin category. Therefore, only the areas dominated by fourth and fifth order streams are likely to have their drainage patterns influenced by the geology of the area.Mean Bifurcation RatioIn the study of [17] Mean bifurcation ratio is classified into three, the classification and the interpretation of the classification is shown in Table 7.The mean bifurcation ratio of Hawul basin was calculated to be 4.9 which falls within the 3 and 5 category and which indicates that the geology do not disturb the drainage pattern of the area.
|
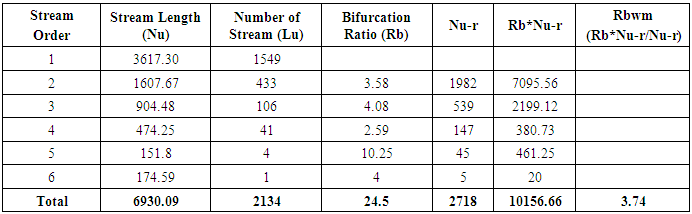
4.1.8.1. Weighted Mean Bifurcation Ratio
- Like the weighted mean stream length ratio, Strahler (1952) in [17] arrived at a more representative bifurcation ratio, by using a weighted mean bifurcation ratio obtained by multiplying the bifurcation ratio for each successive pair of orders by the total numbers of streams involved in the ratio and taking the mean of the sum of the values.The adopted formular for this is Rbwm = Rb*Nu-r/Nu-rWhere:Rbwm = Weighted Mean Bifurcation RatioRb = Bifurcation ratio of a each of the stream orderNu-r = The addition of the stream number of a stream order and that of the previous order
|
4.1.9. Basin Shape/Shape Factor Ratio
- Basin Shape or Shape Factor Ratio denotes the ratio of the square of Basin Length (Lb) to the Area of Basin (A) that is, the square of Basin Length by the area of the Basin. This was derived by measuring by crow flies from the mouth to the farthest point of the basin which is 145.40 km. Therefore, since Basin Shape is derived by dividing the square of basin length by the area of the basin, Hawul Basin shape is 145.402/11617.50 which is equal to 1.82. This value can be considered to be relatively high. According to [10] higher value of Basin shape indicates that the basin length is long which resulted in a good chance for groundwater recharge, while lower value indicates the short basin length which resulted in more flash flood hazard. Therefore Hawul Basin can be said to have high groundwater research and low possibility of flood occurrence.
4.1.10. RHO Coefficient
- RHO coefficient is the ratio between the stream length ratio (RL) and the bifurcation ratio (Rb). That is, stream length ratio divided by bifurcation ratio. Therefore, since Table 2 shows the values of stream length ratio and bifurcation ratio as 0.6 and 4.9 respectively, RHO coefficient is 0.12. According to [10] Rho coefficient indicates storage capacity of drainage network. The low RHO coefficient of 0.12 shows a low storage capacity of the basin, hence low possibility of flood occurrence.
4.2. Geometric Aspects
4.2.1. Length of Sub Basin (Lb)
- The length of the sub basin was derived by measuring the maximum length of the basin and dividing it by the area of the basin. That is, the length of the sub-basin is145.40km.
4.2.2. Basin Perimeter
- The outer boundary of a basin is known as basin perimeter. The main importance of basin perimeter is that it helps to determine the size as well as the shape of the basin. The calculated perimeter of the basin using GIS technique is 617.92km.
4.2.3. Relative Perimeter
- The relationship between the area of the basin and the perimeter gives the relative perimeter of the basin. The relative perimeter is determined by dividing the Area by the perimeter of the basin which is 11617.50/617.92 which is 18.80.
4.2.4. Lemniscate (K)
- In the works of [11] and [13] a formula was proposed by Chorely (1957) which gives the relation that k= Lb2/A where, Lb is the basin length (km) and A is the area of the basin. Therefore, for Hawul basin, the lemniscates value is 1.82.
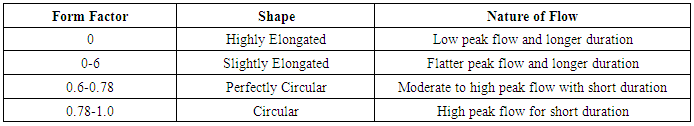
4.2.5. Form Factor Ratio (Rf)
- This is otherwise known as Basin Shape Index. Form factor ratio (Rf) predicts the flow intensity of a basin of a defined area [11]. According to [10] Form Factor Ratio is derived by dividing the area of the basin by the square of the basin length, that is, A/Lb2 which is 11617.50/145.402. The Rf of Hawul Basin is therefore, 0.55. [11] reported that low Rf indicates an elongated basin and higher values, represents circular basins. Hence, Hawul basin can be said to be more elongated than circular. Flood flow in elongated basins is said to be easier to control than that of circular basins [11] classified the values and their interpretations of Rf as shown in Table 9.
|
4.2.6. Elongation Ratio (Re)
- In the studies of [10] and [15] elongation ratio varies between 0.6 and 1.0 for majority of climatic and geologic types. Elongation ratio and the shape they represent are grouped into four categories [18]; circular (0.9-0.10), oval (0.8-0.9), less elongated (0.7-0.8), elongated (0.5-0.7), and more elongated (less than 0.5). The calculated elongation ratio for Hawul basin is 0.84 which means the basin is more of oval than circular or elongated in shape which is evidenced from the shapes in Figs. 1-3.
4.2.7. Circulatory Ratio (Rc)
- The value of circulatory ratio varies from 0 (in line) to 1 (in a circle). According to [18], Rc values approaching 1 indicates that the basin shapes are like circular and as a result it gets scope for uniform infiltration and takes long time to reach excess water at basin outlet. The Rc value of Hawul basin is 0.38 which means that the shape of the basin is not circular but more of an elongation. Moreover, in the study of [12], circulatory ratio also determines the stage of evolution of a basin. In their work, circulatory ratio of less than 1.5 means the basin is in its early stage, 1.5 to 3 connotes middle stage while above 3 means a youth stage of the basin. Therefore, Hawul basin can be concluded to be in its early stage of its erosion circle.
4.2.8. Texture Ratio
- The number of first order stream in the basin is 1549 while the perimeter of the basin is 617.92km. Therefore, the texture ratio of Hawul Basin is 2.51. These values show a relative moderate number of streams relative to the perimeter of the basin.
4.3. Relief Aspect
- Relief can be analyzed in terms of absolute and relative or local elevation. The knowledge of relief and forms is essential for understanding the spatial arrangement of landforms, which facilitates a better placing and more rational use of particular area.
4.3.1. Basin Relief (R)
- The highest and lowest elevations of the Hawul Basin as revealed in Fig.2 is 1113 and 171 respectively. Quantitatively, since Basin Relief is the difference in elevation between the highest and the lowest point in a drainage basin, the Basin Relief is 942 m above the sea level.
4.3.2. Relief Ratio (Rh)
- According to [11] Rh is the dimensionless height–length ratio between the basin relief (R) and the basin length (L). The relief Ratio of Hawul Basin is 6.47. The importance of relief ratio is to determine the steepness of the entire drainage basin. It is also used to determine erosion occurrence and vulnerability especially on the slopes of drainage basin. The high relief ratio of 6.47 of Hawul basin is as a result of the presence of highland areas especially parts of Biu plateau, Song and Hong hills within the basin.
4.3.3. Relative Relief
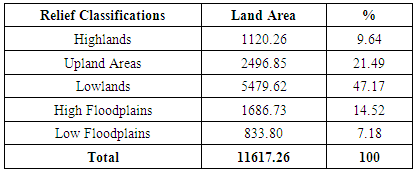
- Relative relief also termed as amplitude of available relief or local relief, is defined as the difference between the highest height and the lowest height in a unit area. According to [20], relative relief denotes actual variations of height in a unit area with respect to its base level. The relative relief map of the area expresses the amount of slope and nature of surface slope. Using geospatial techniques, the relative relief of Hawul Basin is shown in Fig. 4, while the values of each relief class which comprises the relief categories based on heights, land area (in square kilometers) and the percentage of each category are shown in Table 10.
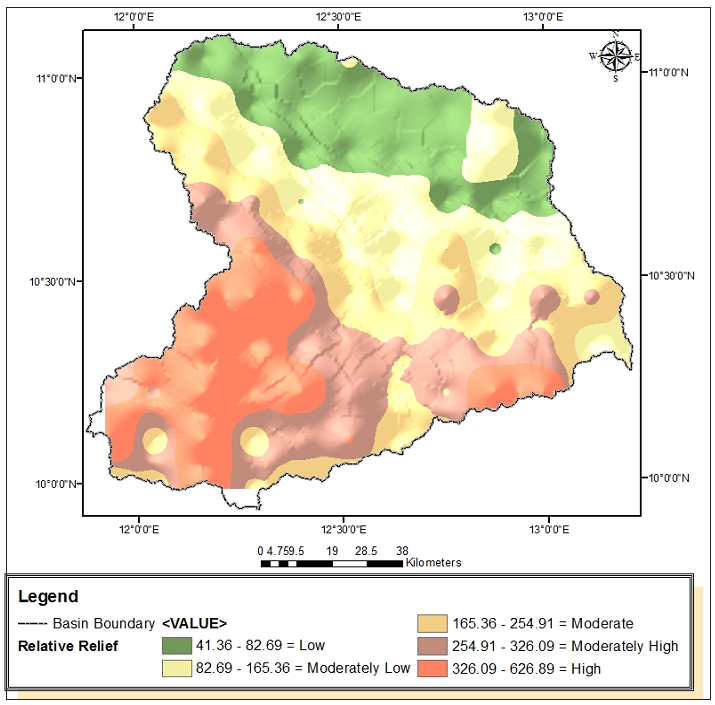 | Figure 4. Relative Relief of Hawul Basin |
|
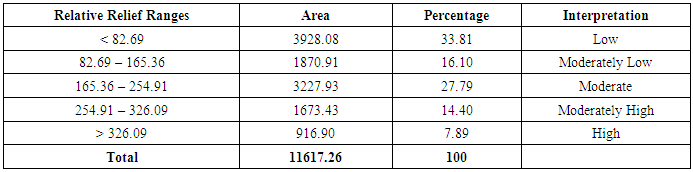
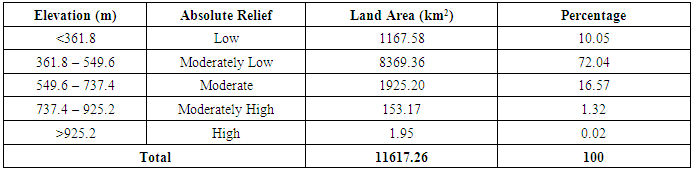
4.3.4. Absolute Relief
- Absolute relief refers to the maximum elevation of any area's morphology which also provides clues to estimate the type and intensity of denudation forces at work [21], [22]. The main objectives of absolute relief are to determine how much erosion has taken place in relation to the present summits of the area [21], [22]. The absolute relief of the basin is presented in Fig. 5, while Table 11 shows the results of the calculated absolute relief classes.Table 11 shows that 88.71% of the basin is either in the moderately low or moderate absolute relief region which covers most part of the basin except the Biu plateau region (high relief) and the main Hawul valley (low relief) which indicates low run off and high infiltration in the larger parts of the basin. Therefore, flooding in the basin is expected not to be frequent.
|
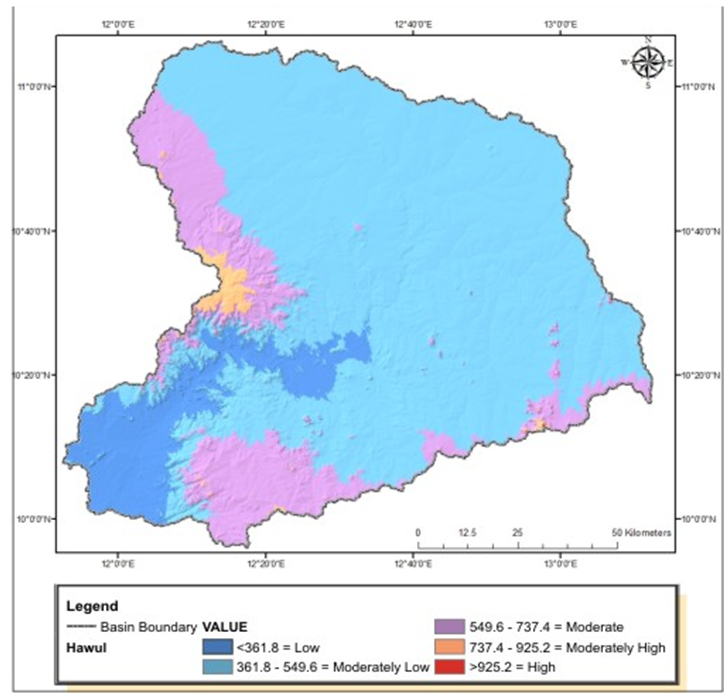 | Figure 5. Absolute relief of Hawul basin |
4.3.5. Profile Analysis
- The longitudinal profiles of the four selected years from 1985 to 2015 of River Hawul are shown in Fig.6. The profiles were grouped into three sections: (i) from the source to the rugged topography area marked as “A” region. (ii) The rugged topography region, that is “B” area and (iii) the mouth of the river valley which is the “C” region. Major changes in the valleys of the River took place mainly in the “A” region at where some depositional materials were noticed in the valley f the River in 1995 which have been eroded before or in 2005. The oval shaped circles in region “B” show the areas with slight changes while the mouth of the River recorded little or no changes. This signifies that erosion and flooding activities in the basin is minimal.
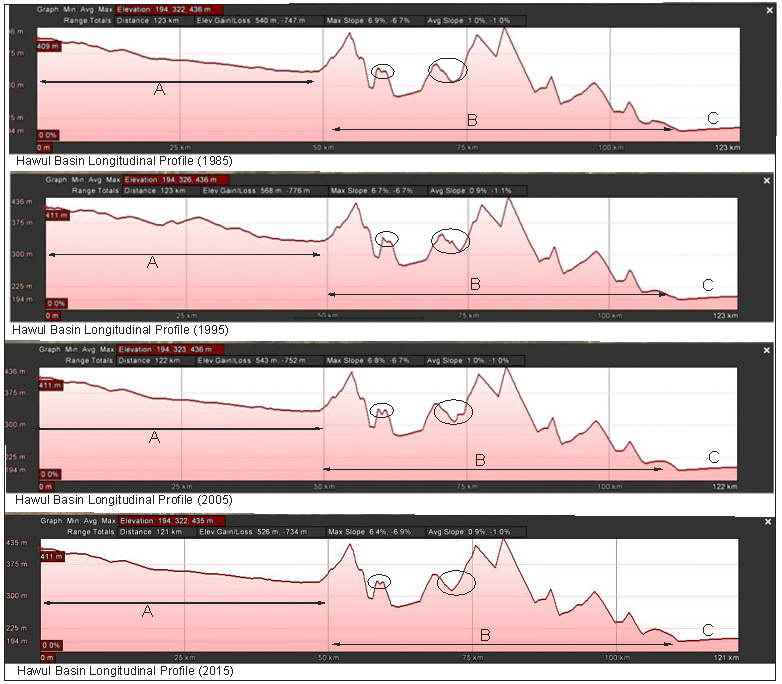 | Figure 6. Longitudinal profile of Hawul Basin from 1985-2015 |
4.3.6. Hypsometric Curve
- According to [20] hypsometric curve is generally used to show the proportion of an area of the surface at various elevations above or below or datum. It is the distribution of elevation as a function of area occupied by each contour interval within a geometric unit. The basic data requires for its preparation are area between successive contours and their respective height. Fig. 7a shows the hypsometric curve of Hawul basin which reveals that the areas with altitudes less than 434m above the sea level, occupy about 9,000km2, while those above cover less than 3,000km2 which suggests the low nature of the terrain of the basin.
4.3.7. Altimetric Frequency Curve
- Altimetric frequency curve involves the computations of frequency of occurrence of heights above sea level. Altimetric analysis helps in identifying and determining the level of erosion based on the terrain. Percentage of the frequency is graphed along the vertical scale and the actual elevations along the horizontal scale as shown in Fig. 7. The Altimetric curve (Fig.7b) shows that the areas with altitudes less than 500m covers the largest portion of the basin with 57.73% closely followed by the region with altitudes between 500m and 700m with 33.42%. High altitudes region (>900m) covers less than 1% of the basin area. All these also show that large portions of the basin are of low relief.
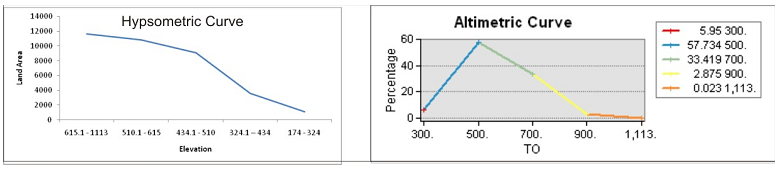 | Figure 7a. Hypsometric Curve of Hawul Basin& Figure 7b. Altimetric Curve of Hawul Basin |
4.3.8. Slope Analysis
- The slope of the basin (in percentage) which was classified into five classes is shown in Fig. 8, while Table 12 shows the land area and the percentage of each class as well as the five classified classes.
|
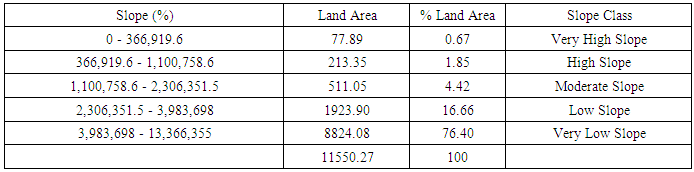
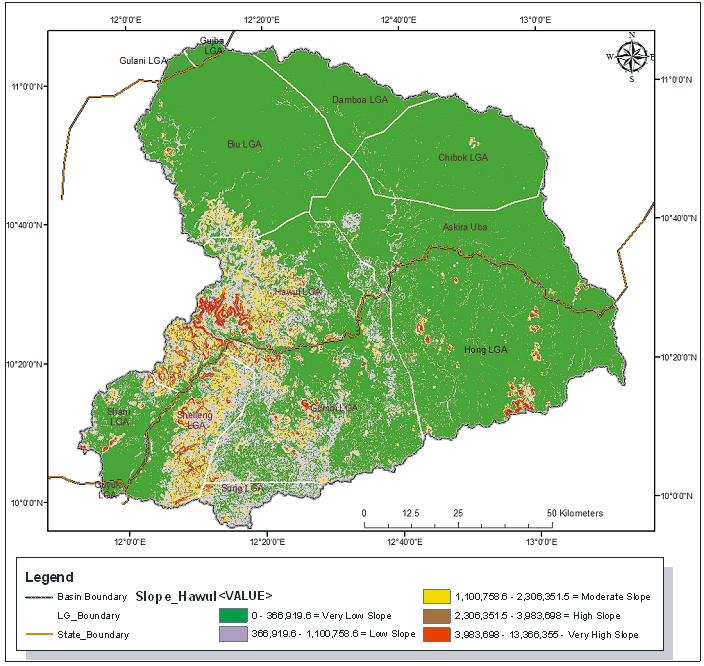 | Figure 8. Slope of Hawul Basin |
4.3.9. Ruggedness Index
- Ruggedness index is used to measure surface roughness or unevenness. Mathematically, ruggedness index is calculated by considering the drainage density, basin relief, stream length and the land area of the basin. Therefore, since basin relief is 942m, while the stream length is 6783.2 and the area of the basin is 11617.26, the Dd is 0.58, ruggedness number is therefore, 0.58 * (942/1000) which results into 0.55. According to [10], an extreme high value of ruggedness numbers occur when drainage density and total relief of the basin are large and slope is not only steep but long as well. Therefore, since the ruggedness number of Hawul basin is 0.55 (which is low), it shows that the slopes of the basin are gentle and short. Fig. 9 shows the spatial distribution of the ruggedness or smoothness of the basin. The higher the ruggedness number, the rougher the terrain; and the lower the number, the smoother the terrain.
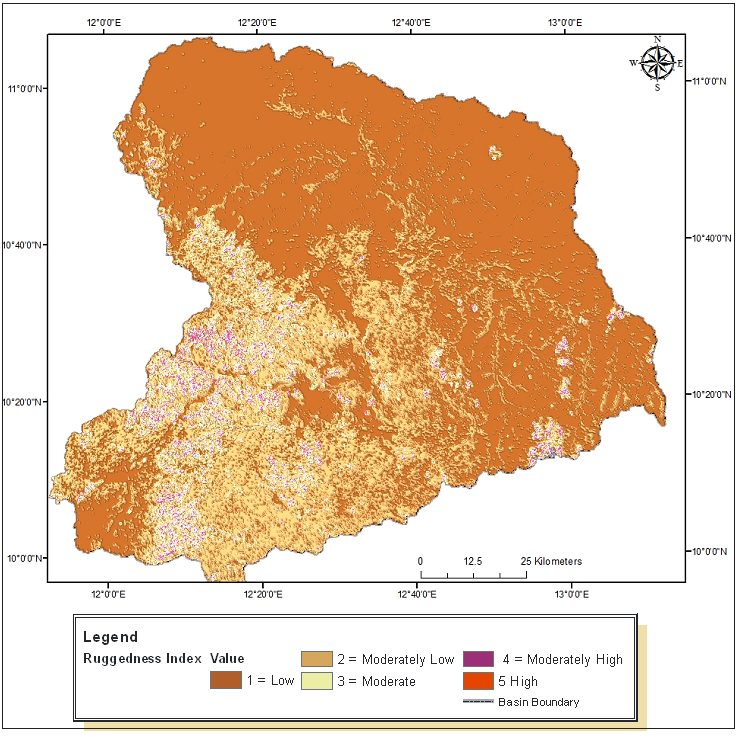 | Figure 9. Ruggedness index of Hawul Basin |
|
4.3.10. Gradient Ratio
- Gradient ratio is derived by dividing the height interval (H-h) by the basin length. The height interval is 942, while the basin length is 145.40. Therefore, the gradient ratio is 6.48 which is very similar to that of the relief ratio in 4.4.2.
4.4. Aerial Aspect
4.4.1. Basin Area
- Basin area plays a decisive role in determining aspect, size and shape of the basin [12]. The land area of the basin was calculated by the area calculation module of ArcGIS 10.2 software. The derived area is 11617.26km2. This area value signifies that the basin is a large basin. Since the basin size is large, it is likely that rainwater will not reach the main channel more rapidly as it might be in small basin. Lag time will be longer in the larger basin, meaning less flood occurrence. Basin area is a key parameter for flood modeling purpose [11].
4.4.2. Basin Perimeter
- Basin perimeter is the outer boundary of watershed. The perimeter of the basin was calculated as 617.92 km. This also suggests that Hawul basin is a large basin.
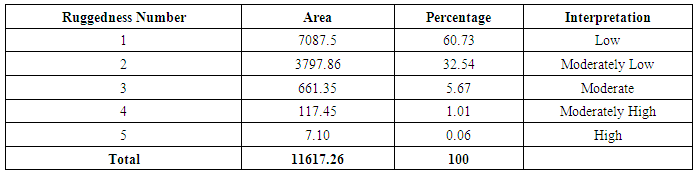
4.4.3. Drainage Density
- Drainage density is the length of steam channels per unit area in a drainage basin. High drainage density is associated with steep slopes and high average relief, while low drainage density is generally a result of a combination of permeable soil, dense vegetation and low relief [15]. Using quantitative techniques, 0.60 was derived as the drainage density of the entire basin, which is a low drainage density area. According to [23], a low drainage density is more likely to occur in regions of highly resistant or highly permeable subsoil material under dense vegetative cover and where relief is low. This is the true situation of Hawul basin which is located in the northern Guinea and southern Sudan savannah area with woodlands [24].The entire basin was also classified into sub basins, using geospatial technique. Thirty seven sub basins were derived. The drainage density of each of the sub-basins was calculated and mapped as shown in Fig. 10. It was discovered that all the sub basins also have their drainage densities below 1 (ranges from 0.42 to 0.70) which also supports the low terrain of the basin. The mouth of the basin at where the Hawul River enters Gongola River, consisting of Gondong and Wargila sub basin was found to have high drainage density because of the numerous deltaic streams generated at the mouth of the River. Alagarno on Biu Plateau was also found to have high drainage density because of the high stream density in the sub-basin as shown in Fig. 10.
 | Figure 10. Drainage density of Hawul Basin |
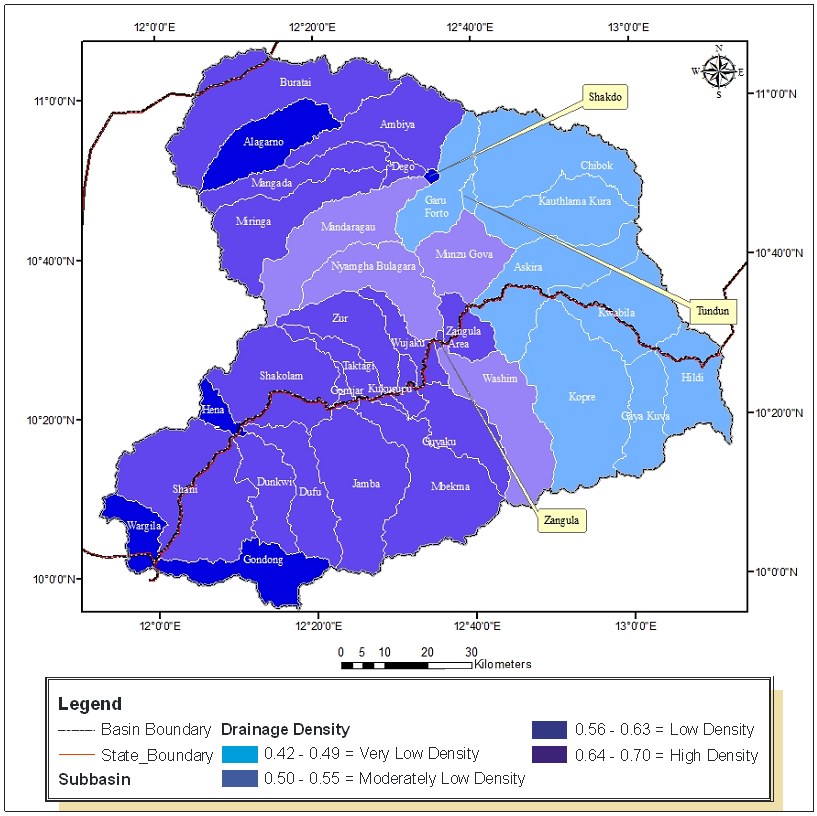
4.4.4. Stream Frequency
- Stream frequency or channel frequency (Fs) is defined as number of stream segments of all orders per unit drainage area. Quantitatively, the addition of all the number of streams in Hawul basin is 2134, while the basin area is 11617.26 km2, the stream frequency was therefore, calculated as 0.18. The Hawul Basin stream frequency can therefore be concluded to be low. According to [11], low values of stream frequency indicate presence of a permeable subsurface material and low relief. Like the drainage density, the stream density of the sub basins also conforms with the overall stream frequency of the entire basin with their values ranging from 0.09 to 0.33. The sub basins with high stream frequencies such as Wargila, Gondong, Hena, Wujaku, Taktagi, Shakolam, Kukurupu, Zangula among others, are found either along the valley of Hawul main River or at the mouth of the basin. Most part of the Biu plateau region was discovered to be of low stream density, as shown in Fig.11.The stream density based on the drainage density of Hawul Basin as presented in Fig. 12 shows that stream density is high along the main Hawul River, and the following sub-basins; Kwabila, Chibok, Ambiya, Buratai and Alagarno (compare Figs 11 and 12).
 | Figure 11. Stream frequency of Hawul Basin |
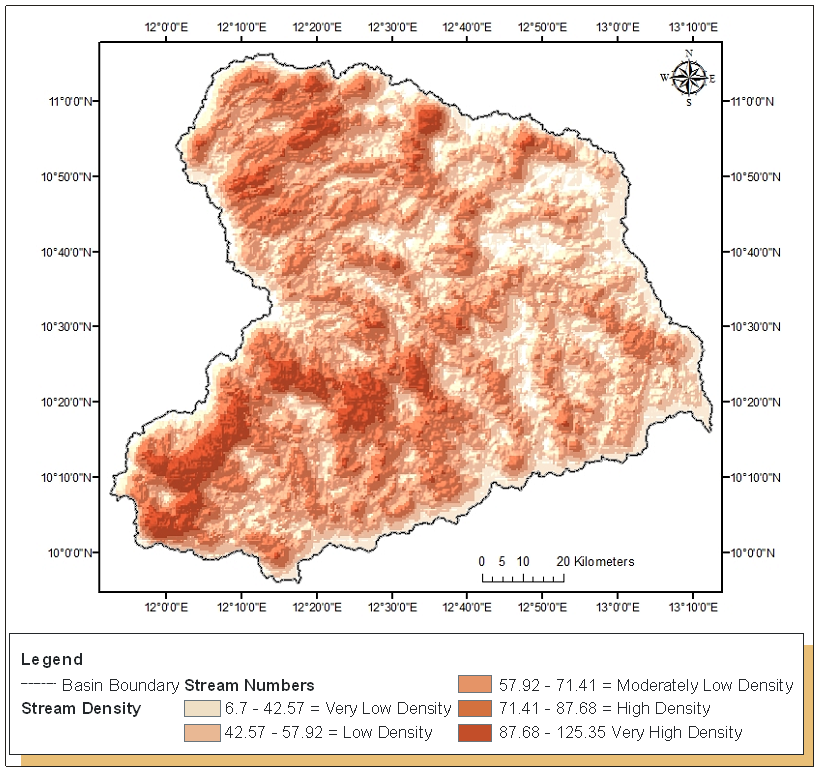 | Figure 12. Stream density of Hawul Basin |
|
4.4.5. Infiltration Number
- Infiltration number is determined by multiplying the value of drainage density (Dd) and stream frequency. The calculated infiltration number is 0.13 which is low. In the study of [11], the higher the value of infiltration number, the lower the infiltration capacity and the higher the run off. This means that Hawul basin has high infiltration capacity and low run off. No wonder, serious flood cases have not been reported in the basin.
4.4.6. Channel Maintenance
- Constant of channel maintenance (C) is denoted as inverse of drainage density. It is expressed in km2/km. It depends on the lithology, permeability and infiltration capacity of surface material, climatic condition and vegetation hence it is a measure of basin erodibility. Low value of constant of channel maintenance indicates high density of drainage network and less area required to sustain 1 km of drainage and vice versa [11]. The computed channel maintenance is 1.72. Since it is greater than one (1), it is considered as high which means low density of drainage network and more area required to sustain 1km of drainage.
4.4.7. Length of Overland Flow
- Length of the overland flow (Lg) is the length of sheet flow of water over the ground before it gets concentrated into definite stream channels. The calculated length of overland flow of Hawul basin is 1.72 and since it is more than one (1), the length is considered high. According to [11], higher value of Lg is indicative of low relief and whereas low value of Lg is an indicative of high relief. Hence Hawul basin can be said to be of low relief.
4.4.8. Drainage Pattern
- Figs. 2 and 3 revealed that the drainage pattern of Hawul basin is dendritic drainage pattern. According to [25], a dendritic drainage system is derived from a Greek word “dendrites” meaning “it looks like a tree”. These drainage systems are the most common forms of drainage patterns. In a dendritic pattern, there are many contributing streams which are joined together to form the tributaries of the main river. [26] reported that dendritic drainage pattern develops in basins having one rock type with no variation in structure. The drainage pattern of the basin is dendritic which suggests the non variation of the structure of the rock within the basin.
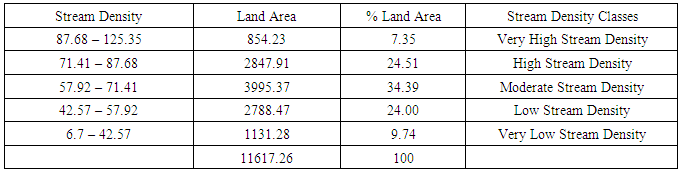
4.4.9. Aspect
- Aspect shows the direction of slope of an area. Fig. 13 shows the aspect map of the basin where the main River Hawul is very conspicuous. It shows the north, north west or north east pattern of slope as well as the south, south west or south east slope of the northern basin towards River Hawul. Since rivers flows according to the direction of slope, Fig 13 revealed that the streams and rivers in the southern part flow northwards into River Hawul, while those in the north flow southwards into Hawul River. Aspect map is also a useful tool for flood and soil erosion monitoring and management.
 | Figure 13. Aspect of Hawul Basin |
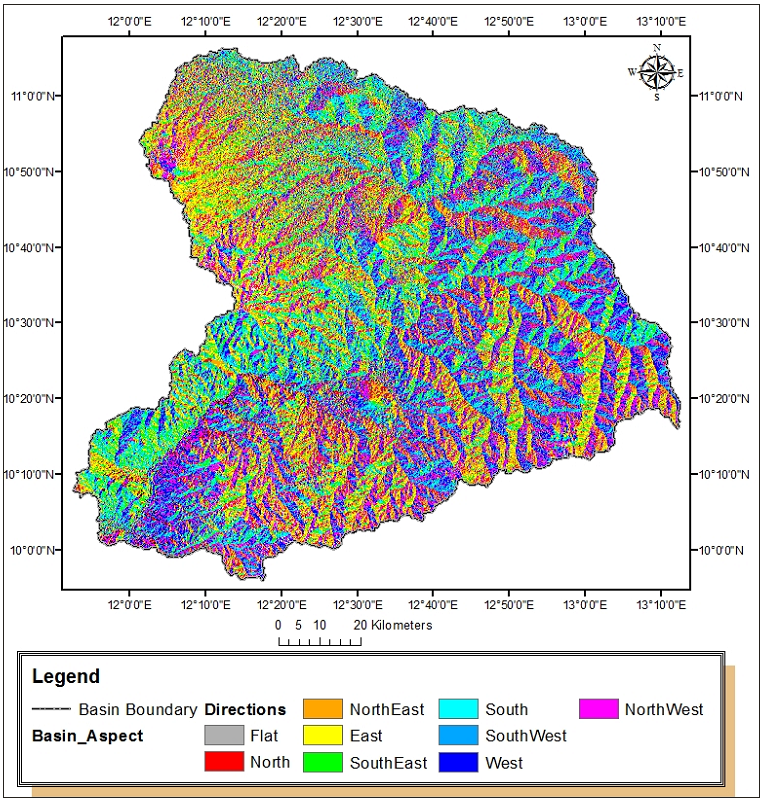
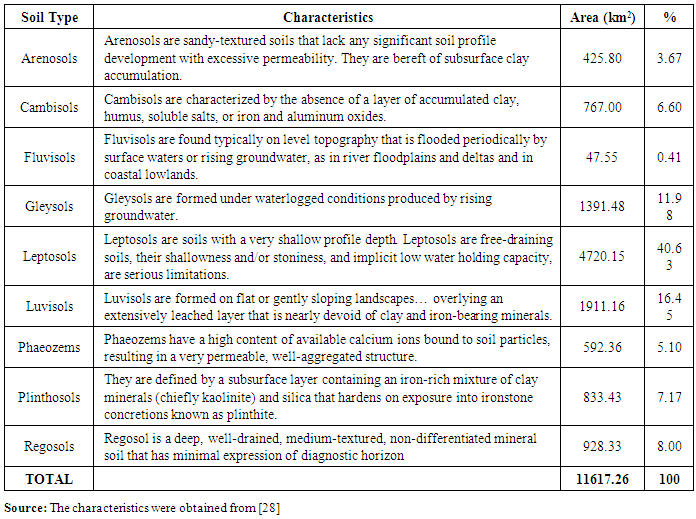
4.4.10. Soil Types and Characteristics
- Having established in this study that Hawul Basin has low relief with dominant highly permeable rocks, and that the basin is neither prone to floods or soil erosion, it is therefore necessary to examine the types, nature and the general soil characteristics of the basin in order to ascertain the reliability of the findings generated from the assessments of the morphometric characteristics. It must be noted that the main river which separates the two states is the only perennial river in the basin, while all the others, are seasonal. Hence, since the basin is located in the Sudan savanna with maximum annual rainfall rarely reaching 1000mm [9] the floods occurrence is expected to be minimal. The soil types within the basin are presented Fig. 14 with the area coverage, percentage of each type and the characteristics are all shown in Table 15.
 | Figure 14. Soil Types in Hawul Basin (Source: Extracted and Digitized from [27]) |
|
5. Conclusions
- It was revealed in this paper that Hawul Basin is located mainly within the River Gongola plains covering a total land area of 11617.26 km2, out of which 4816.79 km2 (41.46%) lies in Adamawa State and 6726.37 km2 (57.91%) in Borno State and the remaining 74.06 km2 (0.63%) in Yobe State. The mean bifurcation ratio of Hawul basin was 4.9, while the calculated weighted mean bifurcation ratio was 3.74 which falls in the same category (3-5) as the mean bifurcation ratio and which indicates that the geology of the basin do not disturb the drainage pattern of the area. Hawul Basin shape was 1.82, which suggests that the basin has high groundwater recharge and low possibility of flood occurrence. Similarly, the RHO coefficient of the basin was 0.12 which indicates low storage capacity of the basin, hence low possibility of flood occurrence. On the shape of the basin, the calculated elongation ratio was 0.84 which means the basin is more of oval than circular or elongated in shape. The value of the circulatory ratio was 0.38 which suggests that the basin is in its early stage of erosion circle.The Relative relief of Hawul basin is mainly made up of low relief because almost half of the basin (49.91%) is either low or moderately low. The absolute relief revealed that 88.71% of the basin is either in the moderately low or moderate absolute relief region which indicates low run off and high infiltration in the larger parts of the basin. Therefore, flooding in the basin is expected not to be frequent. The Altimetric and Hyposometric maps of the basin both show that the basin is of low relief. The ruggedness number was low (0.55) which means that the slopes of the basin are gentle and short. Using quantitative techniques, 0.60 was derived as the drainage density of the entire basin, which is a low drainage density area, and which connotes that the basin is a region of highly permeable subsoil material under dense vegetative cover and where relief is low. Six out of the nine soil types in the basin were also found to be of high permeable soil covering 80.45% of the basin area. The stream frequency of the entire basin was 0.18, while the stream density of the sub basins also conforms with the overall stream frequency of the entire basin with their values ranging from 0.09 to 0.33 which is a low frequency and which indicates the presence of a permeable subsurface material and low relief. The stream density of the Basin was found to be high along the main Hawul River as well as in Kwabila, Chibok, Ambiya, Buratai and Alagarno sub basins. The calculated infiltration number of the basin was as low as 0.13, which means that Hawul basin has high infiltration capacity and low run off. The computed channel maintenance of the basin was 1.72, and since it is greater than one (1), it is considered as high which means low density of drainage network and more area required to sustain 1km of drainage. The calculated length of overland flow was 1.72 and since it is more than one (1), the length is considered high. High value of Lg is indicative of low relief and whereas low value of Lg is an indication of high relief. Hence Hawul basin can be said to be of low relief. The drainage pattern of the basin is dendritic which suggests the non variation of the structure of the rock within the basin. Therefore, Hawul basin can be said to be a relatively large basin situated mainly between Borno and Adamawa state. It is a low relief basin with high infiltration and low run off, it is also a basin with high permeable rocks. The slopes are gentle and shorts, while the area has high groundwater recharge. As at present, the basin is not prone to some environmental hazards especially flood and soil erosion. About 80.45% of the basin is also found to be covered with high permeable soils. This might be the reason why no part of the basin was reported to be affected during the 2012 flood disaster in Nigeria. The impact of the morphometric characteristics on possible environmental hazards within the basin is hereby suggested for further studies.
6. Recommendations
- Based on the findings in this paper, the following recommendations were made:(i) The two riparian states (Adamawa and Borno) to Hawul Basin should harness the potentials of the basin.(ii) There should be proper landuse planning and management, and regular environmental monitoring of the basin should be carried out, in order to maintain the current environmental conditions especially on flood and soil erosion in the basin.(iii) Since this paper has successfully demonstrated the use of both quantitative and geospatial technique for morphometric analysis of a basin, which clearly shows the actual location, size, shape and nature of features, the use of geospatial technique for water resources monitoring should be globally embraced.