-
Paper Information
- Paper Submission
-
Journal Information
- About This Journal
- Editorial Board
- Current Issue
- Archive
- Author Guidelines
- Contact Us
Resources and Environment
p-ISSN: 2163-2618 e-ISSN: 2163-2634
2018; 8(3): 91-98
doi:10.5923/j.re.20180803.01

Spatio-Temporal Analysis of Areas Vulnerable to Flooding in Ibaji Local Government Area, Kogi State, Nigeria
 Abstract
 Reference
 Full-Text PDF
 Full-text HTML
Mohammed Abdulsamad
Department of Geography, Faculty of Science, Ahmadu Bello University, Zaria, Nigeria
Correspondence to: Mohammed Abdulsamad, Department of Geography, Faculty of Science, Ahmadu Bello University, Zaria, Nigeria.
| Email: |  |
Copyright © 2018 The Author(s). Published by Scientific & Academic Publishing.
This work is licensed under the Creative Commons Attribution International License (CC BY).
http://creativecommons.org/licenses/by/4.0/

This study focuses on the spatio-temporal analysis of flood vulnerability in Ibaji local government area. Flood is an environmental hazard resulting largely from events such as heavy rainfall that lead to overflow of land area. Flooding at whatever scale or magnitude is an annual phenomenon in the study area. It is an ecological disaster that results to destructions of houses, farmlands, lives and properties, as well as biodiversity. Field survey, Satellite imageries, Global Positioning System (GPS), Shuttle Radar Topographic Mission (SRTM), and Rainfall data were the materials used for the study. Factors such as elevation, slope, drainage, land use and soil types have effects on flooding. The results revealed that about 25.000% of the total land area is vulnerable to flooding, while moderate and low vulnerable areas constitute 21.875% and 53.125% respectively. The study also showed that the flood trend is increasing from the riverine areas to the hinterland. In view of the risk at which the people in the area are exposed to and the extent of environmental damage, there is great need for further research on mitigation measures so that the menace of flooding can be minimized.
Keywords: Flood vulnerability
Cite this paper: Mohammed Abdulsamad, Spatio-Temporal Analysis of Areas Vulnerable to Flooding in Ibaji Local Government Area, Kogi State, Nigeria, Resources and Environment, Vol. 8 No. 3, 2018, pp. 91-98. doi: 10.5923/j.re.20180803.01.
Article Outline
1. Introduction
- Flood is a hazard resulting from extreme meteorological events like heavy rainfall causing rivers and oceans to overflow their banks and can have far-reaching effects on people and the environment. Flood is defined as the accumulation of excess water which rises to overflow land that is not normally submerged (Mukhopadhyay, 2010). According to Disaster Management Support Group (DMSG, 2001), they are among the most devastating natural hazards in the world, leading to significant economic and social damages than any other natural phenomenon.Extensive damages, both in terms of loss of lives and properties, have been recorded globally. In India, one hundred and twenty five people were killed and over 12 million people were displaced in the 2007 flood disaster that hit Bihar, Uttar Pradesh and Assam province (Isa et al., 2015). African countries have not been left out in this global flood event experience. In 2001, the central provinces of Mozambique were hit by flood disaster that affected 554,000 people and resulted in one hundred and thirteen deaths (OCHA, 2003).In Nigeria, devastating flood events can be dated back to 1963 in Ibadan city, when Ogunpa river was over-flown causing loss of lives and properties (Adegbola and Jolayemi, 2012; Agbola, Ajayi, Taiwo and Wahab, 2012). Since then, the occurrence of floods has spread nationwide. More than half of the 36 States in Nigeria have been hit by one form of flood or another. The states that have been badly affected by floods in the country include Kano, Niger, Jigawa, Kaduna, Adamawa, Benue, Kogi and other states in the southern parts of Nigeria (Adeoye, Ayanlade, Babatimehin, 2009).Vulnerability is the degree of damage to a given item at risk caused by floods with determined amount and is influenced by several factors, such as human settlement conditions, infrastructure and authorities (United Nations, 1998). Vulnerability assessments have been recognized as being crucial to disaster management and are conducted to understand potential for loss, focusing on nature of the hazard and who and what are exposed (Enyinnaya and Ogbonna, 2015).During the last two decades, remote sensing has played a key role in the field of flood management, while GIS has been used extensively to model surface water and flood damage (Dewan, Kankam and Nishigaki, 2005). Remote Sensing technique has increasingly become important in providing reliable and timely information on environmental issues like flood monitoring. While GIS can be used to create interactive map overlays, which clearly and quickly illustrate which areas are in danger of flooding (Awal, 2003).Ibaji has witnessed serious river flood events in the past years. Annually, it displaced thousands of people in Ibaji and submerged several square kilometers of landed area in general and farmlands in particular. Usually, the floods occur during the peak of rainy season (June-October), and have attracted the attention of the State and Federal Government (KOSEMA, 2007). Therefore, a flood vulnerability analysis using Remote Sensing and GIS techniques was carried out in Ibaji local government area. The aim was to know the areas that are vulnerable to flooding in order to provide government agencies relevant information to cope with future floods.
1.1. Statement of the Research Problem
- Floods of different magnitude are an annual phenomenon in Ibaji during rainy seasons and it has left thousands of people homeless, destroyed hectares of farmlands, deterioration of health conditions owing to waterborne diseases, loss of lives and properties. These flood disasters have attracted humanitarian assistance from Kogi State Emergency Management, National Emergency Management, Red Cross and many among others KOSEMA (2012). In 2012, the most devastating flood event in Nigeria occurred as a result of heavy rain in addition to the release of water from Lagdo dam in Cameroon Republic. According to KOSEMA (2012), this flood disaster ravaged most communities in Ibaji leading to displacement of people, destruction of hectares of farmlands, loss of lives and properties.
1.2. Aim and Objectives
- The aim of the study is to analyze flood vulnerability in Ibaji local government area, Kogi state. However, the specific objectives of the study are to:i identify the factors influencing floods in the study area.ii locate and map out areas vulnerable to flooding in the study area.iii examine the trend of flood vulnerability level in the study area (2000-2012).
1.3. Justification of the Study
- The devastating effects of flood hazard all over the world annually cannot be overemphasized in terms of the loss of lives, properties and valuable agricultural land. Ibaji is one of such area that experience flood annually and this flood is a potential harm to residence of Ibaji because of its severity and magnitude of its impact. In 2007, 2008 and 2012 flood disaster ravaged most communities in Ibaji leading to loss of lives, displacement of people, destruction of farmlands and properties (KOSEMA, 2012).
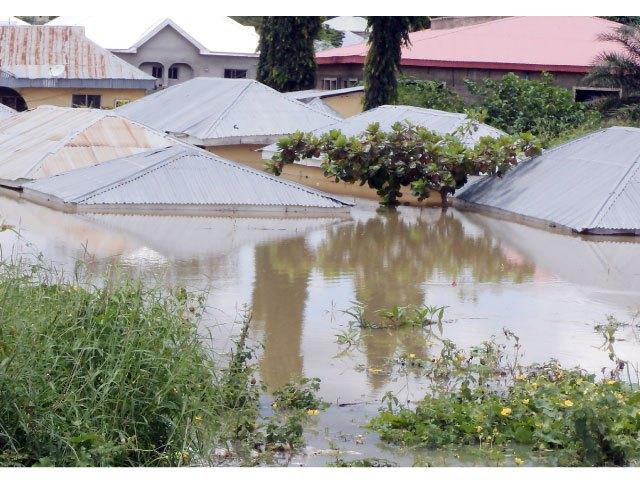 | Plate 1. Submerged Houses in Ibaji L.G.A. (Source: www.kogiflood.wordpress.com/) |
2. Study Area
- The study area is Ibaji Local Government Area of Kogi State, Nigeria. Ibaji is located between Latitude 06°52'00"N 06°87'00"N of the equator, and Longitude 06°48'00"E06°80'00"E of the Greenwich meridian. It is located in eastern part of Kogi state Figure 1 and has an extension of 1, 377km². It is separated from Edo state to the west by the river Niger, and bordering Delta state in the south. The Headquarter of Ibaji local government is Onyedega.
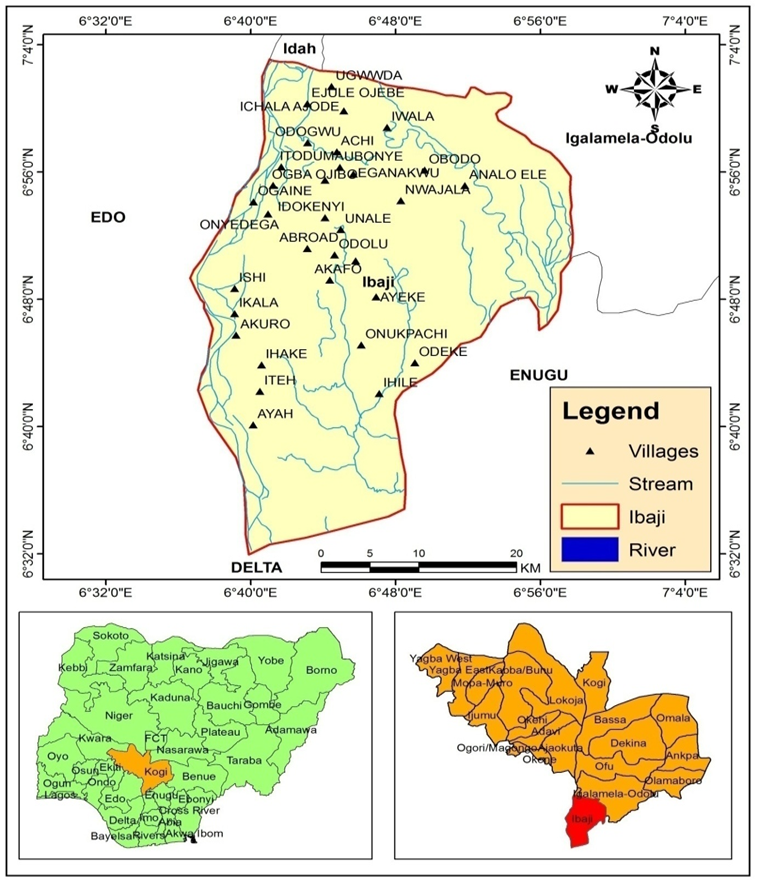 | Figure 1. The Study Area |
3. Materials and Methods
3.1. Materials
- The materials used for the study include:• Satellite imagery• Global positioning system (GPS);• Shuttle Radar Topographic Mission (SRTM)• Rainfall data.• Soil map.
3.2. Data Collection
- • Landsat ETM imagery of 2015 with spatial resolution of 30m was obtained from United States Geological Survey. This was used to generate the landuse/landcover map of the study area.• A handheld Global Positioning System was used to obtain coordinates of settlements in the study area.• Shuttle Radar Topographic Mission (SRTM) of 90m resolution was obtained from Global Land Cover Facilities Index. This was used in generating the slope map, elevation map and drainage map of the study area.• Rainfall data was sourced from Nigeria Meteorological Agency (NIMET) Kogi State. This was used to generate rainfall distribution pattern in the study area.• Soil map was sourced from Ministry of Agriculture, Kogi State. This was used in obtaining soil information in the study area.
3.3. Data Processing
3.3.1. Generation of Landuse Map
- The Landsat 8 Imagery of Ibaji Local Government was geo-referenced using the Universal Traverse Mercator (UTM) Zone 32 North with datum WGS 1984. The study area was clipped out of the imagery. The Landsat imagery and shuttle radar topography mission were sub-mapped to Ibaji. Finally, unsupervised classification was carried out into five classes (water body, vegetation, farmland, bare land and built-up area).
3.3.2. Generation of Slope Map and Elevation Map
- The digital elevation model (DEM) Module creation of ArcGIS 10.2 was used to create digital elevation model (DEM) of Ibaji local government from Digital Elevation Dataset of Shuttle Radar Topography Mission (SRTM) version 2 (90). This was used to produce slope map and elevation map of the study area.
3.3.3. Generation of Drainage Density
- The drainage density of the area was generated from shuttle radar topography mission data. The area of interest was clipped out of Shuttle radar topography mission version 2 (90m) of SRTM Nigeria 2005. The spatial analysis tools on ArcGIS 10.2 software was used in computing the drainage density of the area.
3.3.4. Generation of Soil Map
- The soil map of Nigeria was scanned and imported into ArcGIS 10.2 environment where it was geo-referenced using UTM Zone 32 North with datum WGS 1984. Ibaji local government was subset from the soil map of Nigeria and the soil types of Ibaji were digitized.
3.3.5. Generation of Rainfall Map
- The mean annual rainfall for 30 years was used to create rainfall map of the area by interpolating from five meteorological stations (Idah, Nsukka, Uromi, Ukehe and Itobe) that are close to Ibaji due to lack of rainfall data in Ibaji. The Kriging method on the spatial analysis tool of ArcGIS 10.2 was used for the interpolation.
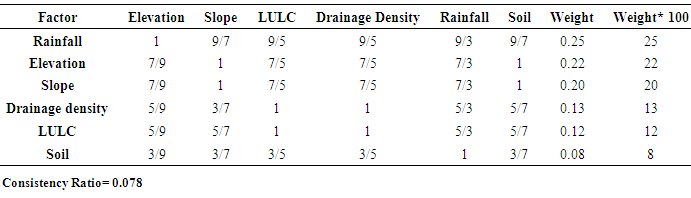
3.4. Steps Used in Deriving Criterion Weight Using AHP
- The relationship between the six causative thematic map and their attributes were derived using analytic hierarchy process (AHP). The methodology used for deriving their weights involved the following steps:Step 1: Defining the problem clearly and decomposing it into various thematic layers containing the different features/classes of the individual themes so that they form a network of the model (Saaty, 1980).Step 2. Generating Pair-wise comparison matrices: The relative important values are determined with Saaty’s 1-9 scale (Table 1) where a score of 1 represents equal importance between the two attributes, and a score of 9 indicates the extreme importance of an attribute compared to the other one (Saaty, 1980).
4. Results and Discussions
- This section presents the results of the analytical hierarchy process carried out on the six flood causative factors identified in the study area and also used the results of the pair-wise comparison carried out for the six flood causative factors based on Saaty’s scale of pair-wise comparison and generated flood vulnerability map.
4.1. Factors Influencing Floods in Ibaji Local Government Area
- The factors considered were rainfall, elevation, slope, soil, drainage density and land cover. The classes of the factors were further weighed using Saaty’s scale of pair-wise comparison and reclassified using reclass tool on ArcGIS 10.2 to identify the major factors influencing floods. The combined weights for all the factors are shown in Table 1.
|
4.2. Areas Vulnerable to Flood in the Study Area
- This section used the results of the pair-wise comparison carried out for the six flood causative factors on Table 1 based on Saaty’s Fundamental scale of pair-wise comparison and generated flood vulnerability map. To determine vulnerability level of an area, these factors weight from the analytical hierarchy process (AHP) were overlaid using the weighted sum in ArcGIS 10.2 spatial tool to produce the flood vulnerability map of five level (very low, low, moderate, high and very high vulnerable areas), as presented on Figure 2.
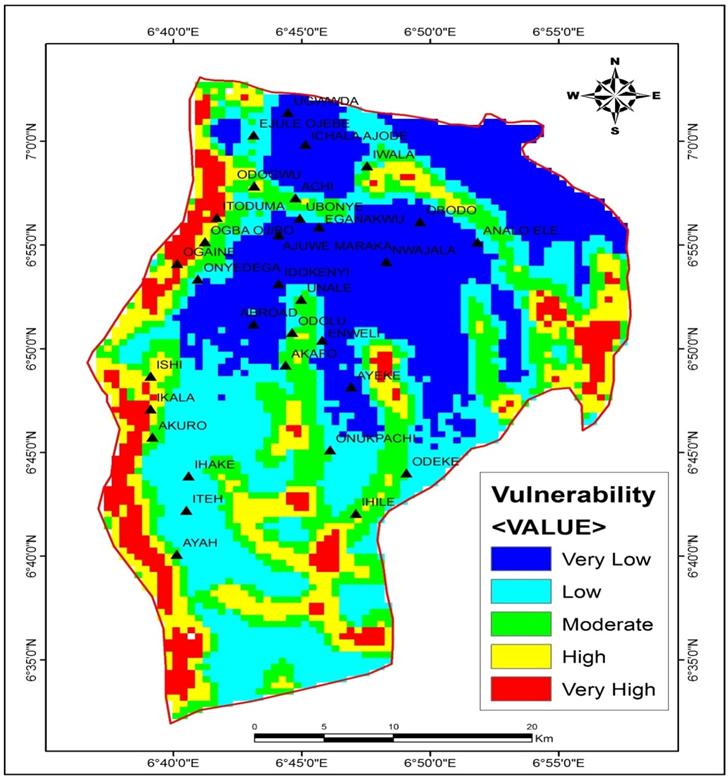 | Figure 2. Flood Vulnerability Map of the Study Area |
4.3. Trend of Flood Vulnerability in the Study Area
- The trend of flood in the study area was obtained using the flood records of Kogi State Emergency Management Agency (KOSEMA). Flood records of 2002, 2007 and 2012 were imported into Excel as X and Y and save in CVS format to be read/recognized by ArcGIS. The result of the analysis is shown on Figures 3 and Figure 4.
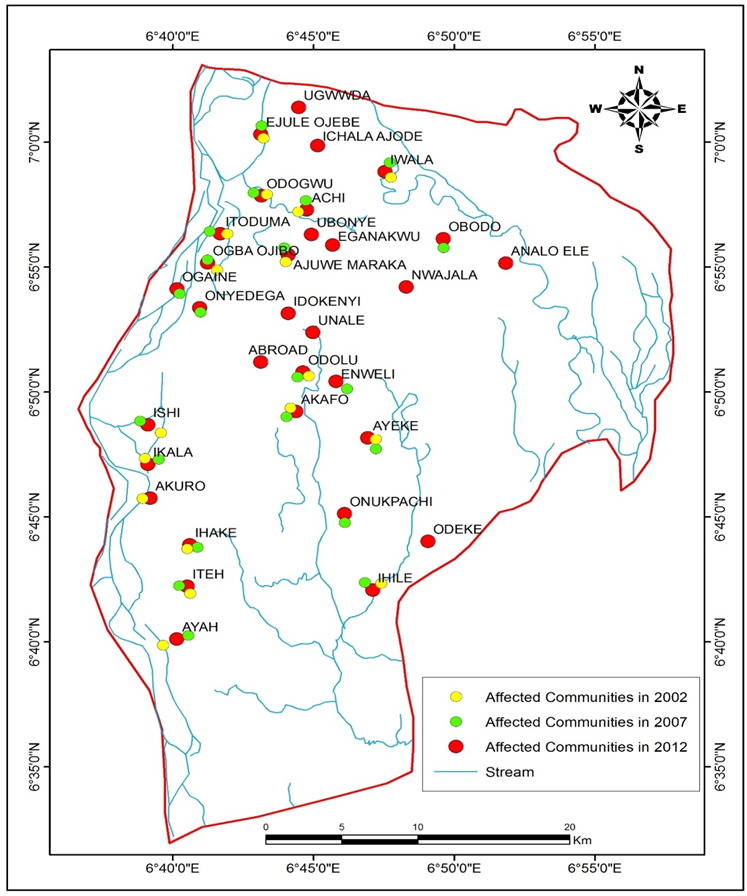 | Figure 3. Areas Affected by Flood in 2002, 2007 and 2012 |
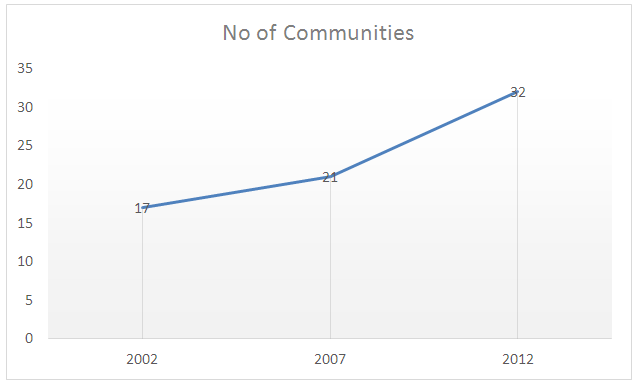 | Figure 4. Areas Affected by Flood in 2002, 2007 and 2012 |
5. Conclusions
- The study analyzed flood vulnerability in the study area. The findings showed that areas that receives more rainfall and are on low elevations are more prone to flood than those that receives less rainfall and are on higher elevations. This means that all villages, populace and other facilities found within these areas are at great risk of flood hazard.
6. Recommendations
- Based on the findings of this study, the following recommendations are hereby made:i. Settlements that are within or adjacent to the areas liable to flooding should be relocated where possible and future settlements should be discouraged.ii. The local government authority and state emergency management agency should try and work with other relevant agencies in providing improved relief services to flood victims.iii. There is great need for further research on mitigation measures so that the menace of flooding can be minimized in the study area.