-
Paper Information
- Next Paper
- Paper Submission
-
Journal Information
- About This Journal
- Editorial Board
- Current Issue
- Archive
- Author Guidelines
- Contact Us
Resources and Environment
p-ISSN: 2163-2618 e-ISSN: 2163-2634
2018; 8(2): 73-81
doi:10.5923/j.re.20180802.08

Evaluation of Water Quality and Its Suitibility for Drinking and Agriculture Use in Azerbaijan
 Abstract
 Reference
 Full-Text PDF
 Full-text HTML
M. M. Ahmedov1, F. Y. Humbatov1, V. S. Balaev1, A. Sardarli2
1Institute of Radiation Problems, National Academy of Sciences of Azerbaijan, Azerbaijan
2First Nations University of Canada, Canada
Correspondence to: A. Sardarli, First Nations University of Canada, Canada.
| Email: |  |
Copyright © 2018 The Author(s). Published by Scientific & Academic Publishing.
This work is licensed under the Creative Commons Attribution International License (CC BY).
http://creativecommons.org/licenses/by/4.0/

Within the presented project, 29 water samples collected from different rivers of Azerbaijan were analysed to assess water quality and suitability for domestic, livestock, and irrigation usage. The pH of the river water varied from 7.79-9.34. Electrical conductivity (EC) of all collected water samples was within the range of 279-2738 μS/ cm. The cation chemistry indicated that out of 29 water samples, 16 samples showed a dominance sequence of Ca > Na > Mg > K, 5 samples showed a dominance sequence of Na > Ca > Mg > K, 6 samples showed a dominance sequence of Ca > Na > K > Mg, and 2 samples showed a dominance sequence of Na > K > Ca > Mg. The quality assessment showed relatively high values of EC, total dissolved solid (TDS), HCO3-, Cl-, and SO42-, in several water samples, which would make them unsafe for drinking, livestock, and irrigation purposes. The uranium concentration lies in the range of 0.0429 -7.0355 ug·L−1 with an average of 0.6162 ug·L−1 in water samples from different rivers in Azerbaijan. The values of thorium on all sampling points was less than 0.01 μg/L.
Keywords: Azerbaijan, Inductively Coupled Plasma Mass Spectrometer (ICP-MS), Residual Sodium Carbonate (RSC), Sodium Absorption Ratio (SAR), Soluble Sodium Percent (SSR), Water quality management
Cite this paper: M. M. Ahmedov, F. Y. Humbatov, V. S. Balaev, A. Sardarli, Evaluation of Water Quality and Its Suitibility for Drinking and Agriculture Use in Azerbaijan, Resources and Environment, Vol. 8 No. 2, 2018, pp. 73-81. doi: 10.5923/j.re.20180802.08.
1. Introduction
- Water Quality Management is the surface water and groundwater quality control required to supply water with a required quality and for a specific use at any time. For water quality control, determining the physical, chemical and biological characteristics of a river is necessary. To achieve this objective, it is necessary to have the proper monitoring of water quality; however, even availability of the data is not enough for appropriate water quality management without proper interpretation [1, 2]. The capacity for water resources to meet various needs (domestic, livestock, and irrigation) has led to water sources being over-stressed, leading to the scarcity of quality water. Various reasons can be advanced to account for this water scarcity, including: population increase, climate change, environmental degradation, weak and inadequate institutional capacities, and growing poverty levels in the country [3]. The rapid population increase subjected the limited available water resources to significant pressure in the effort to meet various needs. Climate variability and change has also significantly altered rainfall patterns and amounts, thereby effecting the replenishment rate of water bodies [3, 4].Hydro-chemical analysis and subsequent water quality evaluation often reveals quality of water that is suitable for domestic consumption, agriculture, and industrial purposes, as well as aiding in the management of the water resource. Furthermore, it is possible to understand the change in water quality due to either rock water interaction or anthropogenic influence. Water often consists of seven major chemical ions which include cations Ca2+, Mg2+, Na+, K+ and anions Cl-, HCO3-, SO42-. Other parameters include pH, Colour, Turbidity, Free Carbon Dioxide and Total Dissolved Solid. These chemical parameters play a significant role in classifying and assessing water quality. Determination of natural radionuclides such as U and Th in water samples are also important [5]. The natural isotopic composition of uranium consists of three isotopes: 238U, 235U and 234U; all of them are radioactive. The groups of uranium isotopes exist in Earth’s crust with an abundance of 4×10⁻⁴ percent and are found in rocks and minerals such as granite, metamorphic rocks lignite, monazite sand, and phosphate deposits as well as in uranium minerals such as uraninite, carnotite, and pitchblende [5-7]. Uranium present in the Earth, is transferred to water, plants, food supplements, and then to human beings. Uranium nuclides emit alpha rays of high ionization power and therefore may be hazardous if inhaled or ingested in higher quantities. Adverse health effects from natural uranium can be due to its radioactive and chemical properties. The radioactive effects from natural uranium are not substantial; however, chemically, it can be harmful to the kidneys with significant exposure. Uranium is a very reactive element readily combining with many elements to form a variety of complexes. The need for the estimation of uranium concentration in water is multifaceted; it is an important fuel for nuclear power reactors. Hydro geochemical prospecting for uranium is essential and the assessment of risk of health hazards due to high concentration of uranium in water is of the utmost significance [5-7]. Thorium is a naturally occurring radioactive metal that is found at low levels in soil, rocks, water, plants, and animals. Almost all naturally occurring thorium exists in the form of either radioactive isotope 232Th, 230Th, or 228Th. There are more than 10 other thorium isotopes that can be artificially produced. Smaller amounts of these isotopes are usually produced as decay products of other radionuclides and as unwanted products of nuclear reactions. Studies have shown that inhaling thorium dust causes an increased risk of developing disease, including lung cancer and pancreatic cancer. Liver disease and some types of cancer have been found in people injected with thorium for the purpose of X-rays. Bone cancer is also a potential health effect due to the storage of thorium in bone [8].In this article, we present the results of our studies on the water quality in Azerbaijan Republic. The water samples were collected from different rivers of the Azerbaijan Republic, and were analysed/compared with water quality standards for domestic, industrial, livestock, and irrigation usage.Geography. The Azerbaijan Republic is one of three countries in the South Caucasus and has a territory of 86,600 km2. Azerbaijan borders Russia in the north for 289 km along the Samur River, 340 km with Georgia in the northwest, 766 km with Armenia in the west, 11 km with Turkey in the southwest, and 618 km with Iran in the south. The length of its Caspian Sea coastline from the Astara River to the Samur River is 825 km. The range of elevation within the Republic varies from 4,480 m. in the Major Caucasus Mountains (Bazarduzu crest) to –26.0 m (Caspian Sea level). The average altitude of the area is 384 m with 18 per cent of the area below sea level, 39.5 per cent between 0 and 500 m, 15.5 per cent between 500 and 1,000 m, and 27 per cent greater than 1,000 m [9]. Sharp changes of altitude due to the orographic structure of the Major and Minor Caucasus Mountains and the location of the Kur-Araz lowlands form the unique climate in the Republic. Climate conditions and relief of the area plays an important role in formation of the water resources of the Republic. As a predominantly mountainous country, Azerbaijan is surrounded by the Major Caucasus, Minor Caucasus, Tallish, and North Iranian Mountains. The Kur-Araz Lowland, between the Greater and Lesser Caucasus, stretches to the Caspian Sea in the eastern part of the country. Geology. Azerbaijan has a unique tectonic environment (the Greater and Lesser Caucasus, Talysh Mts., Kur and Caspian Basins, etc.) that finds a corresponding reflection in the studied geophysical fields. Geological – geophysical data on the geological structure of Azerbaijan can shed light on the basic principles of evolution of the Earth, the distribution of economic minerals and seismic activity. Geodynamically, this region can be considered a consequence of the interaction of several microplates — fragments of the Afro-Arabian and Eurasian lithospheric plates [9].The geological structure of Azerbaijan includes complex sedimentary, metamorphic and magmatic formations, representing wide stratigraphic expansion from the Cambrian to recent eras. Most deposits are well-characterized faunistically. Simultaneously, the same age deposits undergo serious lithofacial changes in space based on the different circumstances of their formation [10].The Greater Caucasus, situated in the north of the country and stretching from the northwest to the southeast, protects the country from the direct influences of northern cold air masses. This mountain range leads to the formation of a subtropical climate on most of the foothills and plains of the country. Other mountain ranges surrounding the country also impact air circulation. The complexity of the landscape causes the non-uniform formation of climate zones and creates vertical climate zones.Physiographic conditions and different atmosphere circulations admit 8 types of air currents including: continental, sea, arctic, and tropical currents of air that formulate the climate of the Republic. The maximum annual precipitation that falls in the Lenkoran is 1,600 to 1,800 mm and the minimum in Absheron is 200 to 350 mm. A maximum daily precipitation of 334 mm was observed at the Bilieser Station in 1955. [10].Eight out of eleven existing climate types, including semi-desert, arid steppe, and mountain tundra. are present in the country. The annual average air temperature is approximately 14.6°C in the Kur-Araz lowlands and 0°C in the mountains. The absolute minimum temperature observed was –33.0°C (in Julfa and Ordubad) and an absolute maximum temperature of +46.0°C was again observed in Julfa and Ordubad. [10].
2. Method
- Sample collection and analysis. During the sample collection, handling, and preservation, the standard procedures recommended by the EPA were followed to ensure data quality and consistency. In this study, 29 river water samples were collected from April 2014 to August 2014 (Table 1).
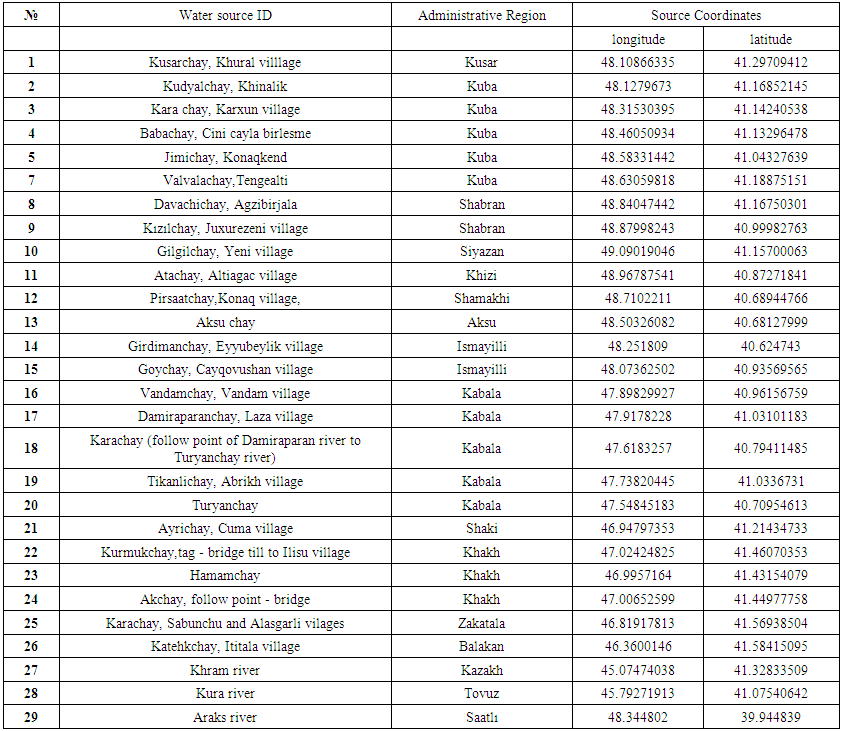 | Table 1. Water sampling points |
3. Results and Discussion
- Results of the geochemical analysis of 29 water samples were taken from rivers situated in the North of Azerbaijan and are present in Tables 2 and 4. Table 3 represents the range of change, the average of measured parameters, and the standards for humans, livestock, and irrigation. As shown in Table 2, PH changes from 7.79 to 9.34 and has the average of 8.46. For all measured water samples, pH was greater than 7 and were alkaline water samples. Out of 29, 18 samples have pH<8.5 and they may be used as drinkable water. For 10 samples, pH was less than 8.4; therefore, they are suitable for irrigation but for all measured samples, pH was higher than 7.5 and these water sources are not suitable for use as livestock drinking water. Electroconductivity of all measured samples changed from 279µS/cm till 2738µS/cm and had the average of 483µS/cm. As shown in Table 2, only two samples’ electroconductivity has a value higher than 750µS/cm. Therefore, according to the standards for the electroconductivity [13], all samples are suitable for drinking purpose, except the samples from points 10 and 29. TDS – which is equal to the sum of all dissolved ions in water, changed in the range of 166mg/L-4047mg/L and has the average of 522mg/L. Comparing the received TDS results with the standards showed that 6 water samples were not suitable for human drinking and livestock drinking purpose, while all samples complied to requested standards and may be used in irrigation. Anions and cations analysis results in samples that demonstrate that, HCO3-, Cl-, SO42-, Na+, K+, Mg2+, and Ca2+ ions dominate investigated areas. Comparison of the cation concentrations of investigated water samples showed that 16 water samples have the Ca>Mg>Na>K sequence, 5 water samples have the Na>Ca>Mg>K sequence, 6 water samples have the Ca>Na>Mg>K sequence, and 2 water samples have the Na>K>Ca>Mg sequence of cations. This means that Na ions prevail over K ions and Ca ions prevail over Mg ions for all sequences of cations. It is known that, observation of the existence of Ca and Mg in water samples is the result of the weathering of crystalline dolomitic limestones and Ca-Mg silicates (amphiboles, pyroxenes, olivine, biotite and others [4, 12, 14]. The origin of Na and K in water may be atmospheric deposition, evaporate dissolution, and silicate as albite, anorthite, orthoclase and microcline weather [4, 13, 15-17]. As it is noted in [4], if Na concentration in water is less than 50mg/L, it is not dangerous for human drinking and if it is less than 920 mg/L it is not dangerous for irrigation. For investigated water samples, the concentration of sodium changes in the range of 4.56 - 820 mg/L and has the average of 72.84mg/L. As shown in the Table 2, all water samples are suitable for irrigation and 25 samples are suitable for human drinking. 4 samples have sodium concentration higher than 50mg/L and are not suitable for human drinking [18]. K concentration obtained for water samples, changes from 0.979 mg/L to 17.64mg/L and has the average of 4.08mg/L. Comparison of potassium concentration in investigated water samples with standards (Table 3) shows that, for all samples K concentration is less than 100mg/L and these waters are suitable for drinking. 15 water sources are problematic for irrigation. The concentration of Ca for measured samples changes from 23.68 mg/L to 148 mg/L and has the average of 48.74 mg/L. If the concentration of Ca in the water is less than 800 mg/L, it has no danger for irrigation. Therefore, all measured water samples can be implemented for irrigation and using water of this standard for irrigation is not problematic for soil [4]. Considering the opinion of authors [4, 13, 16] we can note that all water samples are suitable for human drinking, except one sample (sample from point 29). The concentration of Mg for investigated samples changes in the range of 3.99 mg/L – 240 mg/L, and has the average of 25.63 mg/L. As shown in Table 3, if the concentration of Mg in water is less than 120 mg/L, this source has no danger for irrigation. Only one of the measured samples is not suitable for irrigation according to the Mg results. For human drinking water, the maximum acceptable concentration of Mg is 30 mg/L [13]. Therefore, all measured samples, except 4 samples, may be used as human drinking water. HCO3- anion concentration for investigated river waters changes in the range of 97 mg/L – 720 mg/L and has the average of 173 mg/L. Only 3 samples have more than 200 mg/L HCO3- anion concentration and cannot be used as human and livestock drinking water. The HCO3- anion concentration of 26 samples complies to the requested standards [13] and they are suitable for being used use as drinking water. But it has to be noted that, these samples are not suitable for irrigation, according to the HCO3- anion concentration rate. The concentration of Cl- ions contained in the water samples collected from rivers of Azerbaijan varied from 0.31 to 667 mg/L with the average of 43.2 mg/L (Table 2). From investigated samples, 2 samples are not suitable for human and livestock drinking and one sample is not suitable for irrigation.The concentration of SO42- ions in the measured water samples varies from 25 mg/L to 1676 mg/L with the average of 198 mg/L. Water for agriculture usage purposes has a permissible level equal to 20 mg/L for SO42- ions, according to Tables 2 and 3. Therefore, not all water samples from the investigation areas can be used for irrigation. For human and livestock drinking water, recommended levels are 200 mg/L and <250 mg/L according to [4, 11]. Therefore, all investigated water samples, except for 4 samples are suitable for usage. The suitability of water for irrigation purposes depends on its mineral constituents. Several criteria for judging its suitability have been proposed [19, 20]. Irrigation water containing large amounts of sodium is of special concern due to sodium’s effects on the soil and its potential to pose a sodium hazard. The high concentration of sodium in irrigation water may negatively affect the soil structure and decrease the soil hydraulic conductivity in fine-textured soil. The degree to which sodium will be absorbed by soil is a function of the amount of sodium to divalent cations (Ca and Mg) and is regularly stated by the sodium adsorption ratio (SAR) [21].
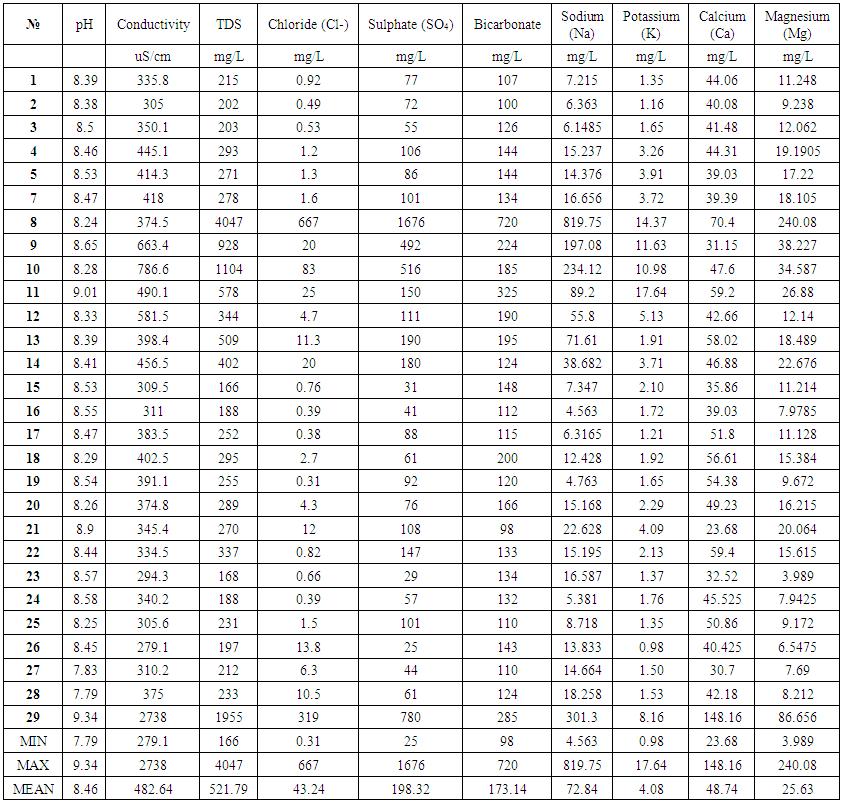 | Table 2. Data for investigated water parameters |
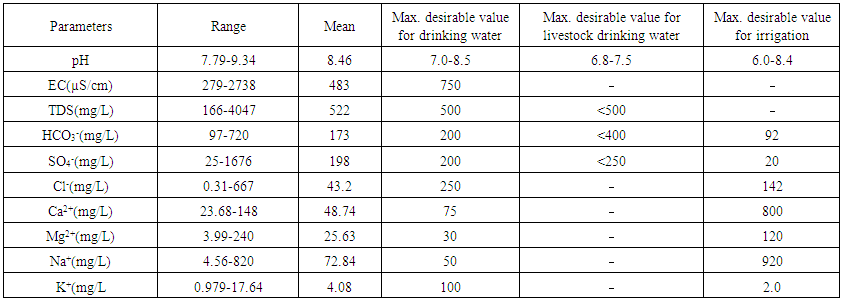 | Table 3. Geochemical parameters in the water samples compared to desirable standard values for drinking, livestock and irrigation use |
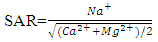 where, all the ions are expressed in meq/L.Variation from 0.156 to 10.4 with an average value of 1.53 (Table 4). Sodium Absorption Ratios for all water samples (except the sample from Devechichay river) are less than 10.The potential for sodium hazard increases in waters with higher sodium adsorption ratios (SAR) values. The sodium absorption ratio (SAR) content in the study area has shown and indicate excellent quality for irrigation; the samples fall in the excellent (S1) category while Sodium Absorption Ratios for water sample from Devechichay river are within the range of 10-18 and indicate good quality for irrigation; the samples fall in the good (S2) category (Table 4).
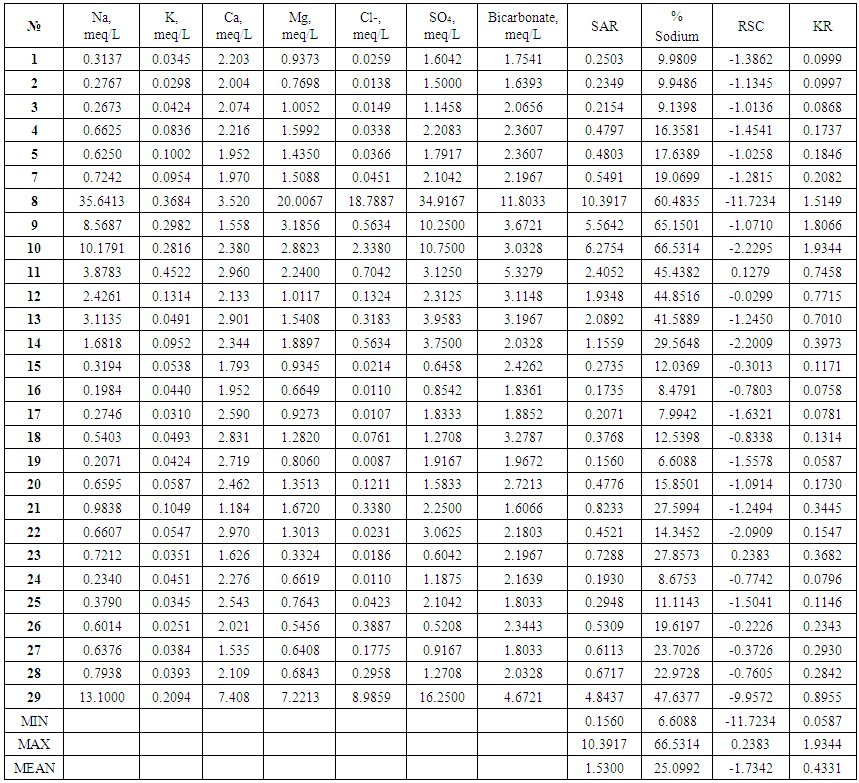 | Table 4. The results of the geochemical analysis of water samples collected from rivers of Azerbaijan |
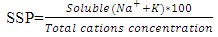 where, all the ionic concentrations are expressed in meq/L.Soluble Sodium Percent (SSP) values less than 50 or equal to 50 indicate good quality water and those more than 50 indicate water quality unsuitable for irrigation. The values of Soluble Sodium Percent (SSP) range from 6.61 to 66.53 and average 25.1. 96.6% Soluble Sodium Percent (SSP) for water in test areas is less than 50 and indicates good quality water for irrigation purposes while remaining 3.4% more than 50% and may result in sodium accumulations that will cause a breakdown in the soil’s physical properties (Table 5).KR: Sodium measured against Ca2+ and Mg2+ is used to calculate Kelley’s ratio. The formula used in the estimation of Kelley’s Ratio [19, 24] KR=Na+/ (Ca2++Mg2+)A Kelley’s Ratio (KR) of more than one indicates an excess level of sodium in waters. Hence, waters with a Kelley’s Ratio less than one are suitable for irrigation, while those with a ratio of more than one are unsuitable for irrigation. The values of Kelley’s Ratio (KR) ranges from 0.059 to 1.93 and averages 0.43. 89.7% of Kelley’s Ratio values for the water of the test area are less than 1 and indicate good quality water for irrigation purpose while remaining 10.3% more than 1 and indicate water unsuitable for irrigation (Table 5).
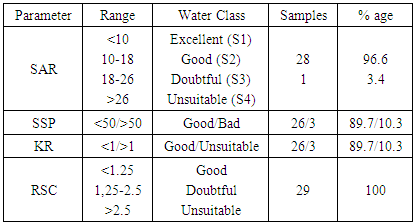 | Table 5. Classification of water based on SAR, KR, SSP and RSC |
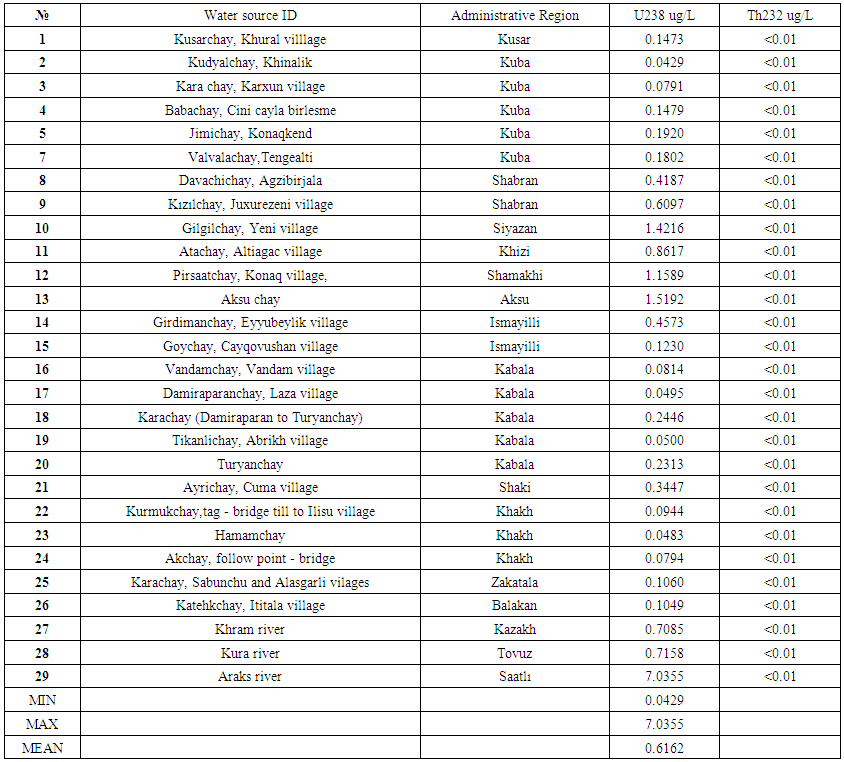 | Table 6. Uranium and Thorium Determination in Water Samples taken from rivers of Azerbaijan |
4. Conclusions
- Rivers’ waters were sampled and analysed for their hydrochemical characteristics and an evaluation of the water quality for drinking and irrigation purposes was made. The cation chemistry indicated that out of 29 water samples, 16 samples showed a dominance sequence of Ca > Na > Mg > K, 5 samples showed a dominance sequence of Na > Ca > Mg > K, 6 samples showed a dominance sequence of Ca > Na > K > Mg, and 2 samples showed a dominance sequence of Na>K>Ca>Mg. SAR values and the sodium percentage (Na %) in test locations indicate that the majority of the river water samples are suitable for use in irrigation. Hydrochemical analysis demonstrates that the samples are typical of shallow fresh waters. The EC values in all eleven rivers range from 279-2738 μS/cm. Similarly, the pH value of all the collected samples range from 7.79-9.34, comparative to the recommended WHO guideline range of 6.5-8.5 for drinking water. The anion chemistry of the analysed water samples shows HCO3-, Cl-, and SO42- to be the dominant anions at the test area. With respect to HCO3- and SO42- content, all water samples were found suitable for drinking (except for 3 samples) and livestock usage. However, all water samples exceeded the recommended limit for irrigation. With regards to Cl-, all water samples under the investigation area were found suitable for drinking (except for 2 samples from stations 8 and 29) and livestock purpose. The rest of the samples were found unsuitable for irrigation usage.From the present observations, it can be concluded that the concentration of uranium level varies considerably from natural source to natural source and place to place. The range of uranium in the water samples from different rivers varies from 0.0429 to 7.0355ug·L−1 with an average value of 0.6162ug·L−1. The measured thorium content in all water samples is less than 0.01 ug/L. However, the uranium concentration in all the water samples is well below the recommended limit of 30 μg·L−1. The daily intake of uranium through drinking water in the region is much less than the tolerable intake limit. The annual effective dose from drinking water samples of these areas is in the range of 0.02-37.78 μSv, which is safe from the health hazard point of view.