-
Paper Information
- Next Paper
- Paper Submission
-
Journal Information
- About This Journal
- Editorial Board
- Current Issue
- Archive
- Author Guidelines
- Contact Us
Resources and Environment
p-ISSN: 2163-2618 e-ISSN: 2163-2634
2018; 8(2): 21-30
doi:10.5923/j.re.20180802.01

Economic Viability of Using State-owned Wetlands as Water Reservoirs for Irrigation: A Case Study from Bangladesh
 Abstract
 Reference
 Full-Text PDF
 Full-text HTML
Santa Sarmin1, A. K. M. Nazrul Islam2
1Graduate Student, Master of Economics (Environmental Economics) Programme, Dhaka School of Economics (A Constituent Institution of the University of Dhaka), Dhaka, Bangladesh
2Associate Professor of Environmental Economics, Dhaka School of Economics (A Constituent Institution of the University of Dhaka), Dhaka, Bangladesh
Correspondence to: A. K. M. Nazrul Islam, Associate Professor of Environmental Economics, Dhaka School of Economics (A Constituent Institution of the University of Dhaka), Dhaka, Bangladesh.
| Email: |  |
Copyright © 2018 Scientific & Academic Publishing. All Rights Reserved.
This work is licensed under the Creative Commons Attribution International License (CC BY).
http://creativecommons.org/licenses/by/4.0/

Water resource has been and will also be the most crucial asset for Bangladesh like many other countries, particularly for its agriculture sector. For the sake of maintaining sustainability, heavy dependency on groundwater is going to be a major issue of concern for the country. The groundwater level in many areas shows sharp decreasing trends. This is expected to create ecological imbalance and also increase cost of agricultural production. Against this backdrop, this paper tries to assess the feasibility of a proposed excavation project to be implemented in Beel Jaleshswar, one of the largest wetlands in Jessore district of Bangladesh, to reserve surface water for irrigation and other major uses. To measure economic viability of the proposed project, this paper estimates expected costs and benefits of the project. For this purpose, data have been collected from 95 households randomly selected from the study area. The findings suggest that direct economic benefit from the proposed project is estimated to be in the tune of BDT 438.32 million annually from fish and snail catch only, while the net benefits from irrigation based on three alternative scenarios are also found to be economically highly viable.
Keywords: Groundwater, Surface Water, Wetlands, Excavation, Nature Based Solution, Social Cost Benefit Analysis
Cite this paper: Santa Sarmin, A. K. M. Nazrul Islam, Economic Viability of Using State-owned Wetlands as Water Reservoirs for Irrigation: A Case Study from Bangladesh, Resources and Environment, Vol. 8 No. 2, 2018, pp. 21-30. doi: 10.5923/j.re.20180802.01.
Article Outline
1. Introduction
- Groundwater irrigation has been most likely the major theatrical development in Bangladesh agriculture over the last 25 years (Dey et al. 2013). Groundwater levels have declined considerably along with increased groundwater contribution in irrigation during the last decade posing serious threat to the sustainable use of water in the country (Qureshi et al. 2014). But the unavailability of required irrigation water with time is emerging as a serious concern for the country particularly due to pressure from increasing irrigation water and reduction in water supply. To make the situation even worse, India recently has set to start working on the National River Linking Project (NRLP) by linking water from the Ganga and the Brahmaputra which is expected to channel water away from the downstream country that potentially can dry out large of Bangladesh during the dry season. This may affect as many as 53 rivers of Bangladesh which have flown down from India by intensifying desertification, loss of river flows and navigability, intrusion of saline water into farm lands and most importantly making irrigation water more scare for Bangladesh during the dry season, if any political solution of rightful share of water cannot be ensured. In addition to groundwater and rivers which serve as suppliers of water resources for Bangladesh, there is a vast area (574,356 acres) of wetlands which are the source of fisheries, aquatic vegetations and other biodiversity, irrigation and navigation services, etc. for the country. Out of 34,681 government-owned wetlands, 9,801 (28%) are leased out to private ownership for certain periods (MoL, 2017). Although the very idea behind leasing out wetlands among fishermen following the ‘Jal Jar, Jola Tar1’ policy was a noble idea, in reality people who are getting access to such wetlands are ‘local rich and politically influential’ section who often end up employing ‘real fishermen’ as labors in their fisheries. Fish cultivation (culture fisheries) in wetlands like beels1, jheels1, canals, or other types of open waterbodies deprives access to wetland resources and services by most common stakeholders, many of whom (the local poor) are heavily dependent on wetlands for their livelihoods and nutrition. In addition, it causes the loss of wetland-based biodiversity, including indigenous local fishes, which often face serious threats from such malpractices. Further, conversion of wetlands for other purposes also reduces the possibility of using water from wetlands for irrigation and other household purposes.There have been many studies on depleting state of groundwater table and changing patterns of irrigation and its increasing cost in Bangladesh. Different non-government organizations (NGOs) in association with relevant government departments are successfully running various community managed projects in the country, including management of wetlands. But not many studies are available on managing wetlands as water reservoirs for irrigation purpose, which perhaps is an area that needs to explore seriously by the agriculture sector in Bangladesh considering the fast depletion of underground water layers and increasing scarcity of surface water in the country.The critical problem of groundwater depletion can be countered through sufficient recharge by surface water flow and rain water, but such possibilities are not really so high in the present context. There can be fewer substitutes for surface water in the long run for irrigation and other uses. Thus, we need to be smart enough to think both economical and environmental perspectives of water use for irrigation from now. The vast area of wetlands can also be a major source of irrigation during the dry season in the country, if they are properly managed. Water reserve capacity in the country can be enhanced tremendously by little excavation and undertaking proper maintenance mechanism. Against this backdrop, the present paper tries to assess the economic viability of using a state-owned wetland as a ‘water reservoir’ under community management for irrigation purposes. To undertake a benefit-cost analysis of a proposed water reservoir project at the community level for government owned wetlands: to evaluate the effect of irrigation cost on the irrigated crop production; and to assess the economic viability of a government owned wetland as water reservoir project.
2. Literature Review
- Rahman et al. (2016) conducted a study to access the groundwater level fluctuation and impacts on irrigation cost of Jessore Sadar and Jhikargacha Upazillas. From the secondary data collected from BADC (Bangladesh Agricultural Development Corporation), it was found that the trends of maximum fluctuation level increased from 5.65 to 9.35m and 5.1 to 8.36m at Jessore Sadar and Jhikargacha respectively from April 2004 to April 2013. From the study it was also found that groundwater level fluctuation mostly affects the shallow tube-well (STW) irrigation. Another study by Dey et al. (2015) suggested that groundwater use was not sustainable in the Barind region and there was overexploitation of groundwater without having sufficient recharging of the aquifers. The findings also showed that the declining trend of average annual river water level is positively related with the decreasing trend of groundwater table. The combined annual flow of the surface water passing through Bangladesh is in the range of 1,200 to 1,500 billion m3. The sediment discharge is in the range of 1.2 to 1.7 billion tonnes which originates outside the country (Ali, 2002). This huge amount of transboundary monsoon flow along with local downstream run-off causes floods in Bangladesh almost in every year. Khondoker et al. (2014) revealed that though a considerable part of Beel Bakar in Jessore and its floodplain is under gher1 culture, still there is scope to ensure protection and to enhance livelihoods of fisher community. The study also found that excessive gher culture practice and possession of non-fishermen over the waterbody are the main constrains of the beel. The declining trend of groundwater table in Bangladesh is expected to contribute to the crisis of water availability in near future for pure drinking water, household and industrial uses and most importantly irrigation purpose. In addition, there is the uncertainty of the rightful water share of the Transboundary Rivers as a downstream country, which poses a direct threat to the surface water flow of Bangladesh. It is likely to be wiser to think about exploring the possibility of using more of surface water and rainwater sources instead of over-extracting country’s underground aquifers.
3. Research Methodology
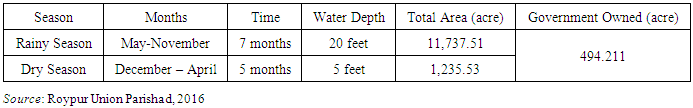
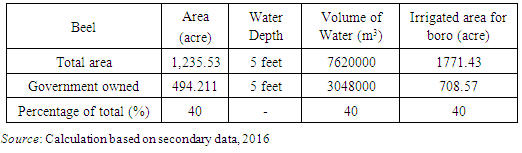
- Study AreaThe Beel Jaleshwar belongs to both Jessor Sadar Upazilla and Bagherpara Upazila. Ichali and Fatepur unions of the Jessor Sadar Upazilla; Roypur, Dorajhat union of Bagherpara Upazila cover the beel area (Table 3.1). It is adjacent to 25 villages with approximately 25,000 dependent population and 5,980 households. This beel is linked with 5 rivers through 18-20 khal.
|
|
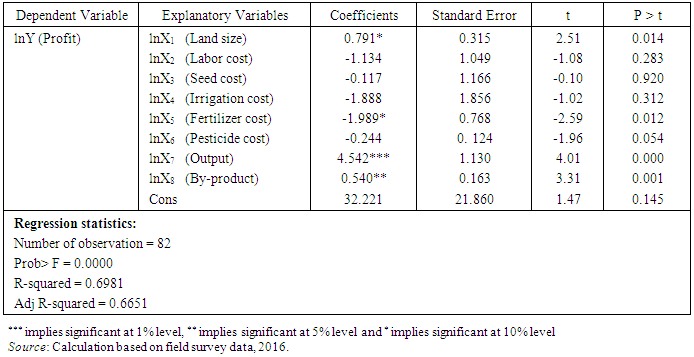
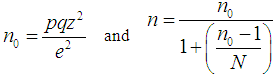 Where, p = 0.5q = 0.5z = Standardized normal distribution table (95% confidence level with z value of 1.96)e = Admissible error level (10% level of error i.e. e = 0.1)n0 = Rough sample sizen = Finite population correlation (FPC)N = Total population (5,980 Households) Methods of Data CollectionPrimary data have been collected from the study area based on a questionnaire survey. Further, focus group discussions (FGDs) and key informant interviews (KIIs) are also conducted on direct users of the wetlands and other important stakeholders or experts to get supplementary information on the proposed excavation project. Secondary data have been accumulated from related organizations like BBS (Bangladesh Bureau of Statistics) and BADC (Bangladesh Agricultural Development Corporation) through literature review.Methods of Data AnalysisDescriptive Analytical ToolThe demographic features of the respondents, groundwater table and irrigation costs have been analyzed using measures of central tendency and measures of dispersion along with graphical presentations. Statistical ModelTo show the past trend of groundwater table and forecast future condition, this study has used Microsoft Excel for time series data analysis. To evaluate the weight of groundwater irrigation cost on crop profitability, the following multivariate linear regression model is used:Y = β0 + β1X1 + β2X2 + β3X3 + β4X4 + β5X5 + β6X6 + β7X7 + β8X8 + eWhere,Y = Profit per acre (BDT);X5 = Fertilizer cost (BDT);β0 = Intercept term;X6 = Pesticide cost (BDT);X1 = Land size (acre);X7 = Output (Maund);X2 = Labor cost (BDT);X8 = Byproduct (BDT);X3 = Seed cost (BDT);e = Stochastic error term.X4 = Irrigation cost (BDT);All explanatory variables, except for farm size are divided by land size to place them on per acre basis. The multivariate linear regression model using a log-log functional form is then reconstructed and analyzed by using a ordinary least square (OLS) method with the help of STATA 12.0. The simple linear regression model reconstructed is as follows:lnY = β0 + β1lnX1 + β2lnX2 + β3lnX3 + β4lnX4 + β5lnX5 + β6lnX6 + β7lnX7 + β8lnX8 +eIndicatorsFarmer’s Benefit-Cost Ratio (BCR): In addition, an indicator of farmers benefit cost ratio can be calculated here based on the following equation. This indicator is used in World Bank (2000) as agricultural performance indicator:
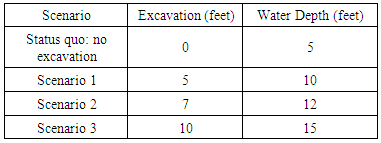
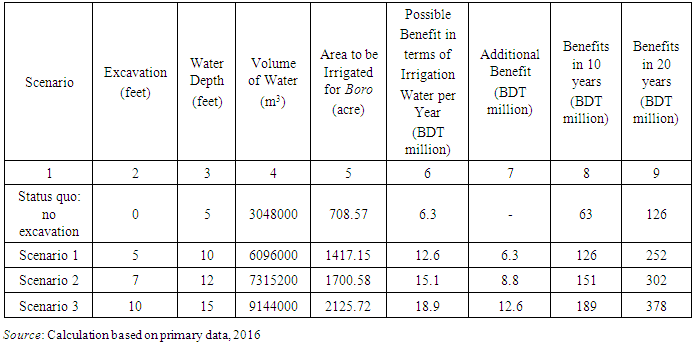
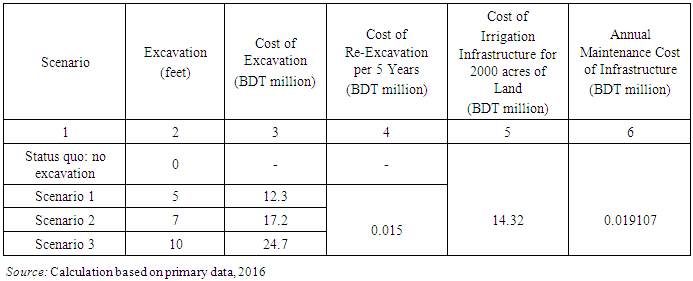
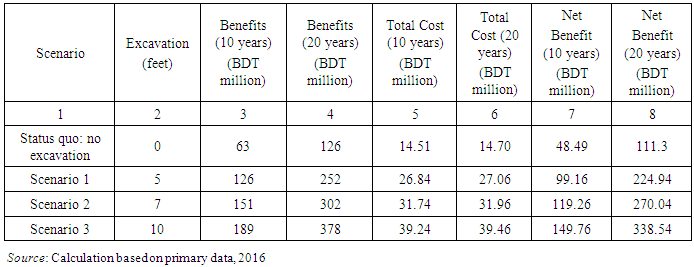
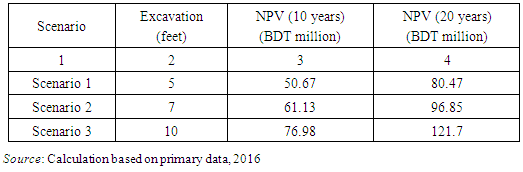
 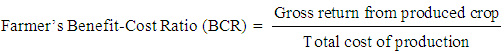 Cost-Benefit AnalysisThe economic viability of the proposed project has been scrutinized by employing a Social Cost Benefit Analysis (SCBA). The possible direct economic benefits and costs of the wetland excavation and surface water irrigation project are calculated as below. There are two tools that have been used in this research paper to reach the conclusion.Benefit (B) = Value of reserved water for irrigation Cost (C) = Excavation cost of wetland+ Re-excavation cost + Irrigation infrastructure + Maintenance cost Net Benefit: Net Benefit = Benefit (B) – Cost (C); If (B-C) is positive, the project is economically viable.Net Present Value (NPV): Net present values of the different scenarios (table 3.2) of the project are calculated to get the discounted value of the benefit of the proposed project.
  Here, C0 = Initial cash outflow (Excavation cost of wetland and Irrigation infrastructure)Bi = Benefit in year i (Value of reserved water for irrigation)Ci = Cost in year i (Maintenance cost and Re-excavation cost)r = Social discount rate = 10%Rationale for Social Discount Rate: For a private investment project, the rate of discount in NPV calculation is influenced by the rate of interest that could be obtained on the investment. However, in the case of public-owned projects, it is more appropriate to use a social rate of discount (WRC, 2010). By employing a Monte Carlo Simulation, Jalil (2010) concluded that 9-11% should be used as optimal social discount rate for various long term projects in Bangladesh. The discount rate is similar to the ones used by Government of Pakistan, India and China. Besides, a discount rate of 12 percent is assumed in “Economic Modeling of Climate Change Adaptation: Needs for Physical Infrastructures in Bangladesh” (MoEF, 2008). As per 2016, a social discount rate of 10 percent is assumed to calculate NPV of the Beel Jaleshwar excavation and surface water irrigation project.
4. Results and Discussion
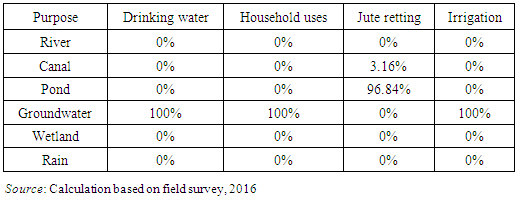
- Groundwater and Its Uses in JessoreFigure 4.1 shows the average groundwater trend in Beel Jaleshwar area and its adjacent 4 unions of Bagherpara and Jessore Sadar Upazila from 1881 to 2010. The unions are Roypur, Dorajhat, Ichali and Fatepur. The groundwater level in area of Beel Jaleshwar was 9 feet in 1981 which decreased to 28 feet in 2010. Though fluctuating, the overall groundwater level is showing a decreasing pattern.
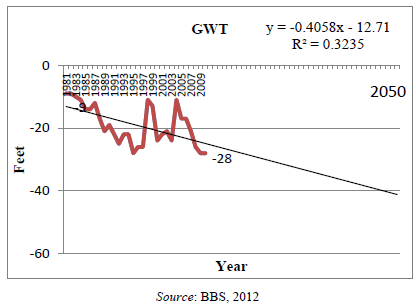 | Figure 4.1. Groundwater Level in Beel Jaleshwar Area |
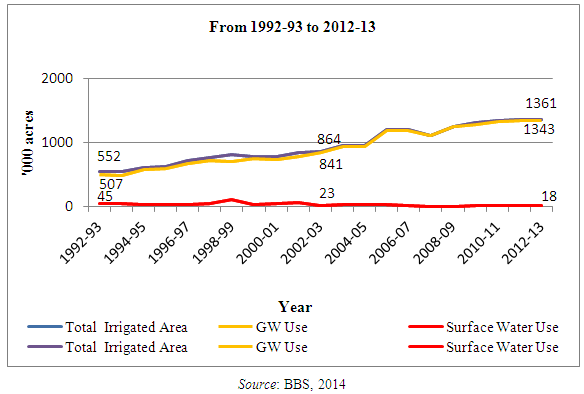 | Figure 4.2. Irrigated Area under Groundwater and Surface Water in Jessore (in ‘000 acres) |
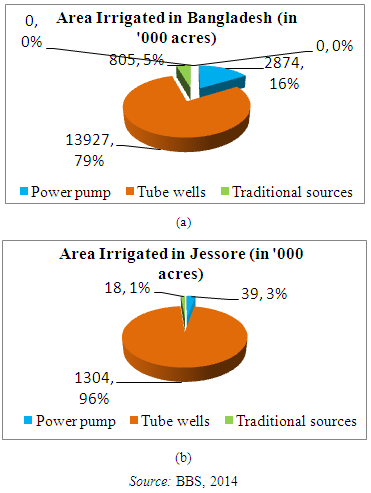 | Figure 4.3. Irrigation under Different Means in 2012-13 |
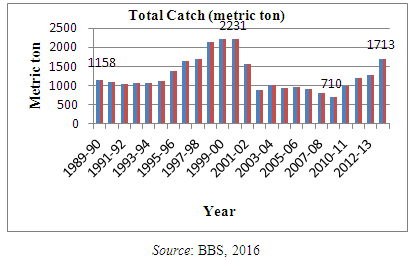 | Figure 4.4. Annual Fish Production from Beel Fisheries in Jessore |
|
|
|
|
|
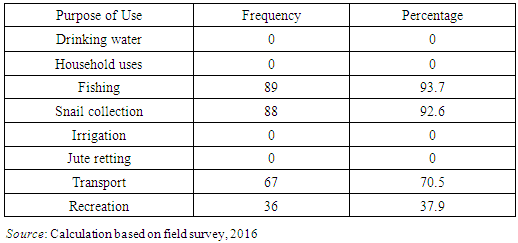
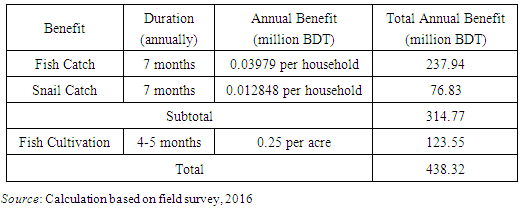
 Direct Economic Benefits from Beel JaleshwarThe duration for fishing and snail catch in a year is 7 months including rainy season namely June to December. On an average a household collects 278.9 kg of fish and 1,466.32 kg of snail per year which leads to a total benefit of BDT 52,638. Benefit from fish catch (BDT 39,790) is greater than that of snail catch (BDT 12,848). From this information, total benefit from the beel of its dependent people can be calculated as BDT 314.77 million. This benefit is shared between 75.6 percent from fish catch and 24.4 percent from snail collection. The fish cultivation is mostly occurred in the government-owned lands in the beel along with the private lands. This type of farming is done by digging large ponds into the deep areas. On average one acre of land provides BDT 2.5 lakh or BDT 0.25 million of net benefit. Thus, only from the government owned 494.211 acres the total annual benefit is calculated as BDT 123.55 million. Table 4.10 depicts the total view of the direct benefits. The direct benefit from the beel of its dependent people can be calculated as BDT 438.32 million annually.
|
|
|
|
|
|
5. Conclusions
- Bangladesh is gifted with as many as 26,275 wetlands which have a total area of 574,356 acres. If the government-owned wetlands can be excavated enough to store rainwater in the monsoon and use the stored water to irrigate cultivable lands in the dry season, it may solve both the problems of overflow in the rainy season and scarcity of water in the dry season of a year. In addition, this practice is expected to lessen the pressure on the over-use of groundwater for the irrigation purpose. This study proves that long term excavation projects on government-owned wetlands are more profitable than short term projects and thus can maximize social benefits. From the environmental context, this is more sustainable than to maintain waterbodies with their natural flows beyond economic gains.This paper recommends a proposed excavation project to be implemented in the government-owned area of Beel Jaleshwar with an objective to provide irrigation water in the adjacent areas during the dry season. It can also be suggested that the maintenance of the beel should be unto the dependent community for better management.
Notes
- 1. Leasing out wetlands to fishermen, who are the owners of fishing nets. 2. The project was run by the Implementation Monitoring and Evaluation Division (IMED) of the Government of Bangladesh and sponsored by the Ministry of Agriculture covering 22 districts of the country i.e. Manikgonj, Munshigonj, Narayangonj, Norsingdi, Lakshmipur, Comilla, Chandpur, Brahmanbaria, Hobigonj, Sunamgonj, Chittagong, Cox's Bazar, Kishoregonj, Netrokona, Mymensingh, Jamalpur, Barisal, Bhola, Patuakhali, Madaripur, Gopalgonj & Shariatpur. The main objective of the project was to irrigate land through surface water by utilization of 5-cusec pumps and floating pumps through double lifting.