-
Paper Information
- Paper Submission
-
Journal Information
- About This Journal
- Editorial Board
- Current Issue
- Archive
- Author Guidelines
- Contact Us
Resources and Environment
p-ISSN: 2163-2618 e-ISSN: 2163-2634
2018; 8(1): 6-13
doi:10.5923/j.re.20180801.02

Determination of Soils Erodibility Factor (K) for Selected Sites in Imo State, Nigeria
 Abstract
 Reference
 Full-Text PDF
 Full-text HTML
Okorafor O. O.1, Akinbile C. O.2, Adeyemo A. J.3
1Department of Agricultural and Bioresources Engineering, Federal University of Technology, Owerri, Nigeria
2Department of Agricultural and Environmental Engineering, Federal University of Technology, Akure, Nigeria
3Department of Crop Storage and Pest Management, Federal University of Technology, Akure, Nigeria
Correspondence to: Okorafor O. O., Department of Agricultural and Bioresources Engineering, Federal University of Technology, Owerri, Nigeria.
| Email: |  |
Copyright © 2018 Scientific & Academic Publishing. All Rights Reserved.
This work is licensed under the Creative Commons Attribution International License (CC BY).
http://creativecommons.org/licenses/by/4.0/

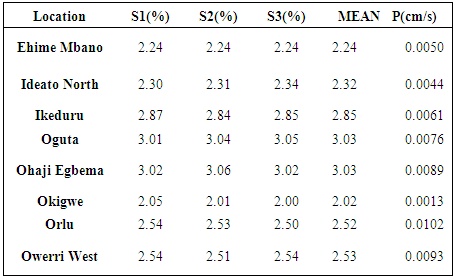
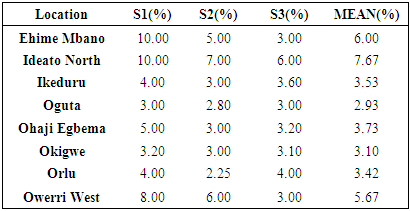
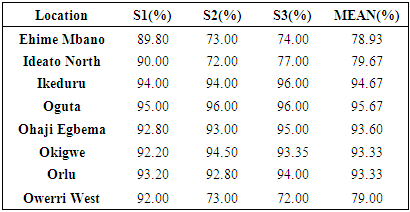
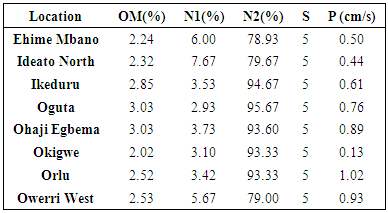
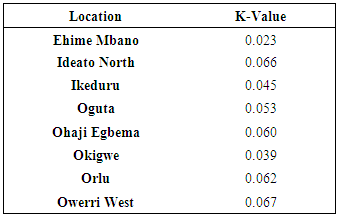
The incidence of erosion in the southeastern part of the country is prevalent and numerous with minimal solutions available to ameliorate its consequences thus reducing the assurances of food security. This study aims at determining the erodibility factor (K) of selected soils in Imo State by measuring parameters such as grain-size distribution, soil structure and texture classification, hydraulic conductivity and organic matter content of soils using standard procedures. The study area soil map was generated from Landsat Imaging and soil samples were collected from eight (8) locations (Ehime Mbano, Ideato North, Ikeduru, Oguta, Ohaji-Egbema, Okigwe, Orlu and Owerri West Local Government Areas). The K-Values obtained for each of the locations are as follows, 0.023, 0.066, 0.045, 0.053, 0.060, 0.039, 0.062 and 0.067 respectively. Ideato North, Ohaji-Egbema, Orlu and Owerri West has the highest K-values of 0.066, 0.053, 0.060, 0.062 and 0.067 while Ehime Mbano, Okigwe and Ikeduru have low to moderate K-values of 0.023, 0.045 and 0.039 respectively all based on standard erodibility indices. The study also implies that areas with high erodibility factor represent areas that have high propensity to erosion or have been eroded while areas showing low to moderate erodibility factor depict areas that have low incidences of erosion. Nevertheless, if all areas (areas with low, moderate and high K values) are properly maintained, managed and conserved fertility levels can be boosted to guarantee assurances for food security.
Keywords: Soils, Erosion, Erodibility, Erodibility factor, USLE
Cite this paper: Okorafor O. O., Akinbile C. O., Adeyemo A. J., Determination of Soils Erodibility Factor (K) for Selected Sites in Imo State, Nigeria, Resources and Environment, Vol. 8 No. 1, 2018, pp. 6-13. doi: 10.5923/j.re.20180801.02.
Article Outline
1. Introduction
- Agricultural soils are the richest supply of nutrients for plant growth and production because of the presence of organic matter and humus which support microbial activities which result in proper soil aeration and good drainage conditions for water movement which enable plants to grow and yield expected outputs. Soil being a key factor of production is subject to degradation due to environmental and human activities which prevents it from offering the expected quality; this particularly is as a result of erosion. It not only causes severe land degradation and soil productivity loss, but also threatens the stability and health of society in general, and sustainable development of rural areas in particular [1]. Soils comprise of minerals, organic matter, nutrients, moisture and living organisms which support growth and ascertain the fertility of the soil for food production, this particular property of the soil is threatened when it undergoes degradation by erosive actions. Erosion is one of the surface processes that sculptures the earth’s landscape and constitutes one of the global environmental problems [2]. Soil erosion is a natural process of soil material removal and transportation through the action of erosive agents such as water, wind, gravity, and human disturbance [3]. The problem of soil erosion has really aided in declining the quality of arable land in generating food crops for export and human consumption thus preventing guaranteed food security in the country.In increasing food production to keep pace with demand while retaining the quality of land and the ecological balance of the production systems are the current challenges to agricultural research and development policy in Nigeria [4]. Currently, efforts to achieve sustainable agricultural development and food self-sufficiency in the country are threatened by widespread environmental degradation resulting from soil erosion menace, characterized by massive soil loss estimated at 30 million tons per annum [5-7]. Erosion is prevalent in all parts of the country as it is experienced in no smaller degree in almost every geo-political region of the country, with specific impact in southeastern part of Nigeria. [8] states that degradation of natural resources in Anambra State and almost everywhere in Nigeria is one of the greatest threats to future food production capabilities and sustained development. In Nigeria desertification and aridity are the major environmental problems of the northern part of the country while the torrential rainfall of the southern Nigeria creates enabling environment for catastrophic soil erosion in the region. The greatest threat to environmental settings of southeastern Nigeria is the gradual but constant dissection of the landscape by soil erosion [9].Soil erosion occurs when the ability of the soil to withstand agents of denudation is overcome; this ability is regarded as soil erodibility. Erodibility is the resistance of the soil to detachment and transport [10]. Soil erodibilty is the susceptibility or vulnerability of a soil detachment by rainfall and or surface flow by runoff/surface flow force [11, 12]. Soil erodibility. Soil erodiblity index is one of the factors of the Universal Soil Loss Equation (USLE), which according to [13] states;
 | (1) |
2. Materials and Methods
2.1. Position and Climatic Conditions of Study Area
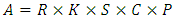
- The study area, Imo State, Nigeria, lies within Latitude 5°45′N - 5°15′N and Longitude 6°45′E - 7°15′E. The study area is within the rain forest belt of Nigeria. Two distinct conditions (i.e. wet and dry seasons) exist within the region. These two regimes are derived from the different air masses prevailing over the country at different times of the year namely; the dry northeasterly air mass (north east trade wind) of Saharan origin and the humid maritime air mass (south west trade wind) originating from the South Atlantic. The rainfall pattern in the area is oscillatory, bimodal and usually has two peaks within the year. The peaks vary between June, July and September. The region falls within the rain forest zone, so it experiences annual rainfall ranges from 1600 to 2900 mm [17]. The wet season begins in April and ends in October with a short recess in August usually referred to as August break. The dry season starts in November and ends in March. Monthly temperature is highest in February with a value of 30.1°C while the lowest is 26.7°C which is recorded in August, but mean monthly temperatures vary between 25-32°C with a relative humidity range of 75 - 90% [18].
2.2. Vegetation, Soil, Geology and Groundwater Development of Study Area
- The high temperature and humidity experienced in the state favour luxuriant plant growth produce the climax vegetation of the tropical rain forest, thus causing the watershed to be covered by depleted rain forest shrubs having thick underbrushes, creeping vines and deep green vegetation which is as a result of heavy decay of plant droppings and foliage [19]. The watershed or study area is dominated by sandy soil with little percentages of clay, loam and silt. The area is acidic with pH of between 4.67-5.6 for upper and lower layers and 5.0 - 5.6 at the crest and valley bottom and lower at midslope [20]. The watershed also in addition has low organic carbon ranging between 0.676 - 3.764 mg/kg for upper soil layer, 5.34 - 4.27 mg/kg for lower soil layer and lower at the midslope, low nitrogen concentration range of 0.008 - 0.068 % and 0.018-0.048 % for upper and lower soil layers. The soil type within this zone belongs to ferralic group because of the presence of Iron (Fe) and its related nitrides. The soil profile is remarkably uniform throughout the area, deeply weathered and intensely leached. The study area is based on a bedrock of a sequence of sedimentary rocks of about 5480m thick, with two major classes of formation underlying the Imo River Basin of which 80% consists of coastal plain sand, which is composed of non-indurated sediments represented by the Benin and Ogwashi-Asaba formations and alluvial deposits, while the remaining 20% is underlain by series sedimentary rock units [21]. The formation summarily consists of sand (fine-medium coarsed grained and poorly sorted), sand stones and gravels with intercalations of clay and sandy-clay [22]. The study area is drained by two rivers, namely the Otamiri and Nworie. The Otamiri River has maximum average flow of 10.7 m3/s in the rainy season (September - October) and a minimum average flow of about 3.4 m3/s in the dry season (November - February), The total annual discharge of the Otamiri is about 1.7 x 10⁸ m3, and 22 percent of this (3.74 x l07 m3) comes from direct runoff from rainwater and constitutes the safe yield of the river. The depth to groundwater varies from 15m - 35m in parts of the Owerri urban area. The aquifers have reasonable thickness and are extensive [18, 19].
 | Figure 1. Position and Location of Study Area (Source: Wired-Job Services) |
3. Data Collection
3.1. Soil Classification Map
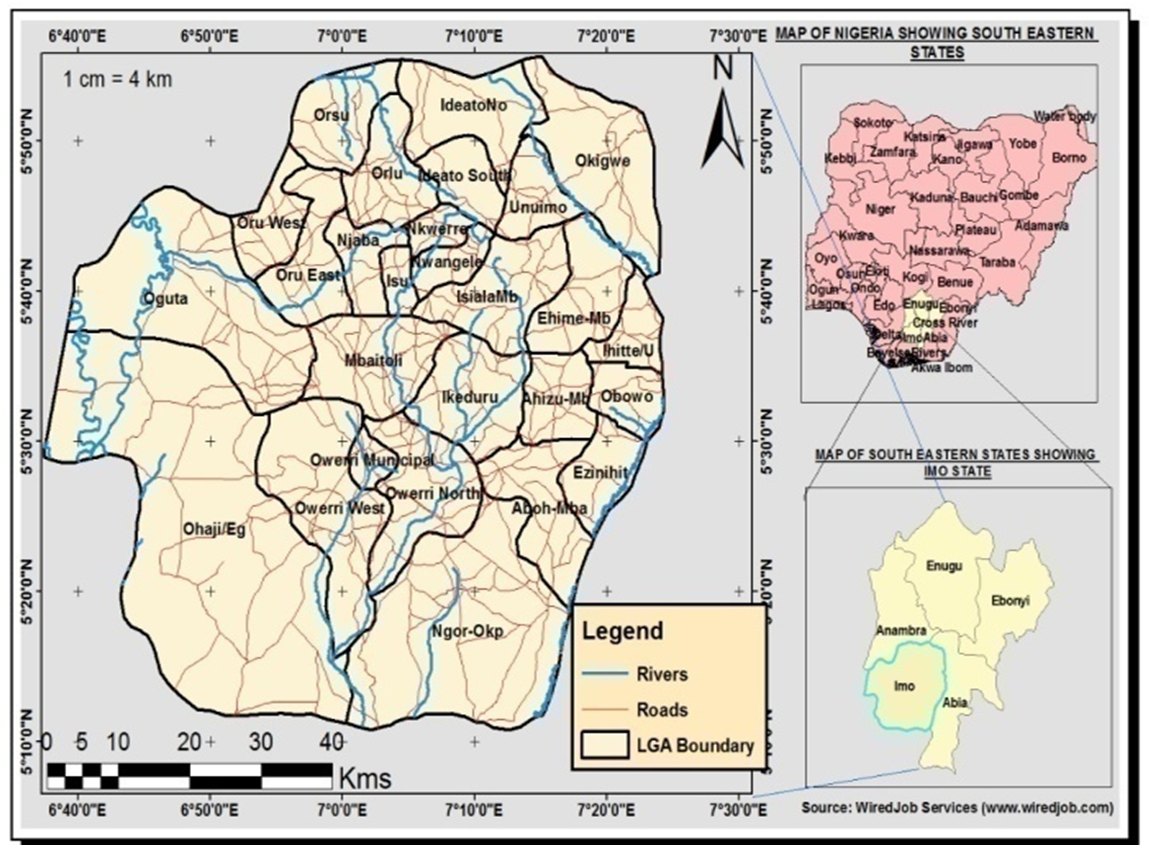
- The primary source of Soil map for the study area was generated from Nigeria Geological Survey, Centre. The co-ordinates (Longitude and Latitude) of the study area was used to extract the geological and mineral map from the enlarged soil map of Nigeria. Then the section extracted was imported into ArcGIS 10.1 and was geo-referenced under the WGS84 Cordinate System to give it a spatial attribute. The study area, Imo State was masked from it .Based on the digitized map, Imo State is divided into the following soil regions;- Clay and Shales (Ebenebe and Umuna sandstones) – Palaocene- Clayey sands and shales (Bende, Ameke and Nanka stones) – Eocene- Sand stones (Imo formation Inc) – Palaocene- Sand stones, Limestone and coal (Upper coal measures) – Maestriclitian-Danian- Sands and clay (Coastal plains sands) – Plio-pleistocene- Sands, gravel and clay (Meander belts) – Holocene- Clay, sandstones, lignite and shales (Lignite formation) – Eocene- Sands, clay and swamps (Sombreiro Deltaic plane) – Pleistocene-Holocene- River alluviumFrom the soil regions identified within the study area by the soil map different locations were selected for soil sampling. The soil samples were collected in triplicate at varying distances for each location with the use of a global positioning system (G.P.S) and soil collection vessels so as to prevent duplication of soil collection points. Figure 2 shows the soil map of Imo State.
 | Figure 2. Soil Map of Imo State |
 | (2) |
4. Results and Discussion
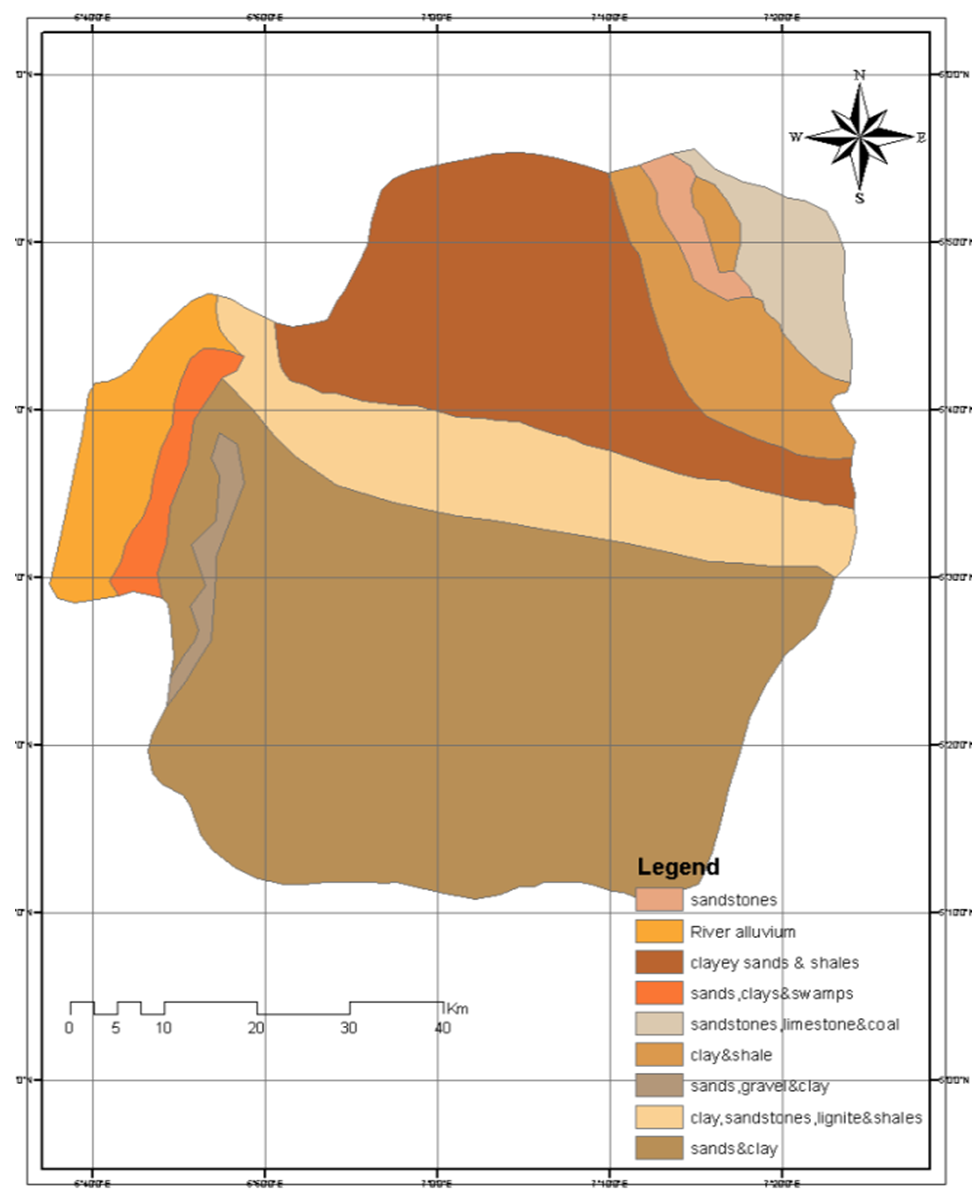
- The position and location of each sample is presented in Table 1.
|
|
|
|
|
|
|
|
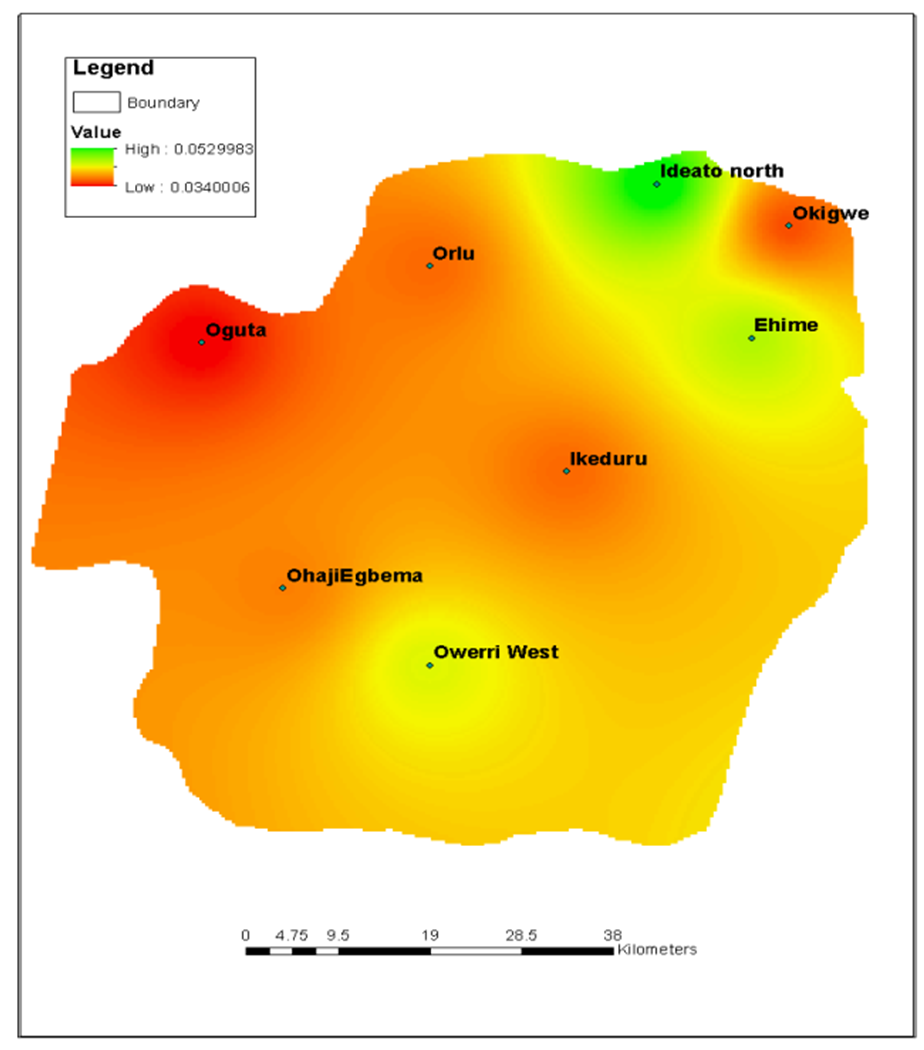 | Figure 3. Soil Erodibility Map of Imo State |
5. Conclusions
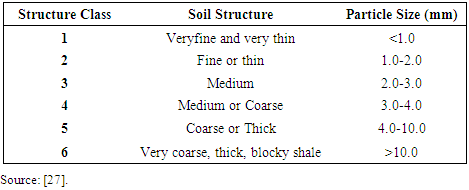
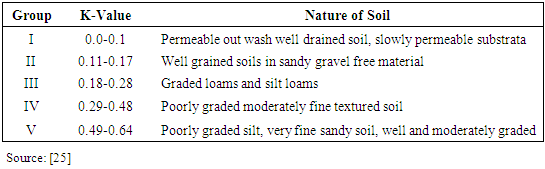
- From the K-Values obtained for all the locations, the locations with the highest K-values are Owerri West, Ideato North, Orlu and Ohaji-Egbema which are 0.067, 0.066, 0.062 and 0.060 respectively, this concurs with the reconnaissance survey carried out within the study area depicting that those areas specifically have the highest incidences of gullies in Imo State. Okigwe, Ikeduru and Oguta showed moderate K-values of 0.039, 0.045 and 0.053 while Ehime Mbano showed the least K-value of 0.023. From the Table of standard erodibility indices all the soils fell into group 1, which implies that the soils in Imo State are permeable outwash well drained soils with permeable sub-strata. The data obtained from this study is a knowledge base reference for design of control structures which will be necessary for soil conservation and management practices within the study area.
ACKNOWLEDGEMENTS
- The research was supported by TETFUND (Tertiary Education Trust Fund). The authors are grateful to the personnel of the Federal University of Technology Owerri (FUTO) Erosion Research Institute for all the experimental analysis and field observations.