-
Paper Information
- Paper Submission
-
Journal Information
- About This Journal
- Editorial Board
- Current Issue
- Archive
- Author Guidelines
- Contact Us
Resources and Environment
p-ISSN: 2163-2618 e-ISSN: 2163-2634
2018; 8(1): 1-5
doi:10.5923/j.re.20180801.01

The Analysis of the Physical and Chemical Properties of the Water Quality in the Rainy Season in the Sumber Maron River - Kepanjen, Malang - Indonesia
 Abstract
 Reference
 Full-Text PDF
 Full-text HTML
Faiza Tawati1, Yenny Risjani2, M. Sasmito Djati3, Bagyo Yanuwiadi4, Amin Setyo Leksono4
1Doctorate Program of Environmental Science, Brawijaya University, Malang, Indonesia
2Faculty of Fisheries and Marine Science, Brawijaya University, Malang, Indonesia
3Department of Biology, Faculty of Science, Brawijaya University, Malang, Indonesia
4Department of Biology, Faculty of Mathematic and Natural Science, Brawijaya University, Malang, Indonesia
Correspondence to: Faiza Tawati, Doctorate Program of Environmental Science, Brawijaya University, Malang, Indonesia.
| Email: |  |
Copyright © 2018 Scientific & Academic Publishing. All Rights Reserved.
This work is licensed under the Creative Commons Attribution International License (CC BY).
http://creativecommons.org/licenses/by/4.0/

Changes in the chemical and physical properties of water are one of the causes of water pollution. These changes are also an indicator of water quality. The purpose of this study is to analyze water quality in the Sumber Maron River located in Kepanjen, Malang. Three sampling sites were selected spatially along the waterway to reflect the activities that could possibly influence the quality of river water. In the rainy season (December 2016), water samples were collected from the three sites including site (A), (B) and (C). In order to understand the physical and chemical properties of river water quality, 9 water quality standards: temperature, electrical conductivity, pH, total solids, total suspended solids, total solids and alkali, calcium, magnesium, sodium, dissolved oxygen, chemical oxygen demand and salinity were analyzed. The results indicated that COD and TDS are higher than the permissible limits in the Global Health Facility, while all the parameters of water quality are within the FAO standard for irrigation purposes. Thus, the water is not adequate for domestic purposes, while it is useful for agricultural purposes.
Keywords: Sumber Maron river, Water quality, Parameters, Water pollution
Cite this paper: Faiza Tawati, Yenny Risjani, M. Sasmito Djati, Bagyo Yanuwiadi, Amin Setyo Leksono, The Analysis of the Physical and Chemical Properties of the Water Quality in the Rainy Season in the Sumber Maron River - Kepanjen, Malang - Indonesia, Resources and Environment, Vol. 8 No. 1, 2018, pp. 1-5. doi: 10.5923/j.re.20180801.01.
Article Outline
1. Introduction
- Water is important for natural ecosystems and human development. It is important for various activities such as drinking, cooking, industry, agriculture and recreation. In the human body, it is also used to transport, dissolve organic matter and add nutrients while carrying waste materials [1]. River is a vital component of the biosphere containing less than one percent of the world's freshwater with its higher ecological and social significance which are being polluted by indiscriminate disposal of sewerage waste, indiscriminate industrial waste, and by human activities that affect their physical and chemical characteristics and lead to various damaging effects on aquatic organisms [2]. Water quality provides up-to-date information about the concentration of various solutes in a particular place and time. The quality parameters provide a basis for assessing the suitability of water for designated use and to improve existing conditions [3]. There is no single or simple measure for water quality. The nature and level of water pollution is characterized by several physical, chemical and biological parameters [4]. The deterioration of water quality has led to the destruction of ecosystem balance, contamination and contamination of soil and surface water sources. Water quality can be regarded as a variable network such as pH, oxygen concentration, temperature, etc. and any changes in these physical and chemical variables can affect aquatic biota in various ways [5]. Since water quality is directly related to health and important for the determination of water utilities, it is very important and important to test water quality before being used for drinking, domestic, agricultural or industrial purposes. The use of river water for various purposes is governed by physicochemical and biological qualities of water [6]. Rivers are the most important freshwater source for humans. The social, economic and political developments, in the past, were largely related to the availability and distribution of fresh water contained in river systems. The use of main river water includes drinking water supply sources, irrigation of agricultural land, industrial and municipal water supply, industrial and municipal waste disposal, navigation, fishery, recreational boating and body recreation [7].A number of previous studies have been conducted to analyze the quality of river water according to the parameter level. A study conducted by [8], analyzed physico-chemical parameters and its pollution implications of Elala river in Africa and showed that 9 of the parameters were above the prescribed limit of WHO guidelines for drinking purposes, fell within the FAO standard limit for irrigation. Another study done by [9]., assessed physico-chemical and bacteriological investigation on the river Cauvery of Kollegal stretch in Karnataka and found that the physico-chemical parameters showed that the pH, Conductance, Alkalinity and Hardness, DO, BOD and COD levels indicate the absence of major organic pollution sources and that river water was not polluted. Similarly, Sumber Maron river located in Kepanjen sub-district is an area that attracts tourists and visitors. This is one of ecotourism located in the south of Malang where there are animals and natural plants of a tropical climate characterized by heavy rain, high humidity, and high temperatures. The rainy season is from October to March, while the dry season is from April to September with rainfall ranges from 180-320cm (70-125) to 610 cm (240). Thus, Sumber Maron River is widely used for domestic purposes, recreation, drinking and irrigation in the area which result in municipal waste, cars wash waste, and other domestic waste. Therefore, continuous monitoring of pollutant loads in this river water is necessary to protect public health from the dangerous use of this water. Therefore, this study aims to focus on the quality of chemical physiology of the Sumber Maron river water and the effects of pollutants during the rainy season, providing recommendations for promoting sustainable water use [10].
2. Materials and Methods
2.1. Description of the Study Area
- The study was carried out in “Sumber Maron River” one of tourism objects with a clear source of water and small waterfall as its main attraction located in Kepanjen, Malang Indonesia. Local people used the area around Sumber Maron as a cultivation area of paddy plants, bathing and washing place, a tourist attraction. The 18 sampling points of the study area were randomly selected using GPS (global positioning systems) of three places including Site A (near the source), Site B (near the bridge construction), and Site C (the place of the big rock). Each site was divided into three areas, consisting of A1, A2, A3, B1, B2, B3, C1, C2, and C3 as the location to take the water samples. In this study, the quality of Sumber Maron river water including chemical and physical properties was analyzed.
2.2. Sample Collection
- The study area was determined through the first visit of the river Sumber Maron and taking a section of the river whose length was determined by Google Map by the researcher and the supervisor of the study. The samples were obtained from three different places of the river section: the location (A), the beginning of the river, the location (B) (which is almost the middle of the river,) the location (C) and it is close to the end of the river. Determination of water and sediment quality including physical and chemical properties was conducted in the laboratory of the Jasa Tirta Malang and the laboratory of the Department of Biology, Brawijaya University. In this study, random sampling of water and sediment was taken from all locations. This study was conducted in rainy season. The water and sediment samples from Sumber Maron river were collected for this study following standard procedure as described by [11]. A sample of the rainy season was taken in December 2016.
2.3. Data Analysis
- The water quality parameters were analyzed using standard analytical methods [11]. Parameters consisting of water temperature, electrical conductivity, pH, total solids, total suspended solids, total solids and alkali, calcium, magnesium, sodium, dissolved oxygen, chemical oxygen demand and salinity samples were analyzed in the laboratory [11]. Standard laboratory methods for analyzing chemical oxygen demand were following [11], while the examination of water samples employed for the analyzing total solids, total suspended solids, total dissolved solids, calcium, and magnesium was determined using. All chemicals used were of high purity and analytical grade. Fresh reagents were used and great care was taken to avoid chemical contamination.
2.4. Statistical Analysis
- All the laboratory results of the parameters were analized by using ANOVA analysis of variance to determine whether there were any statistically significant differences between the means of three or more independent (unrelated) groups. Specifically, it tests the null hypothesis:
 | (1) |
3. Results and Discussion
3.1. Temperature
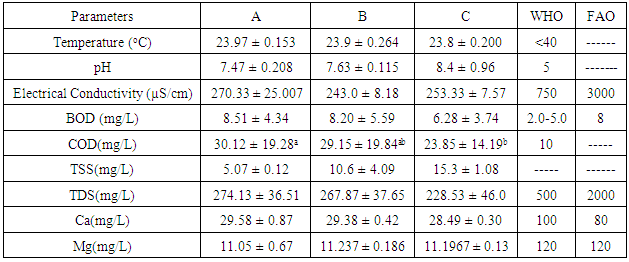
- Naturally water bodies show changes in temperature daily and seasonally due to different activities that can contribute to changes in surface water temperature. Water temperatures were obtained during the sampling collection period for all sites. Generally, the river temperature varies from 23.97 ± 0.153 C in Site A (near the source), 23.90 ± 0.265C in Site B (upstream), to 23.8±0.200 in Site C (downstream) and is considered lower compared to WHO maximum permissible limit (WHO, 2008). Thus, temperature of Sumber Maron river water is suitable for aquatic lives. This result is similar to other studies reported within a range of 19.5 to 21°C [13]. 10.18 to 19.73°C [14]. 20.5 to 22°C [15]. 19.01 to 23.93°C [16]. The results of variance analysis for temperature in each location during rainy season showed a significance value of 0.643 (p> 0.05). Thus, it can be concluded that there are no differences in temperature in each location during rainy season.
3.2. pH
- pH values vary from a minimum of 7.47 ± 0.208 and a maximum of 8.40 ± 0.964. These values are within the permissible limit of WHO and FAO set for drinking and irrigation purposes [17]. The results of variance analysis for pH in each location during rainy season showed a significant value of 0.186 (p>0.05) and it can be concluded that there are no differences in pH in each location during rainy season.
3.3. Electrical Conductivity (EC)
- The values of electrical conductivity vary in the three sites and fall within the criteria set by the World Health Organization for drinking purposes and below the limit set by FAO for irrigation, indicating a high amount of dissolved inorganic substances in their ionizing form [18]. Other studies have also shown that the values of EC are in the range of 225 to 3350 μm / cm [1], and 2130 μS/cm [19], which is similar to our findings from the Sumber Maron river ranging from 243 to 270. The results of analysis of variance for Electrical Conductivity in each location during rainy season showed a significance value of 0.183 (p>0.05) and it can be concluded that there are no differences in Electrical Conductivity in each location during rainy season.
3.4. Oxygen Demand (BOD)
- BOD which is sensitive for organic pollution ranges from 6.28 ± 3.738 to 8.51 ± 4.343 mg/L for Sumber Maron River water. This is within the recommended values of [12], and FAO [17]. The results of analysis of variance for BOD in each location during rainy season showed a significance value of 0.821 (p>0.05) and it can be concluded that there are no differences in BOD in each location during rainy season.
3.5. Chemical and Biological (COD)
- COD is related to organic and inorganic pollutants which cause unfavorable conditions for the growth of microorganisms. The permissible limit is 10 mg/L [13]. Average COD concentration for Sumber Maron River water ranges from 23.85 ± 14.196 to 30.12 ± 19.275mg/L, higher than the [12] value. This condition may be caused by the presence of chemicals such as oxygen demand in nature coming from washing of different vehicles and surface runoff. Similar kind of studies conducted in rivers like Cauvery and Arasalar in India also reported COD value in the range of 25 to 68 and 32.34 to 57.56 mg/L, respectively [2]. The results of variance analysis of for COD in each location during rainy season showed a significance value of 0.901 (p>0.05), and it can be concluded that there are no differences in COD in each location during rainy season.
3.6. Total Suspended Solids (TSS)
- The total suspended solid content depends on the amount of suspended particles, soil and silt directly associated with water turbidity. This study shows that the average value of TSS ranges from 5.07 ± 0.12 to 15.30 ± 1.08. These values are due to runoff and disposal of domestic sewage. The results of ANOVA analysis showed that there was no any significant difference among the three sites.River water having TSS values greater than 100 mg/L but less than 220 mg/L is classified as medium waste water [20]. Thus, the water of the Sumber Maron riveris ordinary water drainage. The results of variance analysis for TSS in each location during rainy season showed a significance value of 0.006 (p<0.05), and it can be concluded that there are differences in TSS in each location during rainy season.
3.7. Total Dissolved Solids (TDS)
- Total Dissolved Solids (TDS) in this study in three sites shows the average values varying from 267.87 ± 36.51 to 228.53 ± 46.00 mg/L and exceeds the maximum permissible limits of WHO for the drinking purpose and lower than the limit given by FAO for irrigation water [17, 12]. Higher TDS can be toxic to aquatic life through increases in salinity or changes in the composition of the water. Primary sources for higher TDS in the river water might be due to agricultural runoff, discharge of domestic waste from the town and other human activities like washing of different vehicle at and around the river [2, 1] also reported similar TDS values (221 to 3534 mg/L) for river water.
|
3.8. Calcium and Magnesium
- Calcium and magnesium are among the most common ingredients found in natural waters and their salts are an important contributor to the hardness of water. In this study, the contents of calcium and magnesium in mg / l ranged from a .28.49 ± 0.300 to29.39 ± 0.419 and 11.06 ± 0.679 to 11.24 ± 0.186, respectively. The recorded value of magnesium and calcium is within the limits of [12], FAO [17]. ANOVA analysis showed no significant differences in Calcium and Magnesium concentrations between the three studied sites. Values for Calcium are associated with sewage and weathering, rich caustic rocks or sedimentation materials [20]. The results of variance analysis for Calsium (Ca) in each location during rainy season showed a significance value of 0.129 (p>0.05), and it can be concluded that there are no differences in Calsium (Ca) in each location during rainy season. However, the results of analysis of variance for Magnesium (Mg) in each location during rainy season showed a significance value of 0.858 (p> 0.05). Thus, it can be concluded that there are no differences in Magnesium (Mg) in each location during rainy season.
4. Conclusions
- A water quality analysis has been carried out at Sumber Maron river on the basis of selective water quality criteria relevant to reference to the appropriateness of water for drinking and agriculture. The current analysis concludes that most of the concentrations of the physical and chemical parameters studied in the Sumber Maron river waters were in the recommended drinking water and irrigation parameters. The physical and chemical water quality standards obtained in the study differ from those permitted by the World Health Organization (WHO) standards for drinking water, but are within the limits of FAO (Aires and Westcott, 1994) for irrigation purposes. The height of the TDS code, as observed in the study, is often associated with diseases that may infect microorganisms such as bacteria and other parasites. These increased values also indicate some contaminants that the river water will be unsafe for domestic and swimming purposes, and the ANOVA test also showed statistically significant differences between the different sampling sites that may be attributed to various factors such as precipitation and changes in human activities that led to river loading with different contaminants during the sampling and analysis period. Thus, the study indicated that the entire river is generally contaminated, posing a major threat to aquatic life and the river and the people who use it for domestic and other activities. This may be due to improper disposal of wastewater, surface, agricultural runoff and wastewater from various local activities. Thus, water is not potable for domestic purposes and tourism without some forms of physical and chemical treatment while it is useful for agricultural purposes. It is therefore recommended that the effective management of the Sumber Maron river is required to reduce some of the problems associated with human health. There is also an urgent need for public awareness of the state of water and the application of relevant legal laws with regard to the proper handling of industrial and household discharge before entering the river course.
ACKNOWLEDGEMENTS
- This study was conducted in the rainy season (December 2016), water samples were analyzed by the use of the research laboratory at Water Company Jasa Tirta Malang and thus all resources used are acknowledged. It is pleased and thank you to my first supervisor, Prof. Yenny Risjani, Brawijaya University for her kind help in sample preparation and M. Sasmito Djati, Dr. Bagyo Yanuwiadi and Dr. Amin Setyo Leksono from Brawijaya University for their kind help in guiding this research steps and drawing the map of study area.