-
Paper Information
- Previous Paper
- Paper Submission
-
Journal Information
- About This Journal
- Editorial Board
- Current Issue
- Archive
- Author Guidelines
- Contact Us
Resources and Environment
p-ISSN: 2163-2618 e-ISSN: 2163-2634
2017; 7(6): 160-167
doi:10.5923/j.re.20170706.02

Investigation of the Relationship between Economic Growth and Carbon Dioxide (CO2) Emissions as Economic Structure Changes: Evidence from Ghana
 Abstract
 Reference
 Full-Text PDF
 Full-text HTML
Kingsley Appiah1, 2, Jianguo Du1, Abdul-Aziz Ibn Musah1, Samuel Afriyie1
1School of Management, Jiangsu University, Zhenjiang, China
2Accountancy Department, Kumasi Technical University, Kumasi, Ghana
Correspondence to: Kingsley Appiah, School of Management, Jiangsu University, Zhenjiang, China.
| Email: |  |
Copyright © 2017 Scientific & Academic Publishing. All Rights Reserved.
This work is licensed under the Creative Commons Attribution International License (CC BY).
http://creativecommons.org/licenses/by/4.0/

Increase in human activities contribute to the economic growth of a country. However, these human activities also contribute to the environmental pollution (i.e. carbon dioxide emissions). The effect of carbon dioxide (CO2) emissions on the environment is becoming a pressing reality. The study explores the relationship between CO2 and economic growth in Ghana when the economic structure changes. The study also tested the existence of EKC relationship between economic growth and CO2 in Ghana. Using linear regression model to find the linear relationship between environmental pollution and economic growth in Ghana, the study employed Ordinary Least Square (OLS) in order to minimize the sum of squared residuals. The study used the data of World Development Indicators (WDI) 2017 for the period 1970-2016. The study employed CO2 (metric tonnes per capita) as proxy of environmental pollution and GDP per capita (current US $) as proxy of economic growth. Findings indicate that CO2 and GDP per capita increases at different pace and varies over time period and therefore the study could not establish existence of EKC in Ghana. However, the relationship between the variables is significant with t-value 7.784> 2 and P- value of 0.000<0.05. This means that CO2 emission level in Ghana is influence by GDP. The study findings also indicate that agriculture as the engine of Ghana’s economy growth and development is experiencing continuous decline in terms of its contribution to GDP for the past four decades. The study therefore concluded that, there is the need for establishment of regulations, proper institutional structures to set up policy framework, enforcement agencies to monitor to ensure compliance and creation of public awareness of the dangers pose by environmental degradation.
Keywords: Environmental Kuznet Curve (EKC), Carbon dioxide (CO2) emissions, Gross Domestic Product (GDP), Economic growth, Structural change
Cite this paper: Kingsley Appiah, Jianguo Du, Abdul-Aziz Ibn Musah, Samuel Afriyie, Investigation of the Relationship between Economic Growth and Carbon Dioxide (CO2) Emissions as Economic Structure Changes: Evidence from Ghana, Resources and Environment, Vol. 7 No. 6, 2017, pp. 160-167. doi: 10.5923/j.re.20170706.02.
Article Outline
1. Introduction
- The emission of Greenhouse gases (GHG) globally in the atmosphere has dying consequences and poses serious threat to human sustainable development. The impact of global climate change affects climate patterns (i.e. increasing water stress, raising of sea level due to polar ice melting, destruction of the ecosystems) and also increase climatic episodes such as droughts, hurricanes and floods. The GHG consist of pollutants such as Carbon dioxide emission (CO2), Nitrous oxide (N2O), Methane (CH4) and Fluorinated gases (F-gases). Among the four pollutants, carbon dioxide emissions is considered as the key contributor to global warming and has received a lot of international attention [4, 22]. There are two main sources of carbon dioxide [21]. The first source which is considered as the largest contributor to carbon dioxide emissions is the combustion of fossil fuel. The combustion of fossil fuels consist of natural gas, crude oil and coal burning. The second source of carbon dioxide comes from industrial processes that releases carbon dioxide into the atmosphere through chemical reaction. On this basis, one can say that carbon dioxide emissions-other variables nexus is chemical and physical. Carbon dioxide (CO2) emission has increased over the years all over the world due to globalization and fast economic activities [1]. The increase in human activities such as manufacturing, transport, electricity generation and consumption of goods and services contribute to the economic growth of a country. However, these human activities also contribute to the environmental pollution [30-32]. That is, increase in economic growth involves activities like an increase in the country’s foreign direct investment, increase in agricultural activities, Spread of industries and above all increase in the consumption of energy. All these activities contribute one way or other to environmental pollution. Therefore, one can deduce that economic growth has causal relationship with the environmental pollution of a country. The study aimed to examine the relationship between CO2 and economic growth in Ghana when the economic structure changes. The study is also aimed to test the existence of EKC relationship between economic growth and CO2 in Ghana.
2. Literature Review
- Theoretical studyThe relationship between CO2 emissions and economic growth have been studied extensively using Environmental Kuznet Curve (EKC) which was hypothesized by [20]. Kuznets hypothesis juxtapose that initially environmental pollution increases as the country begin to develop but however at a certain point of economic development and growth, the environmental pollution level diminishes as depicted in figure 1. That is, the achievement of economic growth and development means that the country now have enough resources at their disposal to reduce and mitigate any form of environmental degradation.
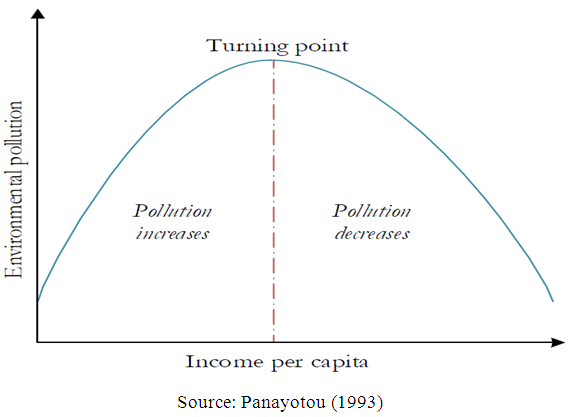 | Figure 1. Environmental Kuznets Curve |
 | Figure 2 |
3. Methodology
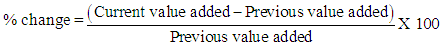
- The study looked at the relationship between economic growth and CO2 emission in the various structural changes in Ghana economy. The study also looked at the contribution of the various sectors of the economy to the economic growth of Ghana. Using the data of [25] for the analysis and discussions for the period 1970-2016. The study divided the time period of data analysis into phases. The study employed CO2 (metric tonnes per capita) as proxy of environmental pollution and GDP per capita (current US $) as proxy of economic growth.Using linear regression model in equation (1) to find the linear relationship between environmental pollution and economic growth in Ghana, the study employed Ordinary Least Square (OLS) in order to minimize the sum of squared residuals.
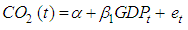 | (1) |
 | (2) |
 is a constant term and
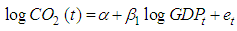
  is the estimate of CO2 – GDP elasticity, e is an error term. From the analysis equation (2) can be expressed as:
 | (3) |
4. Results and Discussion
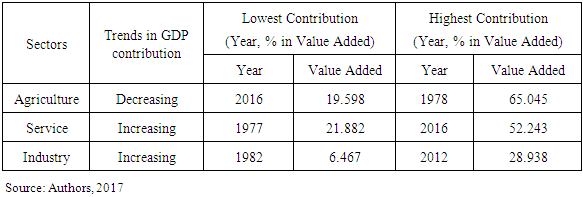
- The trend of various sector contribution to GDPTo achieve economic growth depends on agricultural, services and industrial strength of the country. However, Ghana has been directly dependent on agriculture output for foreign exchange, create employment and also to ensure that the citizens have enough to feed on. Agriculture sector alone contribute enormously in terms of tax revenue as much as 20.3% of real GDP in 2015 [16]. Table 1 below provides the trend of the various sectors contribution to GDP in Ghana. Details indicates that agriculture sector of Ghana is declining in terms of its contribution to economic growth averagely at 1.2% from as high as 65.045% in 1978 to as low as 19.598% in 2016. However, both service and industry shows an increase in trend of their impact on economic growth in Ghana. Both service and industry are increasing averagely at 0.78% and 0.75% respectively.
|
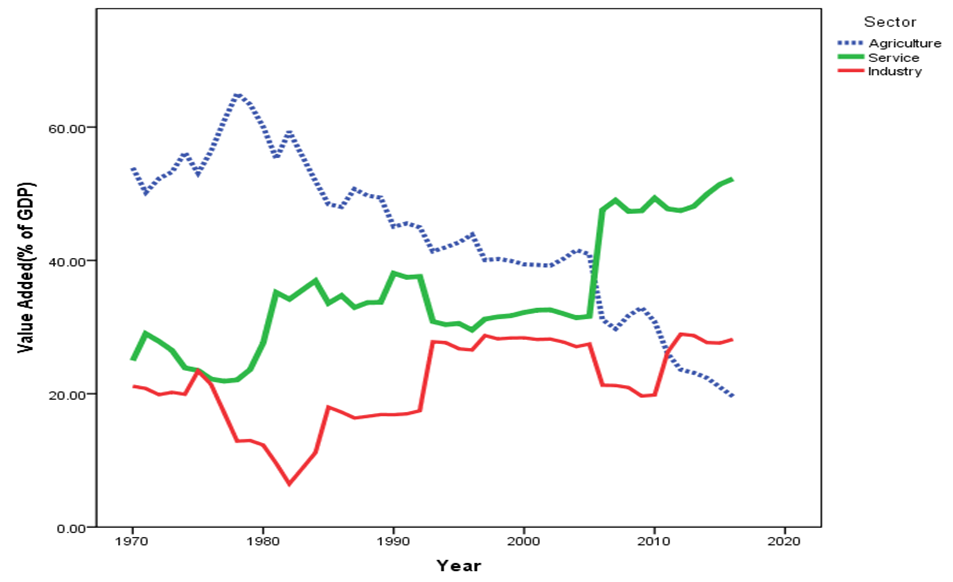 | Figure 3. Trend of Sectors contribution to GDP |
 Phase 3. 1990-1999As the economy continue to undergo further structural change from 1980-89 to 1990-1999. The various sector contribution also changes from one point of the developmental processes. The period 1990-1999 saw a decline in both agriculture and service sectors value added to Ghana’s economic growth. Both declined by 0.12% and 0.22% respectively. The average performance of agriculture sector was in the decline of 0.70% while’s service sector average also declined by 1.42% in phase 3 of Ghana’s developmental process. In the period of 1990-1999 saw only industry sector contributing positively towards GDP of Ghana with an average percentage of 1.7 and a percentage from 1990 to 1999 of 0.1%.Phase 4. 2000-2009Service sector in period 2000-2009 became the only sector that contributed positively towards economic growth in Ghana with an average of 5.88% and a change of 0.56% from year 2000 to 2009. However, both agriculture and industry percentage value added to the economy for period in review declined. The average declined rate of 3.94% and 0.97% for agriculture and industry respectively.Phase 5. 2010-2016This period under review projects serious decline of the main sector (i.e. agriculture) which serves as a backbone of Ghana’s economic growth and development. This period was faced with dramatic shift in the structural composition of the economy from agricultural based economy to both service and industry based economy. This then increases the share of services sector impact on GDP to 1.20% with a trend of change in the same period of 0.1%. The industrial sector saw a growth in value to Ghana’s GDP with an average of 4.57%. As indicated, agriculture sector declined with an average of 1.87% leading to negative change of 0.36% from 2010-2016.Trend of CO2 per capita and GDP per capita in GhanaThe use of fossil fuels in Africa has increased steadily and therefore contribute 3.7% of global emission in 2009 [24]. However, Ghana contributes 0.13% in 2011 to the world greenhouse gases [26]. The figure 4 provides the pattern of CO2 emission and GDP per capita to understand how the two variables behaves when the structure of the economy changes. To get standard measure and to understand the picture of the trend well, the data of CO2 (metric tonnes per capita) and GDP per capita (current US $) were transformed in their natural logarithm. The trend of CO2 and GDP per capita as shown in figure 4 depicts that even though both variables increases but at a different stride and varies over time period indicating GDP per capita increasing steadily more than CO2 per capita in Ghana. This may be due to the changes in Ghana economic structure from agriculture based to service based which has less impact on environment.
 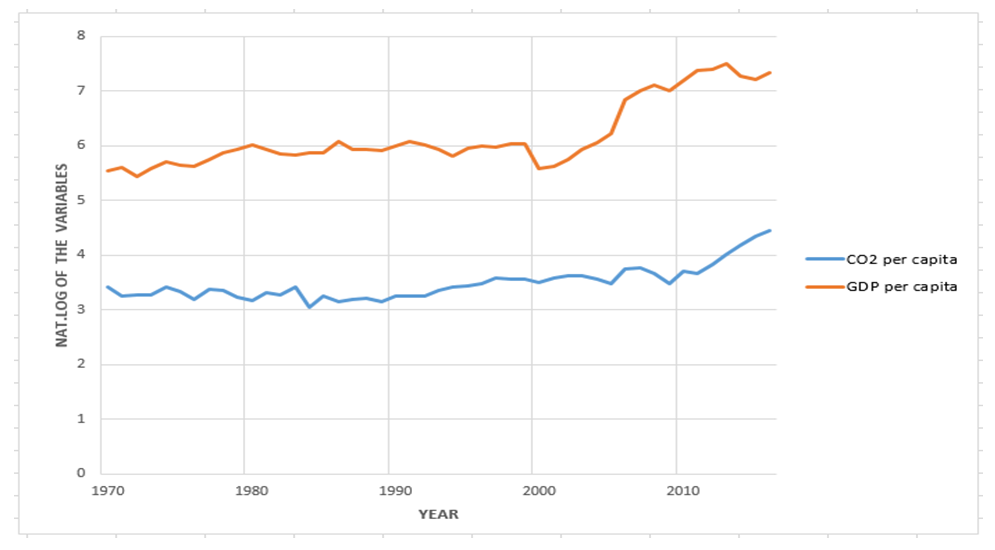 | Figure 4 |
|
|
|
5. Conclusions
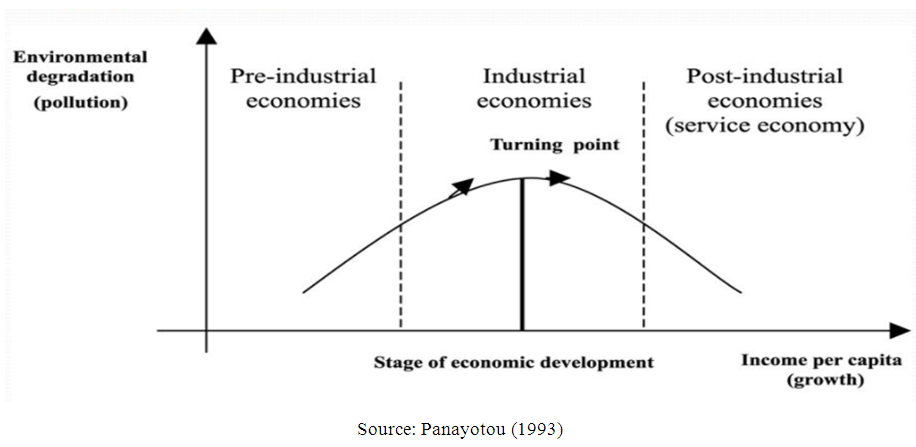
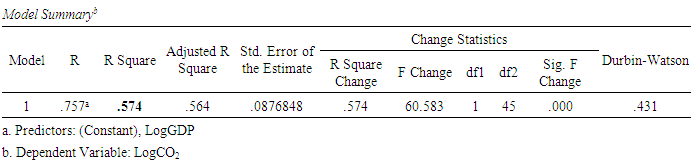
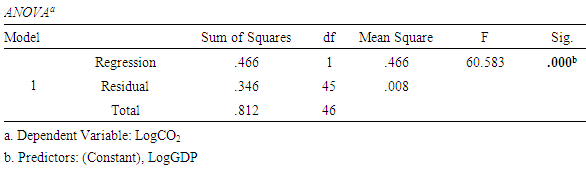
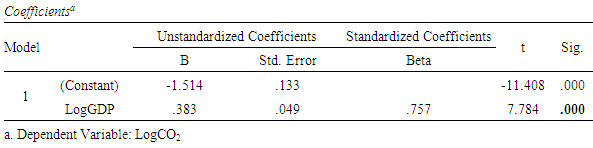
- It is highly believed that as the country develop economically all things been equal, the country will shift from the so call clean agricultural practices to a more polluting industrialization and then later reverse to service economy which is more cleaner. The reverse will then improve the quality of the environment due to application of advanced technology.The study examined the relationship between CO2 and economic growth in Ghana when the economic structure changes. The study also tested the existence of EKC relationship between economic growth and CO2 in Ghana. The study findings indicate that the main sector of Ghana’s economy which is agriculture has experienced continuous decline in terms of its contribution to GDP for the past four decades. That is, agriculture value added (i.e. % of GDP) for the period 1970-1979 was 2.12%. This positive contribution started declining on average of 2% of GDP in 1980-1989, 0.7 percent in 1990-1999, 3.94 percent in 2000-2009 and 1.87 percent in 2010-2016. It is likely that agriculture sector contribution will experience further dew drop in the years ahead due to government expurgation of expenditure on the sector. However, both service and industry sectors increased their contribution to GDP with the service sector leading followed by industry. Both contemporary and chronological pattern of Ghana’s economy depicts momentous structural modifications. Therefore Ghana’s economic structure has moved from its traditional agriculture based economic transformation toward service- based economy, with diminutive change in the industrial-based economy. The study could not establish whether EKC exist in Ghana since CO2 and GDP per capita are increasing at different pace and varies in different time period. However, the relationship between the variables is significant with t-value 7.784> 2 and P- value of 0.000<0.05. This means that CO2 emission level in Ghana is influence by GDP. With the normal P-P plot of regression (in figure 5) showing strong “goodness of fits”. The R2 of 57.4% shows how the regression line fits through the CO2 and GDP graph. Therefore, 57.4% of the observations are explainable. The regression coefficient (i.e.
 ) of 0.383 shows the marginal effect of a percentage change of logGDP on logCO2. That is, 1% change of logGDP will cause 38.3% change of logCO2.
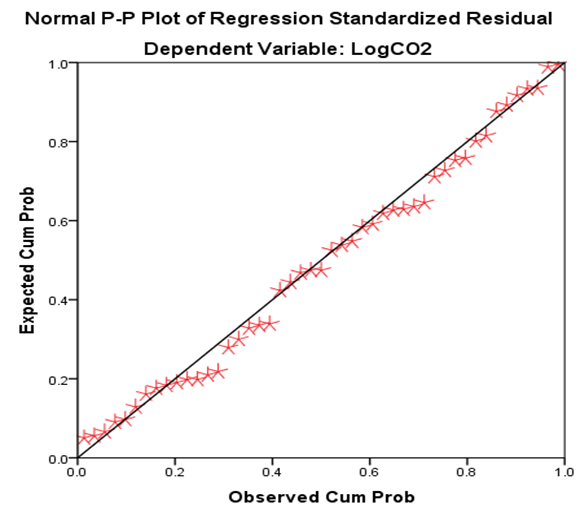 | Figure 5 |