Okon Bassey Bassey, Imoh Christopher Attah, Edidiong Eseme Ambrose, Roland Kufre Etim
Department of Civil Engineering, Akwa Ibom State University, Ikot Akpaden, Nigeria
Correspondence to: Edidiong Eseme Ambrose, Roland Kufre Etim, Department of Civil Engineering, Akwa Ibom State University, Ikot Akpaden, Nigeria.
| Email: |  |
Copyright © 2017 Scientific & Academic Publishing. All Rights Reserved.
This work is licensed under the Creative Commons Attribution International License (CC BY).
http://creativecommons.org/licenses/by/4.0/

Abstract
This paper presents the results of the correlation between California Bearing Ratio (CBR) and index properties of soils. Laboratory tests were carried out to determine soaked CBR, LL, PL, PI, MDD and OMC on soil samples collected from Ibiono, Oron and Onna L.G.A. in Akwa Ibom State. A correlation relationship between CBR and soil index properties were developed using non-linear and multiple linear regression analysis. Standard Minitab 13 and Microsoft Excel 2013 software package were used for the analysis. It was shown that a high adjusted coefficient of multiple linear regression value R were obtained for Ibiono and Onna. Comparison between laboratory and predicted CBR values obtained from MLR models indicate that geotechnical properties; PI and OMC for Ibiono, OMC and MDD for Onna, LL, PL and OMC for Oron can be used to predict the soaked CBR values. R2 value of 0.942, 0.731 and 0.653 were obtained from the variation of actual laboratory CBR with predicted CBR for Ibiono, Onna and Oron specimen respectively. The correlation matrix between CBR and index/geotechnical properties; CBR, LL, PL, PI, MDD and OMC were observed to have high negative values.
Keywords:
California Bearing Ratio, Geotechnical Properties, Regression Analysis and Correlation Analysis
Cite this paper: Okon Bassey Bassey, Imoh Christopher Attah, Edidiong Eseme Ambrose, Roland Kufre Etim, Correlation between CBR Values and Index Properties of Soils: A Case Study of Ibiono, Oron and Onna in Akwa Ibom State, Resources and Environment, Vol. 7 No. 4, 2017, pp. 94-102. doi: 10.5923/j.re.20170704.02.
1. Introduction
The suitability and stability of soil is usually evaluated before its use in construction of pavement. Proper analysis is necessary to ensure that Civil engineering infrastructures such as roads, buildings, rails, dams, etc. remain safe and free to withstand settlement and collapse. Geographical variability in soil conditions from one location to another makes it difficult to predict the behaviour of soil. As a result, soil conditions at every site must be thoroughly investigated for proper design [1].In Nigeria, most of the road networks consist of flexible pavement which is made up of different layers such as sub-grade, sub - base, base course and surface layer. The design and performance of this pavement mainly depend on the strength of sub-grade material. Sub-grade is the bottom-most layer that serves as the foundation of a road pavement and the wheel load from the pavement surface is ultimately transferred to the sub-grade [2]. The California Bearing Ratio (CBR) test is an empirical method of design of flexible pavement. The bearing capacity of the soil beneath highways, airfield runways and other pavement systems are of great importance to the integrity of the pavement. This bearing capacity changes from time to time and can vary from place to place within a given area. The thickness of subgrade depends on CBR value, subgrade that has lower CBR value will have thicker pavement compared with the sub grade that has higher CBR value and vice versa. However, to conduct a CBR test, representative soil sample has to be collected from the location selected, from which a remoulded specimen has to be prepared at predetermined optimum moisture content and maximum dry density with standard proctor compaction and the results obtained analysed [3]. Soaked CBR value of a soil sample takes about a week, making CBR test expensive, time consuming and laborious. All these problems may result in delay in the progress of the project and lead to escalation of the project cost. To overcome these difficulties, it is imperative to predict CBR value of subgrade soil with easily determinable parameters. Since CBR test is time-consuming, a good indication of CBR values from index tests would be beneficial. To this end attempts have been made to relate geotechnical test parameters to CBR values, most of them with little or moderate success. Statistical models of [4] studied the results of over 1000 soaked CBR tests obtained from road and airport works throughout central and southern Africa and prepared a chart giving a nest of straight lines that related CBR to plasticity index and grading modulus. Gawith and Perrin [5] suggested three equations that utilized linear shrinkage, plasticity index, grading modulus and the percentages passing the 2 mm, 0.425 mm and 0.075 mm sieves to predict the CBR. Netterberg and Paige-Green [6] showed that the CBR of calcretes increased with the decreasing product of linear shrinkage and the percentage passing the 0.425 mm sieve. Three CBR prediction equations using optimum moisture content, liquid limit, plastic limit and plasticity index, were reported by [7] whilst [8] proposed three equations that utilized the percentage retained on the 2.36 mm sieve, the percentage passing the 0,075 mm sieve, the Proctor dry density and the liquid plastic limits. Haupt [9] suggested six models to predict the CBR at maximum dry density for Proctor compaction using combinations of the grading modulus, percentage passing the 0.075 mm sieve. Linear shrinkage, plasticity index and liquid limit, the latter three parameters each being adjusted by various powers of the percentage passing the 0.425 mm sieve. In later work by [10] various equations were provided that described this relationship. Their approach was also followed by [11], who presented a similar finding for Botswana calcretes, subsequently republished by [1] for use with laterites. Index properties of subgrade soils in different locations in the north central and south western part of Nigeria was investigated by [12] and [13]. Characterizing field material by using laboratory tests is an ongoing problem in the discipline of pavement design and construction. However, predictive models were used to solve this problem and respective result varies with location [3, 7 and 8]. From the foregoing, it is pertinent to replicate similar study in other areas due to difference in soil geological formation and variability of test results. Linear regression model was utilize in predicting the optimum moisture content and maximum dry density of black cotton soil treated with iron ore tailing [14]. Non-linear stochastic optimization search was used in enhancement of the uniformity of solid particles in spouted bed [15]. This study aims to establish a correlation between CBR and geotechnical properties of the soil with respect to the location of study. If established, the result would be useful in predicting the CBR of soil. This will save time and cost of carrying out detailed CBR test for that location.
2. Materials and Method
2.1. Soil
The lateritic soil samples used in this study were collected from three locations (Ibiono, Oron and Onna) in Akwa Ibom state, using the method of disturbed sampling. The samples were taken at a depth of 0.6 m from the natural earth surface to avoid organic matter influence.
2.2. Index Tests
Index properties such as sieve analysis with particular interest in percentage passing 75 micron aperture (fine content), Atterberg test i.e. liquid limit, plastic limit and plasticity index and shrinkage limit were investigated. The British method [16] for determination of the Atterberg limit of the lateritic soil was determined for proper classification of the soil using [17].
2.3. Compaction
The standard proctor test described by British method [18] was employed in determination of the compaction characteristic of the lateritic soil. The Standard Proctor compaction utilized 3 layers applying 27 blows each of a 2.5 kg rammer falling from a height of 300 mm using 1000cm3 mould.
2.4. California Bearing Ratio Test
The strength characteristic test carried out in this study is the California bearing ratio (CBR) test. The CBR were carried out in conformation with the recommendations of [19], which states that specimens be cured for 6 days unsoaked (that is, at a temperature of 25±2°C and relative humidity of 100%) and immersed in water for 24 hours before testing.
2.5. Simple Non-linear Regression and Multiple Linear Regression Analysis
To establish a relationship between soaked CBR and different soil properties, a non-linear stochastic optimization and multiple linear regression models were developed in this study for predicting soaked CBR value in terms of index and compaction characteristics. Graphs were plotted with CBR considered as independent variable against different soil parameters (LL, PL, OMC and MDD considered as dependent variables). Suitable trend lines (non-linear regression lines) were drawn for each so as to obtain a goodness of fit. The non-linear regression analysis quantifies goodness of fit with R2 value. Multiple linear regression analysis, MLRA was carried out using standard Minitab 13 in order to derive the relationship statistically. The R2 value for the MLRA provides a measure of how well future outcomes are likely to be predicted by the model. MLRA can only be carried out when the R2 values of more than one dependent variable in the non-linear simple regression analysis are greater than 50 percent. Correlation analysis was carried out on the data. Correlation quantifies the degree to which dependent and independent variables are related.
3. Results and Discussion
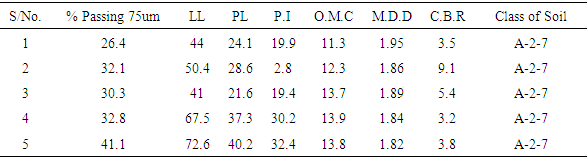
The results of various soil properties from the experiment conducted in the laboratory for twenty - two samples taken from 3 locations are shown in Table 1, 2 and 3. The soil properties include index properties of soils such as liquid limit, plastic limit, compaction characteristics (maximum dry density and optimum moisture content) and California Bearing Ratio test.Table 1. Results of Laboratory Test for Soil Samples (Ibiono L.G.A)
 |
| |
|
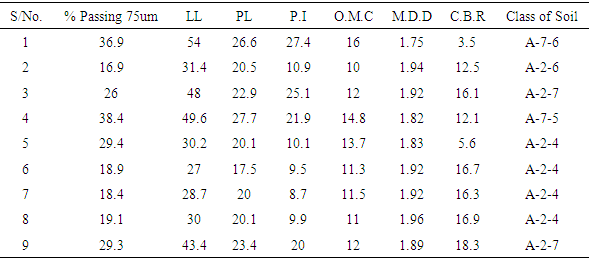
Table 2. Results of Laboratory Test for Soil Samples (Onna L.G.A)
 |
| |
|
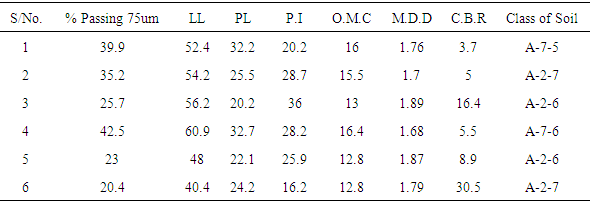
Table 3. Results of Laboratory Test for Soil Samples (Oron LGA)
 |
| |
|
The range of parameters studied in this investigation is: % passing 75um = 26.4 - 41.1%, LL = 41 - 72.6%, PL = 21.6 - 40.2%, PI = 2.8 - 32.4%, OMC = 11.3 - 13.9%, MDD = 1.82 - 1.95 Mg/m3, soaked CBR= 3.2 - 9.1% and the class of soil is A-2-7 according to AASHTO (Ibiono soil), while % passing 75um = 16.9 - 38.4%, LL = 27 - 54%, PL= 17.5 - 26.6%, PI = 8.7 - 27.4%, OMC = 10 - 16%, MDD = 1.82 - 1.96 Mg/m3, soaked CBR = 3.5 – 18.3% and the class of soil falls within A-2-4 and A-7-6 according to AASHTO (Onna soil) and % passing 75um = 20.4 - 42.5, LL = 40.4 - 60.9%, PL = 20.2 - 32.7%, PI = 16.2 - 36%, OMC = 12.8 - 16%, MDD = 1.68 - 1.89 Mg/m3, soaked CBR = 3.7 - 30.5% and the class of soil falls within A-2-6 and A-7-5 according to AASHTO (Oron soil).
3.1. Simple Regression Analysis (SRA)
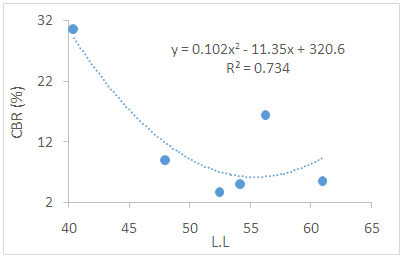
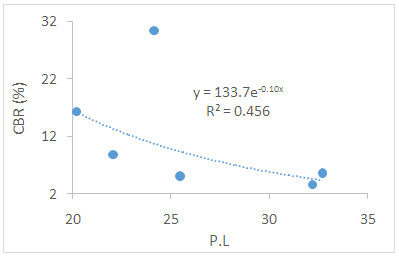
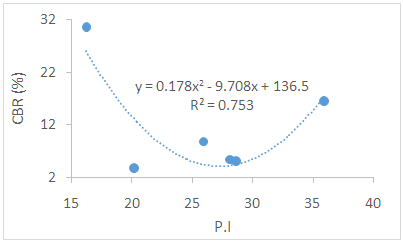
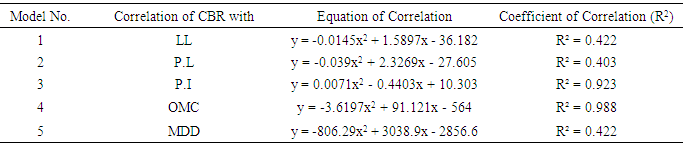
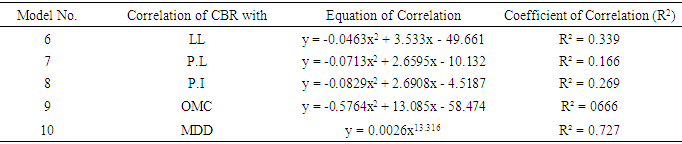
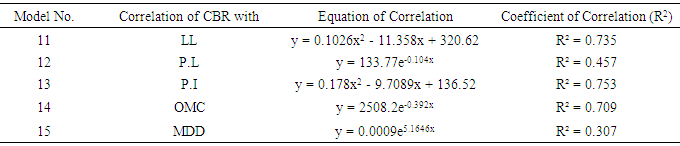
The variations in CBR value which is considered as independent variable with LL, PL, PI, MDD and OMC value which are considered as the dependent variables are presented in Fig 1 - 15 for the three locations respectively. Non-linear SRA was carried out using standard statistical software like Data Analysis Tool Bar of Microsoft Excel in order to derive the relationship statistically. Five non-linear models have been developed to show the effect of geotechnical properties (LL, PL, PI, MDD and OMC) on CBR values of soil. The proposed non-linear models for the different soil locations are shown in Figures 1 to 15. Model 1: CBR vs. LL, Model 2: CBR vs. PL, Model 3: CBR vs PI, Model 4: CBR vs. OMC and Model 5: CBR vs. MDD. The statistical parameters indicate that models 3, 4, 9, 10, 11, 13 and 14 have R- square value (R2) of 0.923, 0.988, 0.666, 0.727, 0.735, 0.753 and 0.709 respectively, which is above 50 %. This implies that a good relationship exist between the dependent and independent variable of the models. The R2 for models 1, 2, 5, 6, 7, 8, 12 and 15 are less than 50%, therefore they have less influence on CBR values and will not constitute variables for multiple regression analysis for the respective location. Similar study was reported by [20] Summary results of non-linear SRA models are presented in Table 4, 5 and 6.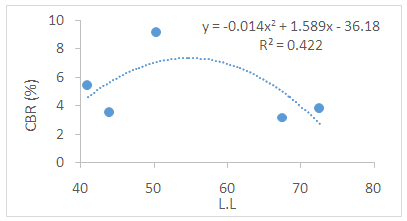 | Figure 1. Correlation of CBR with LL for Ibiono soil (Model 1) |
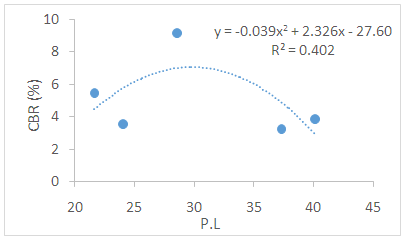 | Figure 2. Correlation of CBR with PL for Ibiono soil (Model 2) |
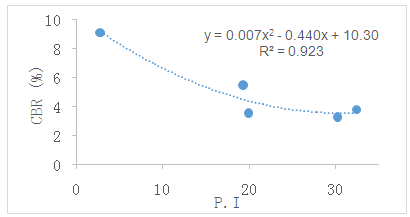 | Figure 3. Correlation of CBR with P.I for Ibiono soil (Model 3) |
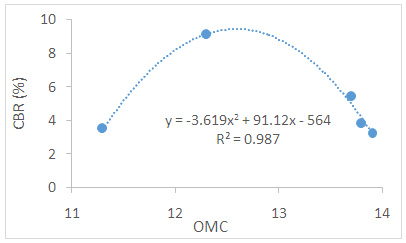 | Figure 4. Correlation of CBR with OMC for Ibiono soil (Model 4) |
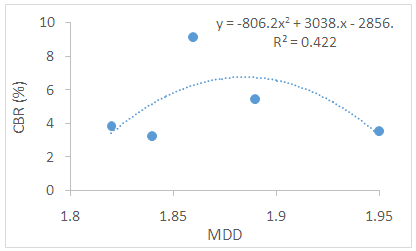 | Figure 5. Correlation of CBR with MDD of Ibiono soil (Model 5) |
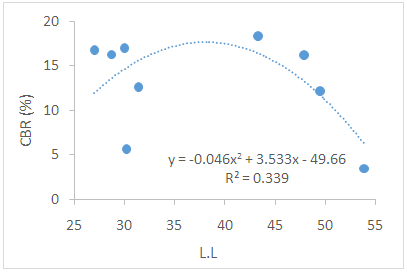 | Figure 6. Correlation of CBR with LL of Onna soil (Model 6) |
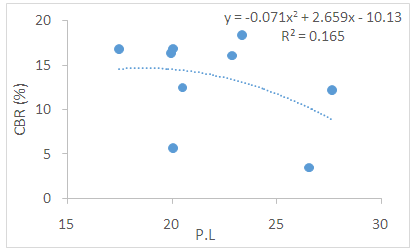 | Figure 7. Correlation of CBR with PL of Onna soil (Model 7) |
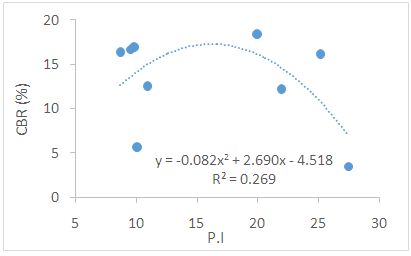 | Figure 8. Correlation of CBR with PI of Onna soil (Model 8) |
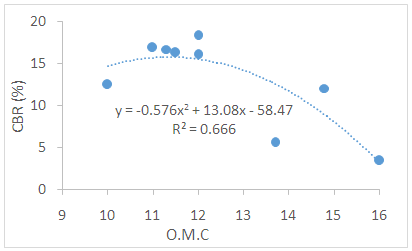 | Figure 9. Correlation of CBR with OMC of Onna soil (Model 9) |
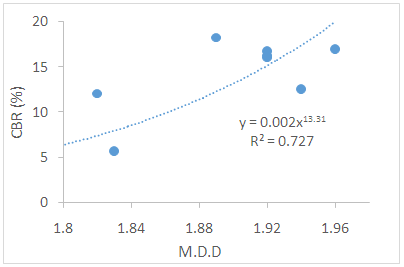 | Figure 10. Correlation of CBR with MDD of Onna soil (Model 10) |
 | Figure 11. Correlation of CBR with LL of Oron soil (Model 11) |
 | Figure 12. Correlation of CBR with PL of Oron soil (Model 12) |
 | Figure 13. Correlation of CBR with PI of Oron soil (Model 13) |
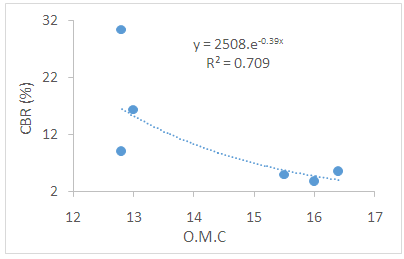 | Figure 14. Correlation of CBR with OMC of Oron soil (Model 14) |
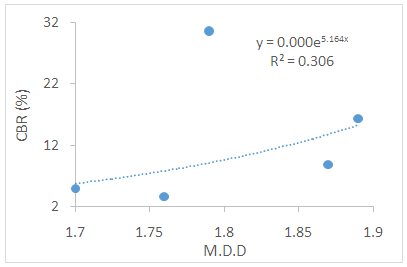 | Figure 15. Correlation of CBR with MDD of Oron soil (Model 15) |
Table 4. Summary Result of Simple Regression Analysis (Ibiono L.G.A)
 |
| |
|
Table 5. Summary Result of Simple Regression Analysis (Onna L.G.A)
 |
| |
|
Table 6. Summary Result of Simple Regression Analysis (Oron L.G.A)
 |
| |
|
3.2. Multiple Linear Regression Analysis (MLRA)
To develop the models of multiple linear regression analysis, soaked CBR value is considered as a dependent variable while soil properties such as: LL, PL, PI, MDD and OMC are considered as the independent variables. MLRA was carried out using standard Minitab 13 in order to derive the relationship statistically. For Ibiono, Oron and Onna soil samples, the R2 values of more than one dependent variable is greater than 50 percent, hence MLRA was easily developed. The mathematical relationships are shown in the following equations below: | (1) |
 | (2) |
 | (3) |
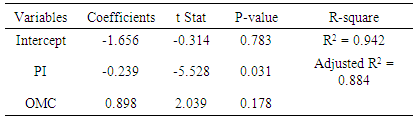
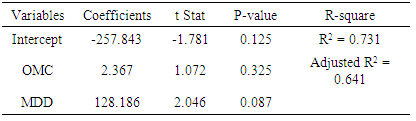
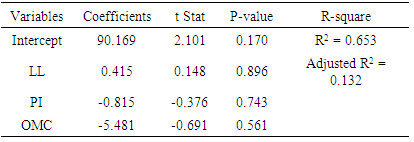
Equation 1, 2 and 3 have R2 values 0.942, 0.731, 0.653 and adjusted R2 of 0.884, 0.641 and 0.132 respectively. These results show that CBR values is greatly influenced by independent positive coefficient variables of; OMC for (1); OMC, MDD for (2) and LL for (3). The t-statistic and p-value of multilple linear regression analysis for Ibiono, Onna and Oron soil samples are shown in Table 7, 8 and 9.Table 7. Results of MLRA for Ibiono soil
 |
| |
|
Table 8. Results of MLRA for Onna soil
 |
| |
|
Table 9. Results of MLRA for Oron soil
 |
| |
|
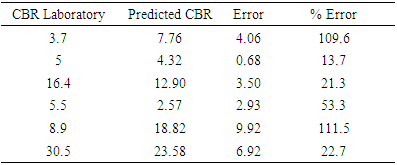
3.3. Comparison between Predicted and Laboratory Results
Comparison between the measured laboratory results and predicted values from the regression model using a linear relationship shows a strong relationship between the measured laboratory result and predicted values from the model with a correlation coefficient R2 = 0.942, 0.731 and 0.653 for Ibiono, Onna and Oron soils respectively, See Fig 16, 17, 18 and Table 10, 11 and 12.Table 10. Result obtain from Multiple Linear Regression Analysis Equation for Ibiono Sample
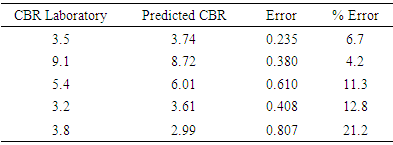 |
| |
|
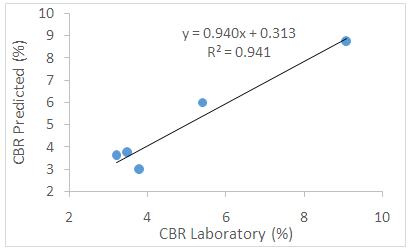 | Figure 16. Variation of actual CBR with predicted CBR in Ibiono soil |
Table 11. Result obtain from Multiple Linear Regression Analysis Equation for Onna Sample
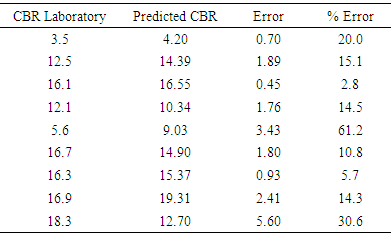 |
| |
|
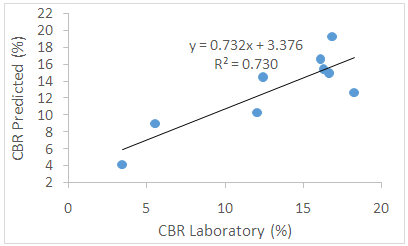 | Figure 17. Variation of actual CBR with predicted CBR in Onna soil |
Table 12. Result obtain from Multiple Linear Regression Analysis Equation for Oron Sample
 |
| |
|
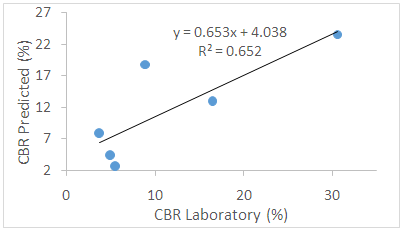 | Figure 18. Variation of actual CBR with predicted CBR in Oron soil |
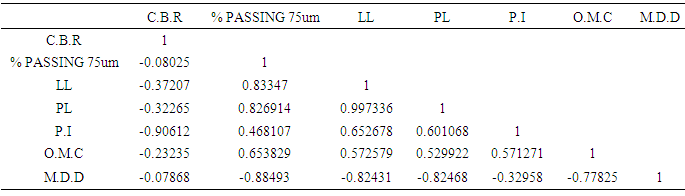
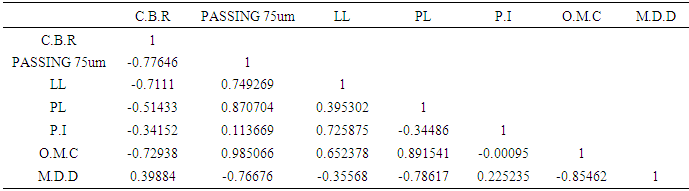
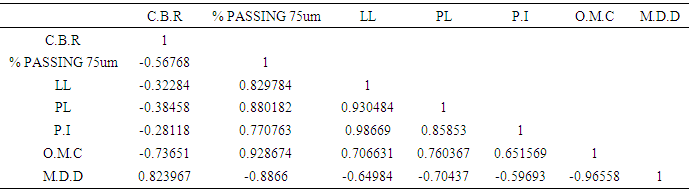
3.4. Correlation Analysis
The relationship between California bearing ratio, CBR, and the parameters associated with California bearing ratio (% passing 75 µm or silt content; LL; PL; PI; OMC and MDD) shows varying degree of relationships. Detailed results are presented in table 13, 14 and 15. High and negative correlation was observed between CBR and PI (-0.906; P<0.05) for Ibiono soil sample. The correlation ranges from -0.906 to -0.079 as shown in table 13. The correlation relationship between CBR with soil properties for Oron sample ranges from -0.776 to 0.398. High and negative correlation coefficient was observed between CBR and % passing 75 µm sieve (-0.776; P<0.05), and the highest positive correlation coefficient was recorded between CBR and MDD (0.398; P<0.05) (see table 14). In the case of Onna soil sample, correlation coefficient between CBR and OMC recorded high and negative value (−0.737; P>0.05), the highest correlation coefficient was observed between CBR and MDD (0.824; P>0.05) (see table 15).Table 13. Correlation Matrix (Pearson) for California Bearing Ratio and other Soil Properties (Ibiono Soil)
 |
| |
|
Table 14. Correlation Matrix (Pearson) for California Bearing Ratio and other Soil Properties (Oron Soil)
 |
| |
|
Table 15. Correlation Matrix (Pearson) for California Bearing Ratio and other Soil Properties (Ibiono Soil)
 |
| |
|
4. Conclusions
The following conclusions were drawn:The statistical parameters indicate that the non-linear regression analysis showed strong correlation between; CBR and (PI, OMC) for Ibiono; CBR and (OMC, MDD) for Onna; CBR and (LL, PI, OMC) for Oron specimen.Based on the model developed from multiple linear regression, a comparison between the laboratory and predicted CBR values shows that the geotechnical properties; (PI, OMC) for Ibiono, (OMC, MDD) for Onna and (LL, PI, OMC) for Oron soils can be used to effectively predict CBR values. Samples used in this study were representative specimens and constitute the predominance found in the study location. However, accuracy of predicted results may be enhanced further by conducting relevant tests on more samples than were used in this study. Based on regression and correlation analysis, it is recommended that a good measure of quality control of PI, MDD, OMC and LL variables are significant during field compaction and incorporation of these variables into a measure of quality control and specification will help to achieve durable road pavement.
References
| [1] | Charman, J H. (1988). Laterite in road pavements. Construction Industry Research and Information Association, London. |
| [2] | Rakaraddi, P. G., and Gomarsi, V. (2015). Establishing Relationship between CBR with different Soil Properties. International Journal of Research in Engineering and Technology, 4 (2): 182 - 188. |
| [3] | Talukdar, D. K. (2014). A Study of correlation between California Bearing Ratio (CBR) value with other properties of soil. International Journal of Emerging Technology and Advanced Engineering, 4, 559 - 562. |
| [4] | Kleyn, S.A. (1985). Possible Developments in Pavement Foundation Design. The South African Institution of Civil Engineers, 5 (12): 286 - 292. |
| [5] | Gawith, A. H and Perrin, C. C. (1962). Developments in the design and construction of bituminous surfaced pavements in the state of Victoria, Australia. Proc, 1st International Conference on Structural Design of Asphalt Pavements. Ann Arbor, Michigan, September. pp. 897 - 910. |
| [6] | Netterberg, F. and Paige-Green, P. (1988). Effect of Drying Temperature on the Index Properties of Southern Africa: A review. Proc. Annual Transportation. Convention, 2D, Paper 2, Day 5, Pretoria, pp 36. |
| [7] | Agarwal, K. B, and Ghanekar, K. D. (1970). Prediction of CBR from plasticity characteristics of soils. Proc, Second South-East Asian Conference on Soil Engineering. Singapore, pp. 571-576. |
| [8] | Sood, V. K., Lal, N. B. and Dhir, M. P. (1978). Estimation of CBR values of moorums from index properties. Indian Highways, 6 (11): 28-31. |
| [9] | Haupt, F J. (1980). Moisture conditions associated with pavements in Southern Africa. MSc thesis, University of the Witwatersrand, South Africa. |
| [10] | Paige-Green (1989). The influence of geotechnical properties on the performance of gravel wearing course materials. PhD thesis, University of Pretoria, Pretoria. |
| [11] | Lawrance, C.J. and Toole, T. (1984). The location, selection and use of calcrete for bituminous road construction in Botswana. Transport and Road Research Laboratory Report 1122. Crowthorne, pp. 47. |
| [12] | Mallo, S. J. and Umbugadu, A. A. (2012). Geotechnical study of the properties of soils: A case study of Nassarawa – Eggon town and Environs, Northern Nigeria. Continental J. Earth Sciences 7 (1): 40 – 47. |
| [13] | Adeyemi, G. O, Oloruntola, M.O and Adeleye, A.O (2014). Geotechnical Properties of Subgrade Soils along Sections of the Ibadan–Ife Expressway, South-Western Nigeria. Journal of Natural Sciences Research, 4 (23): 67 - 75. |
| [14] | Osinubi, K. J., Eberemu, A. O., Yohanna, P. and Etim, R. K. (2016). Reliability Estimate of the Compaction Characteristics of Iron Ore Tailings Treated Tropical Black Clay as Road Pavement Sub-Base Material. American Society of Civil Engineers Geotechnical Special Publication, 271: 855 - 864. |
| [15] | Alwan, G.M. (2015). Enhancement of Uniformity of Solid Particles in Spouted Bed Using Stochastic Optimization. Iraqi Journal of Chemical and Petroleum Engineering, 16(3): 23 - 33. |
| [16] | British Standard Institute, Methods of testing soils for civil engineering purposes, BS 1377, Part 2, (1990). |
| [17] | AASHTO (American Association of State Highway and Transportation Officials), (2005). Standard Specifications for Transportation Materials and Methods of Sampling and Testing, 25th Edition. AASHTO, Washington, DC. |
| [18] | Bristish Standard Institute, Methods of testing soils for civil engineering purposes, BS 1377, Part 4, (1990). |
| [19] | Nigerian General Specifications. Roads and Bridges. Abuja, Nigeria: Federal Ministry of Works; 1997. |
| [20] | Ramasubbarao, G. V. and Siva, S. G. (2013). Predicting Soaked CBR Value of Fine Grained Soils Using Index and Compaction Characteristics. Jordan Journal of Civil Engineering, 7 (3): 354 - 360. |

 Abstract
 Reference
 Full-Text PDF
 Full-text HTML