-
Paper Information
- Paper Submission
-
Journal Information
- About This Journal
- Editorial Board
- Current Issue
- Archive
- Author Guidelines
- Contact Us
Resources and Environment
p-ISSN: 2163-2618 e-ISSN: 2163-2634
2017; 7(2): 49-61
doi:10.5923/j.re.20170702.03

An Empirical Analysis of Domestic Water Sources, Consumption and Associated Factors in Kandahar City, Afghanistan
 Abstract
 Reference
 Full-Text PDF
 Full-text HTML
Mohammad Aslam Haziq1, Sanaullah Panezai2
1Water Resource and Environmental Engineering Department, Kandahar University, Kandahar, Afghanistan
2Doctoral Student, Regional and Rural Development Planning, Asian Institute of Technology, (AIT) Thailand & Department of Disaster Management and Development Studies, University of Balochistan, Quetta, Pakistan
Correspondence to: Sanaullah Panezai, Doctoral Student, Regional and Rural Development Planning, Asian Institute of Technology, (AIT) Thailand & Department of Disaster Management and Development Studies, University of Balochistan, Quetta, Pakistan.
| Email: |  |
Copyright © 2017 Scientific & Academic Publishing. All Rights Reserved.
This work is licensed under the Creative Commons Attribution International License (CC BY).
http://creativecommons.org/licenses/by/4.0/

This paper presents an empirical analysis of domestic water sources, consumption and factors influencing water consumption in Kandahar city, Afghanistan. From December 2011 to January 2012, through a field survey, the data were collected from 400 households in 10 districts of Kandahar city. The average domestic water consumption at household level is found to be 59 liters per capita per day (lpcd). The analysis of findings showed that 7.8% of the households received their water from tap water solely, 6.8% from tap water and private tube wells, 48.5% from private tube wells solely, 19.2% from public hand pumps and neighbors, 12.5% bought water from street vendors solely and 5.2% got water from tap water, public hand pumps and neighbors. Moreover, the findings illustrate that buying water from vendors exhibits highest initial cost (464 ± 110.5 US$) and a monthly tariff (32.9 US$) whereas, a minimum monthly tariff (1.70 US$) is charged to tap water users. Moreover, the micro-component analysis of water use indicates that attitude of water use varies significantly with water source. Households’ domestic water consumption in Kandahar city varies from 15 to 180 liters per capita per day with an average consumption of 59 liters per capita per day. The major components of water consumption included washing clothes, taking bath, sanitation and kitchen. The results of the Pearson correlation analysis indicated that water consumption was significantly correlated with household size (r = -0.13, P < 0.05), age of household’s head (r = 0.26, P < 0.01), household income (r = 0.45, P < 0.01), time to collect water (r = -0.21, P<0.01), availability of tap water (r = 0.17, P < 0.05), bathing times per month (r = 0.16, P < 0.05) and ground water table (r = -0.43, P < 0.01). The present study has concluded that fewer households had access to water supply by CAWSS Kandahar which showed government’s inability to meet households’ water demand. Therefore, majority of the households had to rely on other sources of water to meet their households water demand. The findings of the present study suggest that CAWSS Kandahar city must take measures for expanding the network of government administered water supply to the fulfill the households water demand in the light of water consumption as highlighted by the findings of this study.
Keywords: Afghanistan, Domestic water consumption, Kandahar city, Water sources, Water use tap water, Per capita water consumption
Cite this paper: Mohammad Aslam Haziq, Sanaullah Panezai, An Empirical Analysis of Domestic Water Sources, Consumption and Associated Factors in Kandahar City, Afghanistan, Resources and Environment, Vol. 7 No. 2, 2017, pp. 49-61. doi: 10.5923/j.re.20170702.03.
Article Outline
1. Introduction
- Afghanistan comprises of numerous mountain ranges which serves as a natural water storage, however, due to the physiographic complexity it has been defined as an extremely water stress nation in the world [1]. Moreover, due to the long term political instability, development of water supply system in the country has been fragmented ultimately forging to merely 48% people having access to safe drinking water [2]. In addition, further threat is also being posed by climate change and climate variability which has direct and indirect implication on fresh water availability and other associated impacts [3-6]. The disintegrated and intermittent supply of water by government agencies for domestic purpose has forced people to depend more on groundwater sources which are also under threat due to overdependence on it for irrigation and contamination [7]. It is well established that the economic development of a country depend on the availability and accessibility of domestic water resources [8, 9]. However, for Afghanistan, the development schemes are more focused on the agricultural and industrial development with a minor spotlight to domestic sector [10]. Moreover, water supply and the treatment process for drinking and domestic use are long processes and occasionally it cost 10 times more than irrigation water due to the limitation of available clean water [11]. In addition, globally due to domination of illiteracy leading to unawareness and lack of proper sanitation, at a global scale majority of people have access to contaminated water sources which causes outbreak of water-borne diseases [12-14]. Therefore, provision of potable water is a major challenge in cities and the assessment of the sources is of priority concern [15]. Domestic water consumption is a significant component of the total water use and varies according to the living standards of the consumers in urban and rural areas [16-18]. However, the urban household water use can be divided into indoor water use which comprises of drinking, cooking, hygiene (bathing, laundry and cleaning) and outdoor comprising of car washing, kitchen gardens, livestock watering and yard cleaning [19]. In order to have a sustainable water distribution plan, factors affecting water consumption at household level are vital [18, 20, 21]. Sobsey [22] pointed out introduction of water supply without considering socio-cultural aspects of the community is unlikely to be successful or sustainable. Several studies done globally have showed various factors such as, number of people in family, level of maintenance of water supply system, education and age of household head, income, distance to water source and type of water source are the significant driving variables to determine the amount of domestic water use [18, 20, 23-27].The international drinking water supply and sanitation decade, 1981-1990 focused on technical aspects and eventually by 1990, water services domain enlarged from 77 to 82% in urban areas however; significant implications have not been observed in context of Afghanistan due to several political issues. Moreover, the Dublin principles, 1992 developed by water specialists stressed water development and management should be based on participatory approach, involving users, planners and policy-makers (including women) at all levels [28] but anew, nothing has been adopted or implemented yet although it is currently under progress. Water management problems raised by improper planning, climatic influence, transboundary arguments and frequent droughts are most important issues in Afghanistan, however; no comprehensive study has been conducted to tackle them. Therefore, the present study is aimed to have an all-inclusive study of the existing pattern of urban household water consumption status in Afghanistan by considering Kandahar city as a case. Firstly, an empirical analysis of water sources to meet domestic water demand was done followed by, attribution of water sources on public health. Finally, identification of factors influencing water consumption pattern was done. The results of the present study will enhance the knowledge of water accessibility and factors contributing to the household consumption of water and will be favorable to foster new strategies and devise new plans for water supply scheme expansion. Moreover, it will also contribute in eradication of poverty, improve health and environment.
2. Methodology
2.1. Study Area
- Kandahar city extending 250 km2 area is the capital city of the Kandahar province located in southern part of Afghanistan (Fig. 1). The city lies at an elevation of 1005 m above mean sea level and also second largest city in the country [29]. The geographical location of the city extends from 65° 35′ - 65° 48′ E longitudes and 31° 25′ - 31° 50′ N latitudes. Due to its physiographic location, the city experiences arid and hot climate. The minimum and maximum temperature ranges from 0 - 23°C and 12 - 40°C with higher magnitudes in summer (May to August). The average annual precipitation is merely 191 mm which occurs for a total number of 29 days annually indicating the dryness and necessity of appropriate water management strategies necessary in the region.
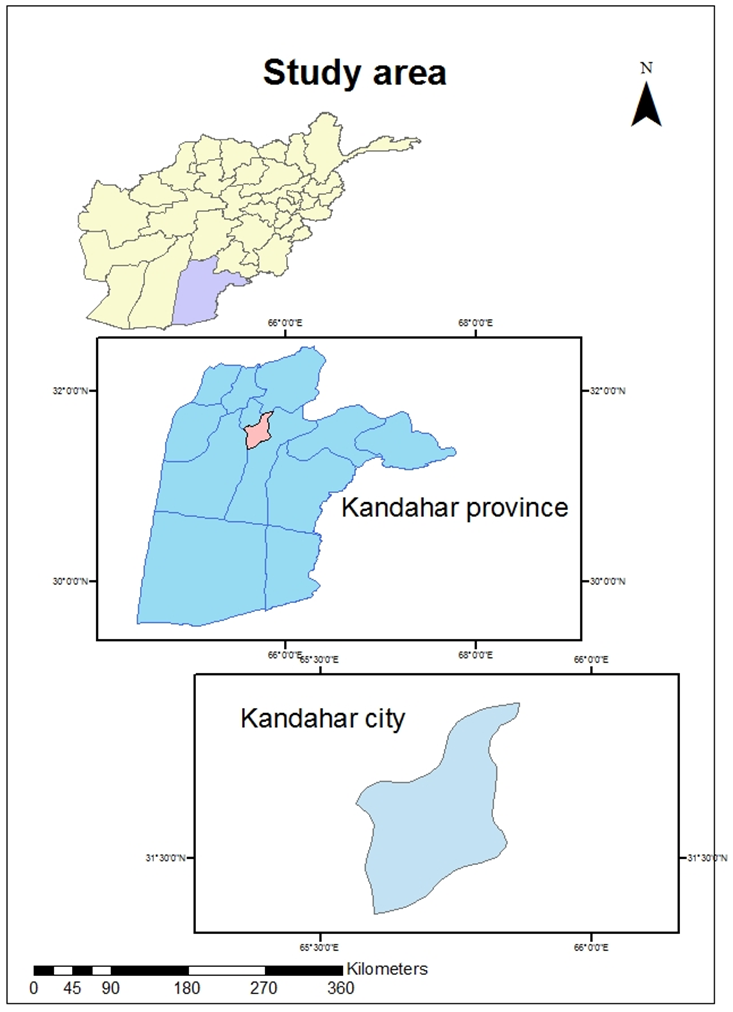 | Figure 1. Location of study area - Kandahar City |
2.2. Water Resources in Kandahar
- The present agricultural water supply is mainly provided by the surface water drawn from Arghandab river which has a mean annual flow of 32.9 m3/s. Dahala dam constructed across the river with a capacity of 479 MCM is mainly used for supplying water for irrigation which consumes approximately 98% of the captured water during dry season [30]. Furthermore, the present domestic and the industrial water supply are provided by the groundwater sources which are exclusively dependent on the Arghandab river in terms of recharge. Past estimates by Qureshi [31] indicates that whole Afghanistan has a total potential water resource of 75 billion cubic meters (BCM) of which 55 BCM is contributed by surface water whereas, 20 BCM by groundwater. Approximately, 15 per cent of the total volume of water used annually originates from alluvial groundwater aquifers (9%) and springs (6%). 98% of the extracted groundwater is used for irrigation followed using 1.5% of the remaining amount which is used for domestic consumption. Furthermore, it was reported that the potential annual groundwater use is 18 BCM; however, the use is limited to 3 BCM for the year 2004 which was expected to be 5 BCM in the future [11]. Specifically, for Kandahar, the safe yield for the production wells is estimated to be 30 L/s allowing a drawdown of 10 m [32]. However, due to the increasing demand of food contributing to expansion of agricultural lands, increased amount of water from tube wells is diverted for irrigation and thus affecting the water flow in river. This excessive supply of groundwater has significantly altered the water table in the city ranging from 6.2 to 19.9 m in past 30 years [32].
2.3. Water Supply in Kandahar
- Currently the domestic water supply is being provided by Central Authority for Water Supply and Sanitation (CAWSS) Kandahar, which draws water from four production wells later purified and supplied for consumption. Although, the wells were designed to meet the total demand of entire city however, due to their long running, instead of the designed discharge (0.338 m3/s) approximately 70% (0.232 m3/s) is available [33].
2.4. Data Collection and Sampling
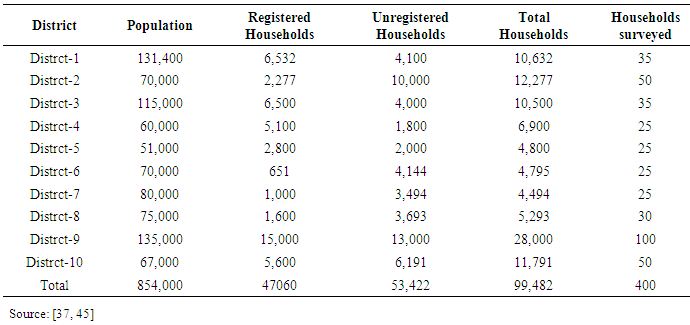
- The study is based on both primary and secondary data. The data were collected through a field survey throughout Kandahar city from December 2011 to January 2012. Total population of Kandahar city is 850,000 with an average family size of 10 [33]. In the present study, we employed Slovin’s formula [34-36], in order to identify the total sample size as in Eq. 1 with a limited error of 5% which yields a total sample size of 400. The selected sample size was further classified into the 10 districts as in Table 1 based on the distribution of households.
 | (1) |
|
2.5. Data Analysis
- Descriptive statistics (frequency, percentage, means and standard deviation) was used to assess the socio-economic status, water use economics and per capita water consumption of the families in the city. Furthermore, to assess the relationship of various factors on water consumption pattern, Pearson correlation coefficients were also derived among the variables and water consumption using SPSS v 16.0. The factors considered in this study were selected based on intensive literature study which includes, per capita water consumption, education level of family head, family size, family head age, monthly income of family, tap water availability (if there are taps in the house of the interviewed families), average time to collect water, distance between water source and house, frequency of bathing (number of times people bath in a week in the interviewed families), garden area and groundwater table depth.
3. Results and Discussion
3.1. Households’ Characteristics
- Single and extended families are the two predominant family types in Kandahar city. A single family consists of only one family while extended consists of more than one family together under one ceiling. Our survey suggests 71.2% of the total households contribute to single families which is well inline to the outcomes of [37]. Fig. 2 illustrates the household size in terms of number of people in a family showing the frequency and percentage. Evidently, 37.5% families comprise of 7 to 9 people followed by family size of 4 to 6 (33%). Further, 16% of families have size of 10 to 12 which has significant contribution in water use (discussed later). On average, the size of family ranges from 10 to 12 which is well supported by Mohammad and colleagues [37] and Balakarzai [33]; however, it is higher than the national average family size which is 7 to 8 [38].
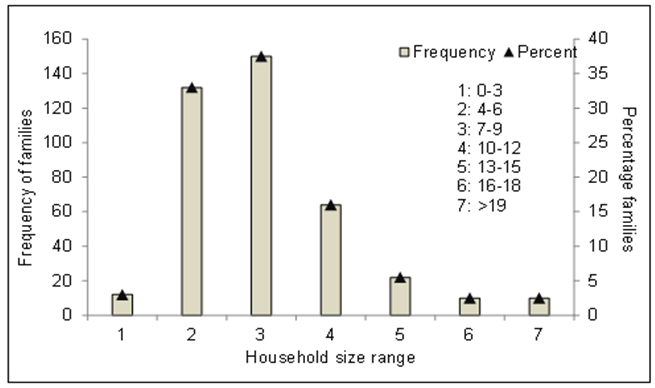 | Figure 2. Family size based on number of members at Kandahar city |
3.2. Economic Status of Households at Kandahar City
- The national average poverty line is 1242 Afghani (Af) i.e. (27$) per person per month (1 US$ = 46 Af) and the per-capita expenditure is 920 Af (20$) [38]. Although previous study in the region reflects large proportion of people falls in middle income category (15,000 – 20,000 Af/month) [37], however our study reflects both high and low income are predominant in Kandahar city with share of 37.5 and 35.5% respectively (Fig. 3). The difference in the results can be attributed to the higher number of respondents considered in our study (400) relative to the previous (100). In addition, the difference is also possibly due to the fact that some districts were over whereas some were under represented by the number of families interviewed.
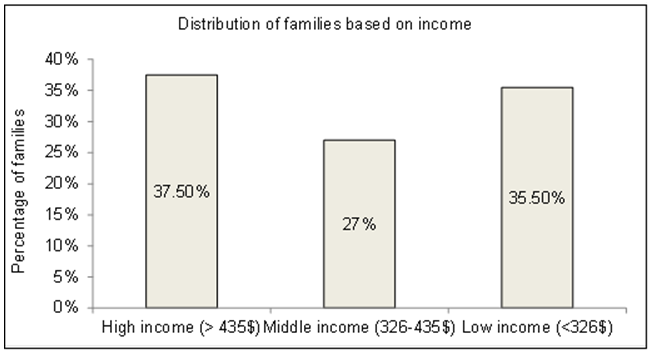 | Figure 3. Household groups based on income at Kandahar city (1 US$ = 46 Afghani) |
3.3. Status of Domestic Water Connections
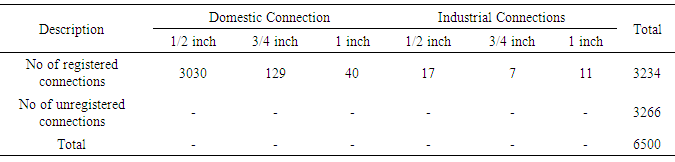
- Central Authority for Water Supply and Sanitation (CAWSS) provides water connections through three pipe sizes ½ (small), ¾ (medium) and 1 inch (large). The secondary data collected illustrates although there are 47,060 registered houses yet, CAWSS is capable of providing domestic water to 6.8% of total houses for whom tap water is exclusive source of water. In addition, the discharge is inconsistent, which is available for a maximum of six hours per day. Table 2 shows the number and types of connections provided by CAWSS at Kandahar city. It can also be observed that the organization provides 35 large, medium and small connections to the industries. Furthermore, CAWSS has 3266 unregistered connections in the city throughout all districts however, relative to the total number of unregistered houses, the connections are insignificant. In total, considering both kind of connections, 7.8% solely and 6.8% combined with private tube wells of households are provided with water supply by CAWSS. Moreover, it is worth to notice that majority of connections provided are of lower diameter pipes which is also a limitation of CAWSS in the region. Due to the inability of CAWSS to provide water for all houses, people are forced to opt for other water sources for survival (discussed in later sections).
|
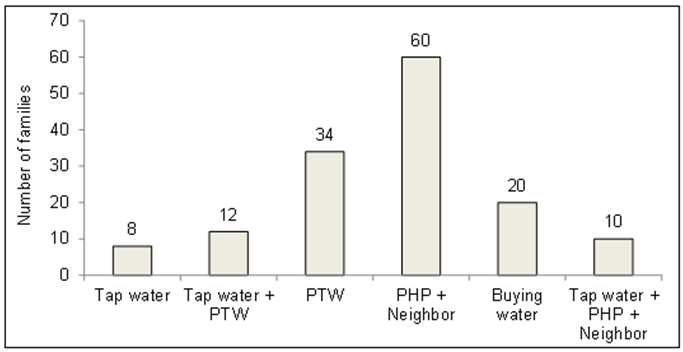
3.4. Sources of Water for Domestic Consumption
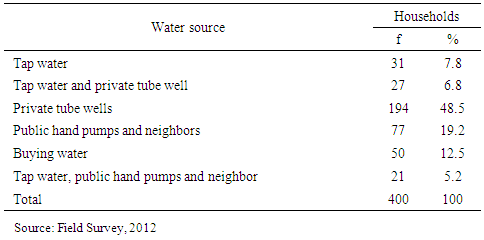
- As discussed in earlier section, CAWSS is able to provide domestic water for 7.8% of total households (solely dependent on tap water) considered in the city (Table 3). Besides, 6.8% families are dependent on dual sources of tap water from CAWSS and private tube well (PTW). It is evident that in Kandahar city, majority of people relies on public tube well (48.5%) which has significant influence on the groundwater sources. 19.2% of families depend on public hand pumps (PHP) and neighbor water sources for survival. Generally, the economic status of the people of this group is destitute (Table 4) where they cannot afford to have public tube well in their houses due to its high initial investment (discussed later). Furthermore, 12.5% of people buy water from private sources and 5.2% of families receive water from tap water, public hand pumps and neighbors since they do not receive sufficient water from water supply network. It is evident from this section that economic status of the family significantly controls the water source.
|
3.5. Relationship between Family Income and Per Capita Water Consumption
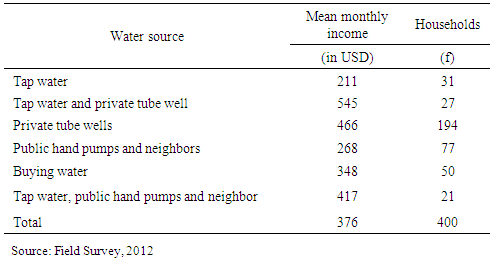
- Family income is observed to be the most influential factor on average household water consumption. Questionnaire focusing on income of family and their water source illustrates households with lowest income (211 US$) relies on tap water which is supplied by the government i.e. CAWSS (Table 4). Further, the second lowest income families (268$) comprising of 77 households are dependent on free sources of water i.e. public hand pumps and neighbors. Evidently, this implies that families with low income thrive for free sources of water for survival. The middle-class families without access to tap water and public hand pumps prefer to buy water from street vendors due to their affordability. Moreover, it is also evident that highest income families (545 and 466 US$) are dependent on private sources of water i.e. private tube wells which require higher initial investment (discussed later). This implies with the increase in income of family, per capita water consumption is higher. The use of water for kitchen gardens, more members in the family and cleanliness of houses can be attributed for the additional water demand for these families relative to lower income ones. It is further clarified by the Fig. 4 where an attempt is made to relate daily water consumption in terms of liters per capita per day and monthly income (US$). Results suggest a positive relationship persists among the various income groups and the per capita water demand. Nonetheless, the average per capita water consumption of Kandahar city is found to be 59 lpcd.
|
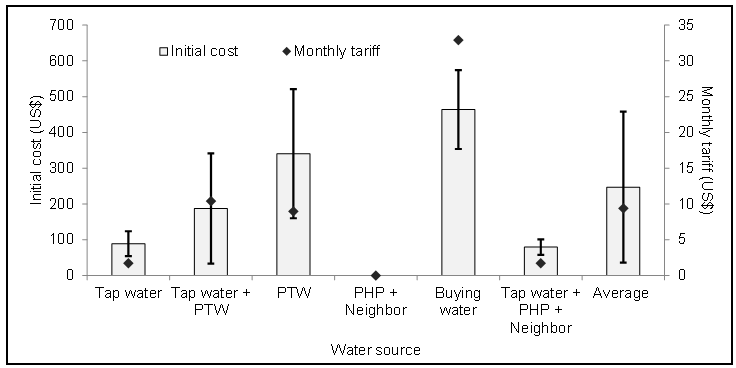
3.6. Relationship between Sources of Water and Domestic Water Cost
- Literature suggests cost of water has significant influence on water consumption and it is important to be considered in Kandahar context due to the absence of proper water supply system in the city, moreover due to dependence of people on other water sources. The cost associated in water supply can be divided into two parts, the initial cost associated to set up the system or construct water storage structure and the monthly revenue to be paid. Although, the initial investment varies widely among the districts in the city however, in this study we have provided the average initial cost in the city along with the standard deviations based on the survey (Fig. 5). Our results illustrate the water consumer group with public hand pumps and neighbor as the source has nil initial investment whereas tap water associated groups (tap water, tap water + public hand pumps+ neighbor) exhibits minimum initial investment (<100 US$). Furthermore, maximum investment is observed in the water buying group (464 ± 110.5 US$) since they prefer to store water in large containers. In addition, it is also evident that the group with PTW spend high amount (340.6 ± 180.7 US$) relative to other groups, nonetheless highest frequency of respondents is observed in this group (discussed in earlier sections). This implies although there are other economical alternatives to receive domestic water, yet the families with higher income are not willing to compromise with their current water source. This is possibly due to the will to have an independent private source of water as finance is not a big issue for the families. Nevertheless, the average annual initial cost of Kandahar city is observed to be 246.9 US$ with a high deviation of 211.4 US$. Further questions focusing on monthly expenses associated to domestic water access groups reveal that maximum tariff is being paid by the water buying class (32.90 US$). Moreover, as predicted, no tariff is required to be paid by 19.2% of the population depending on public hand pumps and neighbor. Further lowest tariff (1.70 US$/month) is being bared by the people dependent on tap water supplied; however, it consumes immense time to collect water additionally, water quality is also arguable. Families dependent on PTW for water supply are required to pay 8.95 US$ for their monthly electricity bills due to the pump. Nevertheless, based on our survey, in average families of Kandahar city spends 9.40 US$ for monthly domestic water access or maintenance and operation of existing systems.
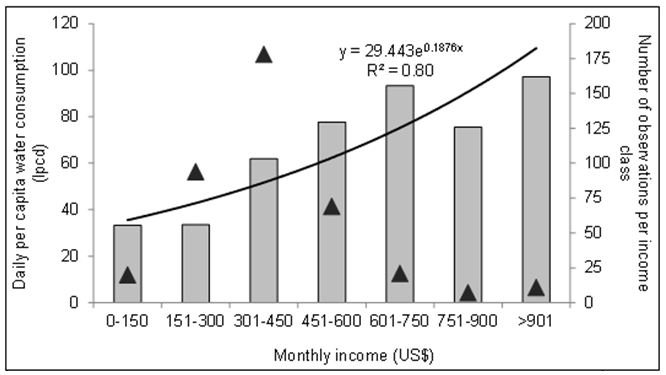 | Figure 4. Per capita water consumption among various income groups |
 | Figure 5. Observed initial cost and monthly tariff of different water sources at Kandahar city (Error bars indicate standard deviation of initial cost based on water sources) |
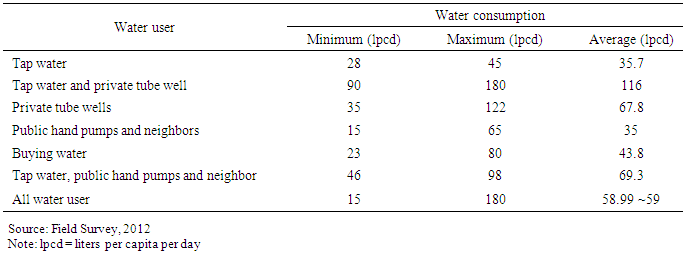
3.7. Household Water Consumption Pattern
- A key target of this study was to assess the household per capita water consumption pattern throughout the city. Our results illustrate the per capita water consumption pattern varies widely among the water user groups (Table 5). Focus questions targeted to disclose the influencing factors on per capita water consumption reveals existing very shallow water table redirects people to buy water and therefore higher economics associated with it plays a key role for conjunctive use. In addition, water source is also observed to be an influencing factor; for instance, people dependent on public hand pumps and neighbors (free source) use more water relative to people dependent on tap water. Nonetheless, average water consumption in Kandahar city is observed to be 59 liters per capita per day which pinpoints the region has better access to water compared to national scale where merely 5 to 7% people can afford to have 50 liters per capita per day [7].
|
3.8. Source Based Micro-component Analysis of Water Consumption
- The micro-component water consumption includes washing cloth, shower, washing utensils, cooking, house garden and toilet. However, the frequency and use of water for these components varies with the source of water for the families. The micro-component analysis shows that 100 and 91.75% of families with supply network along with private tube well (PTW) and PTW as sole water source respectively use washing machines for cleaning their clothes (Table 6). This is probably due to the will of the people to have a higher standard of life since income is higher along with availability of private source of water. It is also noteworthy that 72.73 and 72% of families depending on public hand pumps with neighbors and street vendors wash cloths by hands. This is possibly due to the lesser volume of water available to these families and therefore judiciously uses the water while washing by hand. Interestingly, 67.75% families with water from supply network also wash cloth using hands. In case of taking bath, 48.15 and 73.20% of 27 and 194 families using water from supply network along with PTW and PTW as sole source of water respectively use shower in their houses. Existence of private source of water at homes with sufficient water availability can be the contributing factor. Most of the families contributing to 76.19% of 21 households i.e. 16 families using water from supply, public hand pumps and neighbors take bath using bath tub. Furthermore, 76 (98.70%) from 77 households using water from public hand pumps and neighbors take bath using bucket water due to unavailability of sufficient water to take shower and use bath tub. In case of sanitation, 12 (44.44%) and 65 (33.51%) families out of 27 and 194 using water from supply along with PTW and PTW as sole water source respectively uses flush tank toilet. In addition, 27 (87.10%), 111 (57.21%) and 15 (55.56%) families with supply network, PTW and supply network along with PTW as source of water uses hand flush toilet. Families obtaining water from public hand pumps along with neighbors and street vendors share 88.31 and 76% out of 77 and 50 families in terms of using pit latrines. In case of kitchen use, 100% of families using water from supply network and PTW use Reverse Osmosis (RO) system of purification. Surprisingly, 54% of families i.e. 27 out of 50 households using water from street vendors also use RO system for water purification. 10 (47.62%) out of 21 families using water from supply, public hand pumps and neighbors uses simple filtration system at their homes prior to use of the water in their kitchen. 11 families contributing to 22% of households using water from street vendors use bottled water for their kitchen use. Surprisingly, 100% of families using water from public hand pumps and neighbors do not filter the water prior to the use in kitchen which has significant contribution in spreading water-borne diseases for this group of families (discusses later). Also, 156 (80.42%) and 17 (54.84%) out of 31 and 194 families using water from PTW and supply network respectively do not perform any filtration. This is possibly due to the assumption that the underground water is naturally pure whereas supply water is artificially treated and purified. Table 6 also shows that easy access to water has significant contribution to the availability of kitchen garden in the families. For instance, households with supply network along with PTW and supply along with public hand pumps and neighbors contribute to 37.04 and 19.05% of families with kitchen garden since they have surplus water and higher income relative to families with other source of water.
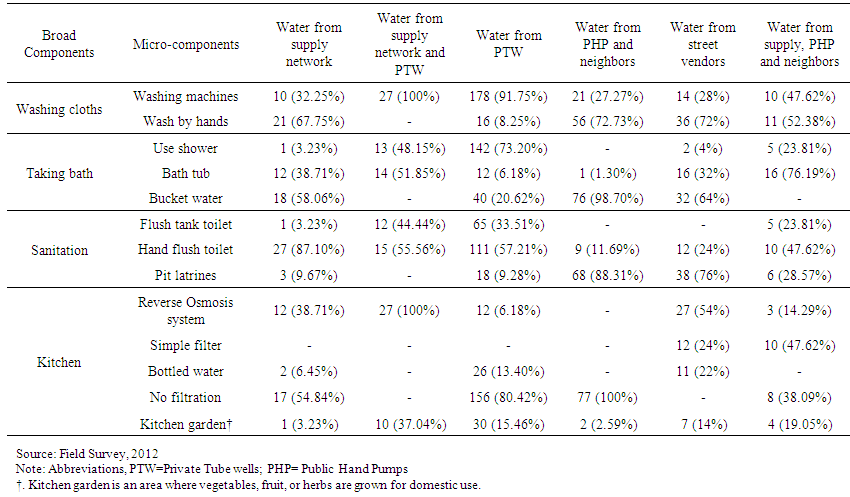 | Table 6. Micro-component based water consumption corresponding to water source |
3.9. Water Source and Health
- Last part of the questionnaire focused on the health issues of the respondents and their families. In general, two types of diseases, water-borne and non-water-borne were spotlighted in the questionnaire, if the respondent or any family member ever has been affected by any of the two. In fact, it was difficult for respondents to understand the difference between these two types of diseases and therefore, we had to explain the symptoms of the water associated diseases namely diarrhea, cholera, typhoid fever and dysentery. Based on the survey, 144 (36%) respondents’ families are observed to have water-borne diseases in the past five years. Further analysis based on the source driven water-borne disease suggests 60 (41.67%) families depending on public hand pumps and neighbors suffer from water related disorders (Fig. 6). In addition, 34 (23.61%) families are found affected by water-borne diseases that are dependent on PTW. The probable reason may be the direct consumption of the water without treatment and hence installation of filtration system is of utmost importance. This illustrates, the aquifer is apparently contaminated and needs immediate attention for remediation or else from consumer’s perspective, shifting to other sources. In addition, our survey also suggests 20 (13.9%) families of the group dependent on buying water are also severely affected by water-borne diseases. Since this group is found to filter the water before consumption, the long storage time of water in the RCC tanks leading to higher microbial growth can be attributed. Moreover, higher number of families using improper sanitation (pit latrines) also can be the probable cause of higher affection. Lowest cases of water-borne diseases are observed for the group consuming tap water due to the proper treatment of the distributed water by CAWSS. Moreover, the people are also found to have proper sanitation facilities in their homes.
 | Figure 6. Number of respondents/family members affected by water-borne diseases, Note: Abbreviations, PTW=Private Tube wells; PHP= Public Hand Pumps |
3.10. Factors Affecting Domestic Water Consumption
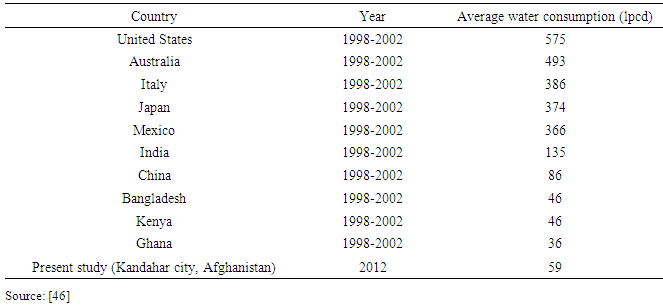
- The water consumption at households in Afghanistan is low relative to other developed and developing countries (Table 7). Therefore, in terms of demand management, it is necessary to identify the driving forces influencing the water demand. Establishing relationship among the demand (dependent variable) and the factors influencing (independent variables) by using correlation is a convenient method to trace the driving force [18]. In order to understand the relationship, correlation matrix is constructed among 10 variables (Table 8).
|
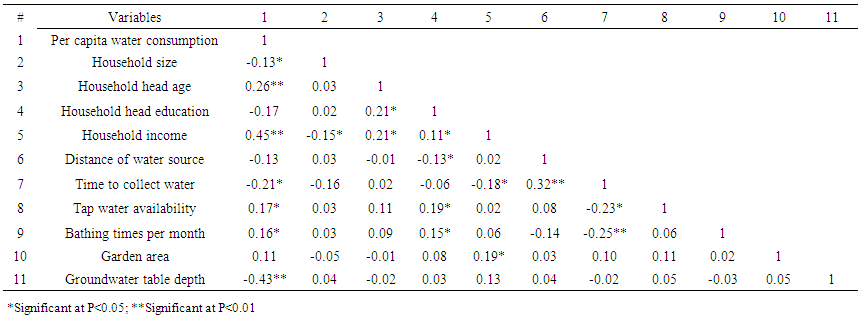 | Table 8. Correlation matrix of per capita water consumption and other independent variables |
4. Conclusions
- The findings of the present study concluded that majority of households had no access to water supply by Central Authority for Water Supply and Sanitation (CAWSS), Kandahar, therefore, they had to rely on other sources such as private tube wells, public hand pumps, vendors, and neighbors to meet their households’ water demand. This showed government’s inability to meet households’ water demand. The average domestic water consumption is found to be 59 liters per capita per day (lpcd). The analysis of findings showed that 7.8% of the households received their water from tap water solely, 6.8% from tap water and private tube wells, 48.5% from private tube wells solely, 19.2% from public hand pumps and neighbors, 12.5% bought water from street vendors solely and 5.2% got water from tap water, public hand pumps and neighbors. Water supply from the CAWSS was found safe in terms of least cases of water-borne diseases compared to other sources of water in the city. The results of the correlation analysis indicated that water consumption was significantly correlated with household size, the age of household head, household income, time to collect water, availability of tap water, bathing times per month and ground water table. The findings of the present study suggest that CAWSS Kandahar city must take measures for expanding the network of government administered water supply to the fulfill the households water consumption.
ACKNOWLEDGEMENTS
- Sincere thanks are given to the Norwegian government for the financial support provided to the first author to conduct this study which is a part of his master’s research work. The authors would like to thank the two anonymous reviewers and the editor of this journal for providing helpful comments on the manuscript that have substantially improved its quality.