-
Paper Information
- Paper Submission
-
Journal Information
- About This Journal
- Editorial Board
- Current Issue
- Archive
- Author Guidelines
- Contact Us
Resources and Environment
p-ISSN: 2163-2618 e-ISSN: 2163-2634
2017; 7(2): 31-39
doi:10.5923/j.re.20170702.01

The Strategy of Mangrove Forest Management due to Mitigation in North Coastal Area of Makassar
 Abstract
 Reference
 Full-Text PDF
 Full-text HTML
Abd. Rahman Bando1, Marsoedi2, Adi Susilo3, Andi Tamsil4
1Doctoral Program of Environment Science, Graduate School, University of Brawijaya, Malang, Indonesia
2Faculty of Fisheries and Marine Science, University of Brawijaya, Malang, Indonesia
3Faculty of Mathematics and Natural Science, University of Brawijaya, Malang, Indonesia
4Islamic University of Indonesia Makassar, Makassar, Indonesia
Correspondence to: Abd. Rahman Bando, Doctoral Program of Environment Science, Graduate School, University of Brawijaya, Malang, Indonesia.
| Email: |  |
Copyright © 2017 Scientific & Academic Publishing. All Rights Reserved.
This work is licensed under the Creative Commons Attribution International License (CC BY).
http://creativecommons.org/licenses/by/4.0/

The north coastal area of Makassar which includes 4 districts is a strategic region in Makassar, namely Untia, Bira, Parangloe, and Tallo. The villagers’’ activities put pressure on the sustainability of mangrove forests that could cause tidal flooding, large waves, pond damage and destruction of the residential areas due to high winds. This study was conducted to determine the issues, conditions, and problems related to mangrove forests in the north coastal area of Makassar. This study was expected to give a recommended strategies related to the mangrove forest management mitigation due to sea level rise. The research method of this was descriptive and quantitative by using geographic information systems, mangrove ecosystem analysis contemporary conditions and Strength, Weakness, Opportunities, Threat (SWOT) analysis. From this research, it was noted that the degradation of mangrove ecosystem and the rising of sea levels is caused by human activity, environmental condition and quality. The occurrence of sea level rise resulted in tidal flooding, high waves and strong winds with rare intensity; the categories of losses are still small. The recommended strategy for mangrove management is Diversification Strategy or Mobilization Strategy, means the activity of the program is in stable condition (solid and fortune). However, there will be a number of severe challenges and it will be difficult to face the threats when it is solely based on the previous strategies that have been used before. If so, organizations are advised to immediately reproduce a variety of tactical strategy. The proposed alternative program management of mangrove ecosystem in the north coastal area of Makassar is based on the damaged condition of the ecosystem and the indication of the damage which in the form of rehabilitation, maintaining and developing the potential of the available mangrove as a basis to manage the conservation and to enhance the role of the government, society, NGO, and private sector through public socialization, training and educating about the importance of mangrove forests function.
Keywords: Strategy, Mangrove, Mitigation, North coast, Makassar
Cite this paper: Abd. Rahman Bando, Marsoedi, Adi Susilo, Andi Tamsil, The Strategy of Mangrove Forest Management due to Mitigation in North Coastal Area of Makassar, Resources and Environment, Vol. 7 No. 2, 2017, pp. 31-39. doi: 10.5923/j.re.20170702.01.
Article Outline
1. Introduction
- Mangrove ecosystem is a tropical coastal vegetation community dominated by several species of mangrove trees that grow and thrive in the muddy tidal areas [1]. One role of mangrove forests in the sustainability of coastal areas is as a protector of the brunt of the waves. The thickness of the mangrove, width of 200 m--a density of 30 trees per 100 m2, with a trunk diameter of 15 cm can reduce about 50% of the tsunami wave energy [2]. Disaster mitigation is a process of seeking a variety of preventive measures in disaster management. These activities are done before the disaster had come so that the impact can be reduced [3]. People have a very big role in disaster management, and by that, their awareness needs to be increased as well as their concern and love for nature and environment also their awareness on the existing regulations.The north coastal area of Makassar which includes 4 villages is a strategic region in Makassar. The villagers’ activities put pressure on the sustainability of mangrove forests that could cause a threat such as tidal flooding, large waves hitting, the destruction of the pond by the blow of the waves, the destruction of the residential areas due to high winds. Data Centre of Environment Development Sulawesi states that the sea level rise in Kota Lama Makassar increased up to an average of 0.8 to 0.9 cm/year [4]. This suggests that the threat of coastal areas in Makassar because of climate change is real and it requires a strategic disaster mitigation step.In an effort to maintain the function of disaster mitigation due to climate change by mangrove ecosystems, it requires an information provision about the conditions and opportunities that support the mitigation management in the region including the coastal communities around the mangrove forest. Therefore, the review of public knowledge and perception on mangrove forests and disaster in disaster mitigation as a result of sea level rise is necessary to be presented as an important component part of mitigation measures. This research aims to identify the issues and problems related to the condition of mangrove forests in the coastal area of Makassar and to compile the strategy of mangrove forest management mitigation due to sea level rise.
2. Methodology
2.1. Data Collection
- The study was conducted in the north coastal area of Makassar, South Sulawesi which included the Villages of Buloa, Tallo, Parangloe, Untia, and Bira. It was conducted from November 2015 to August 2016. The data used in this study are primary and secondary data. Primary data consisted of data potential, the benefits of mangrove forests, and community social data. While secondary data included the data of sea level raise, the sources that support such research like the research that has been done before, PERDA or regional regulation that is related to the management and utilization of mangrove ecosystem, and the reports from relevant authorities. The methods of data collection in this study included: (1) the data on the status and condition of mangrove forests; (2) the social data of local culture and the image data in 2001 and 2015. The details of the data collection can be described as follows:
2.1.1. Condition of Mangrove Forests
- The ecological data of the mangrove was retrieved at 4 villages locations, namely Untia (station I and II), Bira (station II, IV, and V), Parangloe (station VI, VII, VIII and IX), and Tallo (station X). Each station observed for each variable which is the condition of the mangrove vegetation. Then for the collection of the mangrove vegetation data, it used the terraced path sampling methods. Terraced path method is a combination of plot and transects method [5]. The line is drawn perpendicular to the shoreline at the start of the vegetation outermost (near the sea) up to the border of the littoral area (mainland). The transect length and width is adjusted to the location of the research, then, the terraced plot is made with each size of 10x10m for trees, 5x5m for sapling, and 1x1m for seedling [5].
2.1.2. Socio-Cultural Data (Public Perception)
- The sampling was done by purposive sampling with the consideration that the samples are the people who lived in the area, so it is expected to provide a detailed condition in the study area. Socio-economic data were collected through the technique of depth interview and questionnaire. The number of respondents who were taken by questionnaire and interview was measured by using the formula [6].
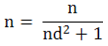 Descriptionn= the number of individual samplesN= the number of the populationd= degree of error (0.07)With the number of families as many as 8,915 families (1,953 in Buloa, 2,064 in Tallo, 2,050 in Parangloe, 421 in Kelurahan Untia and 2,427 in Bira, then the number of samples which are taken was as follows:
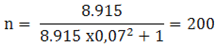 The samples of the respondents are the stakeholders which include the settled residents in coastal areas, community leaders, industry/investors, government, universities, and NGO.
2.1.3. Image Processing
- The data collection was performed by downloading the Google Earth satellite imagery in 2015. The technique application of remote sensing utilizes Google Earth imagery in 2001 and 2015 to determine the condition (changes) and the extent of mangrove forests in the north coastal area of Makassar.
2.2. Data Processing and Analysis
2.2.1. Descriptive and Quantitative Analysis
- The techniques of data analysis used in this research were descriptive and quantitative analysis. Descriptive analysis (univariate analysis) is the analysis of knowing the characteristics of each variable in the sample. Quantitative analysis was needed to see the frequency and percentage of each variable in the research sites.
2.2.2. GIS Analysis
- The stages of image processing include image correction, image cropping, composite image and closure classification, ground check, reclassification, image analysis (Vegetation Index Analysis), Vegetation Index image classification and the analysis of the changing extent of land cover [7].
2.2.3. Mangrove Condition Analysis
- The analysis of the mangrove condition covered:Diversity index (H’)Diversity index was used to determine a species diversification at every growth level [8]. It was calculated with the formula of:
 DescriptionH’: Diversity indexni: Number of individual type-x in the plots (PU), andn : The total number of individual in PUThe diversity index criteria were divided into 3 categories:H’ < 1 : Low diversity 1 < H’ < 3 : Medium diversityH’ > 3 : High diversityUniformity IndexUniformity was calculated by using Evenness Index [8]:
 Description E: Uniformity index of the species, genus or family, H’: Diversity index S: Number of species, genus or family found in PUThe range of uniformity index value was as follows:E < 0.4 : Small population uniformity 0.4 < E < 0.6: Medium population uniformityE > 0.6 : High population uniformityThe smaller the value of diversity index (H '), then the uniformity index (e) will also be smaller. It suggests that there is dominance in one species to another species.Mangrove Dominant IndexDominance Index was calculated based on the formula of index of dominance from Simpson [8] such as:
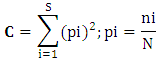 Description C: Dominance Indexni: The number of individual x-thN: The total number of individualThe range value of this index was explained in this following section:0.01 < C ≤ 0.30 : Low dominance0.31 < C ≤ 0.60 : Medium dominance0.61 < C ≤ 1.00 : High dominanceImportance Value IndexThe vegetation data that have been inventoried was tabulated and analysed by using the analysis of vegetation with the formula of [8]:Density
  DescriptionDi = Mass density (ind/m2)ni = The total number of i-species density standsA = The total area of the samplingRelative Density
 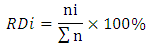 DescriptionRdi= The density is relatively important (%)ni = The total number of i-species density standsn = The total number of stands of all speciesFrequency
 DescriptionFi= species frequencyPi= Number of sample plots which found the i-speciesp = The total number of observed sample plotsRelative Frequency
 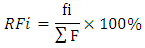 Description Rfi = species relative frequencyFi = species frequencyF = the amount of the frequencyCoverage
  where
where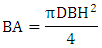 where
where  DescriptionCi = species coverage, BA (in cm2)DBH = i-tree diameter (cm)π = constant (3.1416)CBH = circle tree at chest heightRelative Coverage
 DescriptionCi = area closure of species iC = the total area for all speciesImportance Value Index
2.2.4. Status Analysis and the Damage Level
- The level of damage to mangrove forests was measured by using the Decree of the Minister of Environment Number: 201 in 2004 about the criteria and guidelines for mangrove destruction determination.
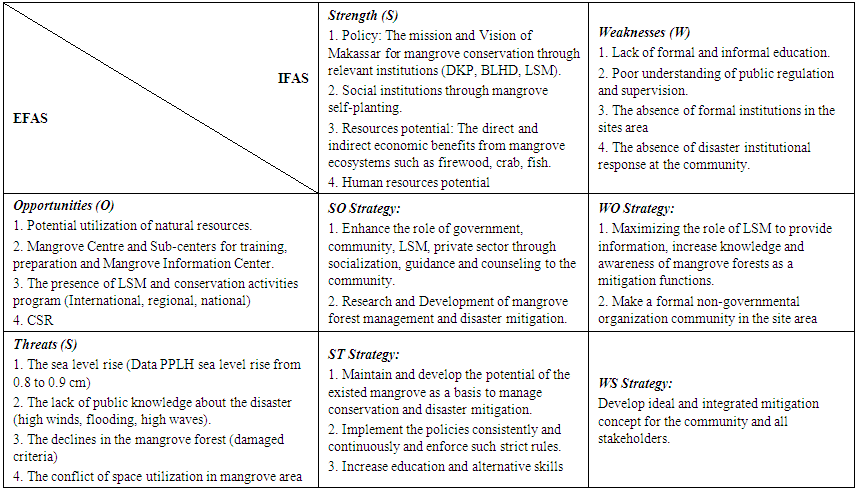
2.2.5. SWOT Analysis
- SWOT Analysis was based on the logic that maximizes strength and opportunities, but collectively it can minimize weaknesses and threats. A strategic decision-making process is always associated with the development, objectives, strategies, and policies of the mission. (1). SO strategy was to maximize the power of S (strength) to seize O (opportunities); (2). ST strategy is leveraging the power of S (strength) maximally to anticipate and address the T (threats); (3). WO strategy is to minimize W (weaknesses) to seize O (opportunities); (4). WT strategy is to minimize W (weaknesses) to avoid the T (threats) [9].
3. Results and Discussion
3.1. Research Location Overview
3.1.1. Administrative and Population
- Administratively, north coastal areas of Makassar included in the scope of 5 villages, namely Buloa, Tallo, Untia, Parangloe and Bira. The population of the 5 coastal villages was 36,639 people, or 2.6% of the total population in Makassar which amounted up to 1,429,242 people [10].
3.1.2. Territory Utilization
- The utilization in north coastal areas of Makassar were broke down into 5 activities, such as: (1). Fisheries: The north coastal area of Makassar is utilized as the capture site of sea organism such as fish and crabs. In coastal areas, there are several cultivation ponds managed by the local community; (2). Services: there are three ports namely Port of Perikanan Nusantara Untia, Community Port of Paotere and Soekarno Hatta Port; (3). Industrial Estate; (4). Settlement; (5). Tourism.
3.1.3. Oceanography
- Flow: the speed of the tidal current was averagely in the validation point; neap tidal conditions was in the range of 0.001 - 0,008 m / sec, while the full moon tidal conditions was in the range of 0.002 – 0.012 m / sec. Tidal: the type of the tides in coastal area of Makassar is a mixed type that tends to be “daily-single” with an amplitude of 0.88 – 2.18 m above the average sea level. Wave: the interval wave height was 1.1 up to 1.5 m, while the wave that occurred around the coastal area at low speed was ranging from 0.051 up to 0.10 m / s (76.79%) [10].
3.1.4. Typology of Disaster in the Coastal Area of Makassar
- AbrasionUntia beach was the bay area that adjacent to the mainland. It has a low wave effect because it only got the influence of the broken wave’s height of 1.1-1.5 m intervals. Meanwhile, the currents that occurred around Untia were also on a low speed, ranging from 0.051 up to 0.10 m / sec (76.79%). There is no abrasion around the northern coast, it was known through the mangrove that grows along the border of the coast and the sediment transport agent which relatively in a low force [10].WatershedThe Tallo River flow and its subsidiaries entered into various regions of Makassar to the edge of Hasanuddin campus, UMI campus, U45 campus, Governor Office and past the bridges, arterial, and local roads. This was very likely to be developed into a river stream pre-transportation. According to the Report of Tallo River Flood Control, Department of Irrigation, South Sulawesi [11], the river is tipped in Mount Kallapolompo which was ±1,100 m above the sea level with the width of Regional River Flow of ± 368 km2 and with the length of the river of ± 61.50 km. With a very gentle bottom slope, it caused a slow flow velocity which could cause an implication a high sedimentation [10]. The morphology in the winding and shaped meanders-downstream caused a deposition process that makes the river shallow. The depth of the river starting from upstream up to Tallo bridge is approximately 4m and into the estuary up to 6m. In the estuary, the river has evolved since the days of the Tallo Kingdom, characterized by the history sites and the tombs of the Tallo Kings. In this area, there has been such service activities and ship industry as well as wood industry and warehousing. Along Tallo River and Sinassara River, we could see some fishermen houses that have been developed almost until the water bodies. This changing process of swamp land into ponds is continued with the process of hoarding the ponds to be the land for some commercial building. This causes the flow of Tallo River in the downstream is reduced, where it will likely to cause a flooding when it rains, accompanied by insistence tides [10].Sea Level RiseSea level rise is the cause of the inundation flood in the north coastal area of Makassar. It potentially occurs although currently is still in a state of safe. Based on the scenario of sea level rise, it is known that in 2025 the total flooded area is 76.82 ha and it will increase up to 681.05 ha in the year of 2100. The land that is potentially flooded by the inundation in 2025 and 2050 is an industrial area, open land, mangrove forests, port area, education area, residential area, reclamation area, also shrubs and ponds. Furthermore, in the year of 2075 and 2100, it will expand up to the agricultural area [10].
3.2. Issues and Problems
3.2.1. Mangrove Forest Condition
- ExpansionBased on the results of image processing of the land coverage in 2001 and 2015 (fig. 1), the division of land use is classified into 9 classes including the land closure for industry, open land, mangrove, ports, housing, agriculture, shrubs, rivers, and ponds. The image analysis showed the large of mangrove forest area for 50.3 ha in 2001, while in 2015 it covers for 58.53 ha means that the mangrove forests have expanded for 8.23 ha.
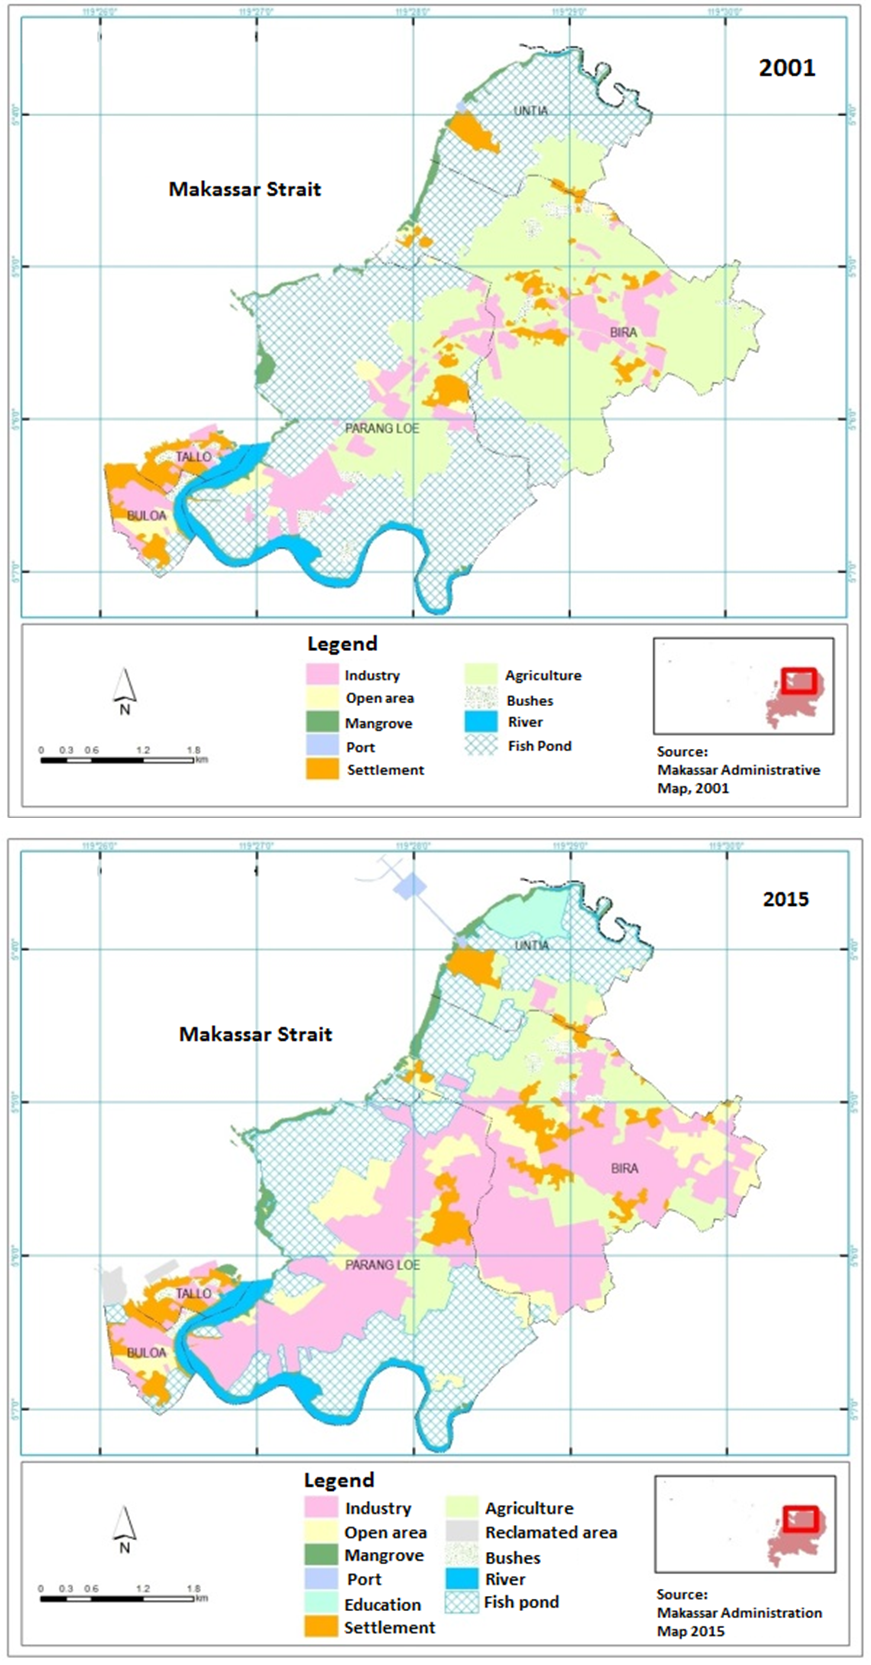 | Figure 1. Land Coverage in 2001 and 2015 |
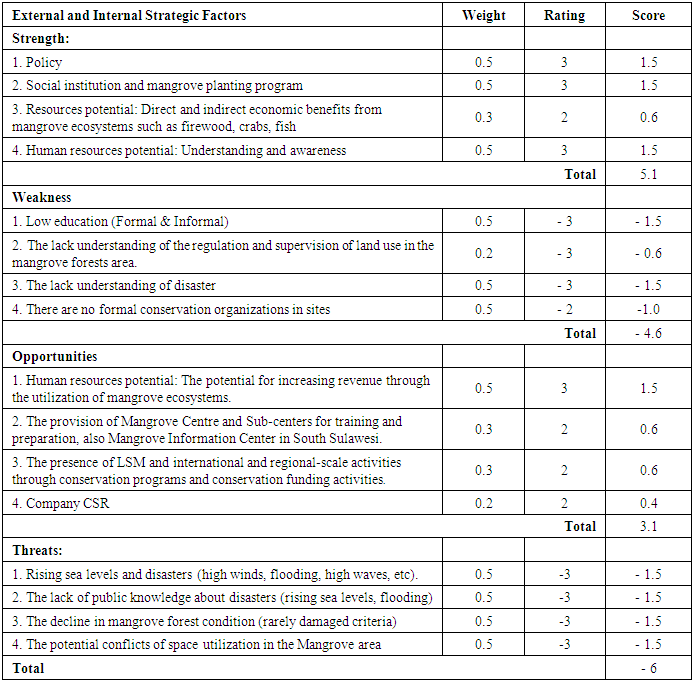 | Table 1. External and Internal Strategic Factors (IFAS and EFAS) Matrix Scoring |
 | Table 2. SWOT Matrix Strategy |
 | Table 3. Alternative Strategies Scoring |
3.2.2. The Perception of Mangrove Forests
- Activities in the Mangrove Forest There were 5 categories of activities undertaken in the mangrove forests area including fishing, firewood, cultivation, tourism, and others. The activities which associated with mangrove forest have the average value percentage that reached 54.60%, while the activities that have relation to the mangrove forests were 45.40%. The activities which related with mangrove forests consisted of fishing activities (21.12%), fish cultivation (11.85%), firewood (3.88%), tourist activities (0.36%) and other activities (17.40%).The Cause of Damaged Mangrove Forest EcosystemThere are several factors that cause damage to mangrove forests, at this time it is caused by human factors and physical factors of nature. Human factors include logging, ponds conversion, buildings conversion and others. The average value of the percentage that indicated the damage of mangrove forests as a result of human activities was as much as 72.56% and other causes as much as 3.33%, while the unrecognizable cause was as much as 24.10%.The Knowledge of Mangrove Forest FunctionThe respondents knew that mangrove forests have a protective function, tidal flood prevention and a place for fish spawning. The perceptions of mangrove forest function have a positive value since it reached a percentage of 85.96%, others are mounted up to 2.76%, while the other who does not know the function of mangrove forests amounts to only 12.96%.The Utilization Rate of Mangrove ForestsThe percentage of respondents which the perception continues to grow was increased by 10.68%, the perception of respondents who fixed is at 17.91% while the perception that is reduced is in the amount of 47.59%, and those who did not aware was 23.81% while others were amounted to 0%. The rate of the perception of mangrove forest utilization is decreased due to public knowledge in the entire village that already know the function and benefits of mangrove forests.Mangrove Forest Conservation The average percentage to invest in the conservation activities reached 64.18%; the knowledge of the utilization rules only reached 3.94%; other activities are amounted to be only 6.51% while those who answer that they know nothing is 25.37%. The activities of preservation and protection of mangroves started at the initiative of the government with a percentage of average value as much as 53.86%. However, the 12.33% of the respondents consider that local community has the initiative in conducting the conservation, and other actors for as much as 9.81% while the 23.99% indicates that the respondents did not know who started this mangrove conservation and protection in the coastal region.
3.3. Strategy
3.3.1. Strategy Analysis
- The result of the coordinate calculation is as follows: The coordinate point is located at (0.5 – 1.45). If it is based on the matrix quadrants, then the position in quadrant II (positive, negative) means that this position signifies a strong (potential and opportunities), but face such great challenges (threats and weaknesses). The recommended strategy is the diversification strategy.
3.3.2. Strategy Priority
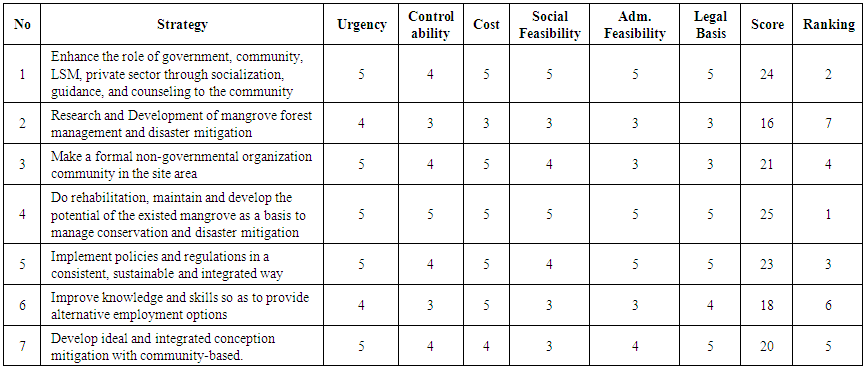
- To further concentrate and determine the strategic priorities for mangrove forest management, then it prepared such critical success factors that are developed from alternative strategy (Fig. 2) shown in this following alternative strategy table scoring.
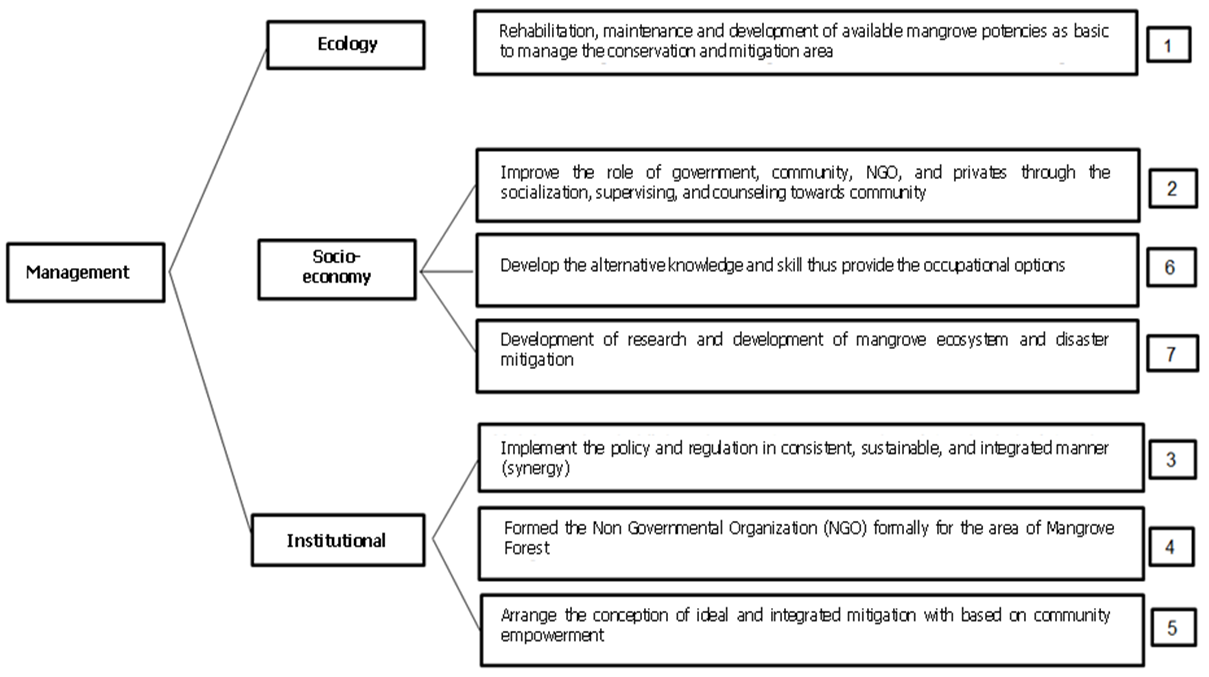 | Figure 2. The Priority of Mangrove Strategic Management |
4. Conclusions
- Issues and problems in north coastal area of Makassar occurred due to the Mangrove ecosystem degradation and sea level rise. These environmental degradations is mainly caused by: (a) Human activity that includes land clearing for residential and industrial; ponds and firewood, (b) The condition and quality of the environment that covers domestic household waste, sedimentation, water quality, and (c) Pests and diseases. The occurrence of sea level rise results in tidal flooding, high waves and strong winds with a rare intensity and low losses category.The recommended strategic management of mangrove is the Diversification Strategy or Mobilization Strategy, means the activity is in a stable condition (strengths and opportunities), but it seems to face a number of tough challenges that are expected to be the obstacles in facing the threat when it only relies on previous strategies that have been used. Therefore, organizations are advised to immediately add a variety of tactical strategy. Alternative program management of mangrove ecosystems in the north coastal area of Makassar which is proposed based on the damage condition of ecosystems and the indication of the cause of the damage is in the form of rehabilitation, maintaining and developing the potential of the existed mangrove. It is used as a basis to manage the conservation and enhancement of the government, community, NGO, and private sector through socialization, guidance, and counselling to the public about the importance of mangrove forests function.