-
Paper Information
- Paper Submission
-
Journal Information
- About This Journal
- Editorial Board
- Current Issue
- Archive
- Author Guidelines
- Contact Us
Resources and Environment
p-ISSN: 2163-2618 e-ISSN: 2163-2634
2016; 6(6): 127-135
doi:10.5923/j.re.20160606.05

Dynamics of Land Use Land Cover Change and Urbanization in Jigjiga Town, Ethiopian Somali Regional State, Eastern Ethiopia
 Abstract
 Reference
 Full-Text PDF
 Full-text HTML
Weldegebriel Mebrahtu Gebregergis1, Habtamu Atelaw Gebre1, Barana Babiso Badesso2
1Department of Geography and Environmental Studies, Jigjiga University, Jigjiga, Ethiopia
2Department of Geography and Environmental Studies, Wolaita Sodo University, Wolaita Sodo, Ethiopia
Correspondence to: Weldegebriel Mebrahtu Gebregergis, Department of Geography and Environmental Studies, Jigjiga University, Jigjiga, Ethiopia.
| Email: |  |
Copyright © 2016 Scientific & Academic Publishing. All Rights Reserved.
This work is licensed under the Creative Commons Attribution International License (CC BY).
http://creativecommons.org/licenses/by/4.0/

This paper describes mainly by focusing on the land use land cover dynamics of Jigjiga town, the capital of Ethiopian Somali region. The implications of changes was also investigated using the working power of GIS environment. Satellite images were integrated with GIS working interface and it was very effective in analyzing the direction, rate and spatial pattern of the changes. The time interval considered was fifteen years of different times and three land use land cover maps were produced from each year (1985, 2000 and 2015) at the specified interval. These time intervals were taken based on the prevalence of the government changes coming to power with their respective policies and strategies. The analysis shows that four major land use land cover classes exist in the area. These include built-up area, grass land, shrub land and open areas. They show changes at times with variation in magnitude and pattern of changes. During the study periods, built-up areas are getting continuous increment while grass lands are continuously decreasing. This indicates as the pre-existing grass land areas are highly converted in to either built-up areas or any open area left over unutilized. This is done due to the increase in population in the area demanding plots of areas for their survival. On the other hand, shrub lands shows fluctuations due to similarity of spectral reflectance patterns with either grass lands or open areas where as open areas got continual increase since there exists left over plots in between different blocks and units of built-ups. The major general factors of the land use land cover changes include population growth and density, encouraging urban expansion policies, being economic corridor of the area attracting many people from different corners of the country and land ownership condition. Therefore, level of urbanization is directly interrelated with the existence of appropriate urbanization policy. Generally, different land classes undergo changes overtime due to the existence of factors like policies, population number, land ownerships and satellite image analysis using ERDAS and ARcGIS software is a very effective method in such a study.
Keywords: Jigjiga town, LULC, GIS, Population growth, Land ownership
Cite this paper: Weldegebriel Mebrahtu Gebregergis, Habtamu Atelaw Gebre, Barana Babiso Badesso, Dynamics of Land Use Land Cover Change and Urbanization in Jigjiga Town, Ethiopian Somali Regional State, Eastern Ethiopia, Resources and Environment, Vol. 6 No. 6, 2016, pp. 127-135. doi: 10.5923/j.re.20160606.05.
Article Outline
1. Introduction
- Land use land cover change is by now the most prominent form of global environmental change phenomenon occurring at spatial and temporal scales [1]. Cities land use change is resulted from urbanization and development related activities in which most large cities are faced with urban sprawl problems, natural vegetation loss and open spaces prevalence [2]. Rapid and unplanned urbanization is a cause for environmental problems, bumpy living conditions and haphazard growth of cities [3] leading for detrimental impacts of human life. It is also obvious that highly productive peripheral agricultural areas are lost [4]. Therefore, it highly worth value to plan and control urbanization process systematically and in an integrated manner to maximize the benefits of the people [5-7]. It is unquestionable that, rapid growth of cities was held in Europe and North America following the industrial revolution [8] in which pollution becomes a series issue and urban expansion is diverting ecosystem integrity through biochemical cycles disruption [9]. After WW II and global trade liberalization, the influence of cities become global though land use change in which since then was local and regional [10, 11]. The substantial growth of cities in Africa, Asia and Latin America during the last 20th century with no giving due emphasis to systems of urban regulations for environmental protection also contributes for a considerable environmental degradation [3]. The [12] also strengths this idea by saying, in the near future due to large population growth of such areas (global south) severe urban ecosystem and biodiversity challenges will appear due to their weak systems of formal government and planning. Even though the relation between cities haphazard growth and environmental degradation stay long for urban dwellers, it is recently that cities governance is becoming a global agenda [13]. Awareness of environmental degradation and the planet as a system with limits to growth emerged in both civil society and among decision makers [14]. Recognizing cities as engines of economic growth and centers of production and consumption also implied acknowledging that cities drew on resources from all over the globe [10]. The interconnected global environmental agenda of cities is thus woven into the history of the wider global environmental agenda [15].Urbanization level in Africa (37.1%) is low as compared to developed countries like Europe (72.7%) and North America (79.1%). But urbanization in developing world (may reach to 3% or even 4% a year) is now progressing faster than developed one [16]. Ethiopia, which is a country in Africa is the least urbanized having only 16% of its population living in urban centers [17]. However, its rate of urbanization is 4.4% due to high population growth rate (2.73%), high rural-urban migration and increasing number of urban centers [18] with an average urban population growth of 3.98%. Hence, by 2050 about 42.1% of the total population is expected to be inhabited in urban centers [12].When it comes to Jigjiga town, it is one of Ethiopia’s intermediate towns which is growing alarmingly. The town is increasing at a rate of 9.9% per annum [19]. Therefore, the need for monitoring urban development is imperative to help curb the problems of Urban Sprawl and LULC dynamics [13]. Identification of the patterns of sprawl and analyses of spatial and temporal changes would help immensely in the planning of infrastructure facilities [6]. The present rate of population growth and the projected figures also signify the prime responsibility of the planning department to plan for a future housing development which is attractive, affordable and sustainable - socially, economically, culturally and environmentally.It is, therefore, the intention of this study to narrow, if not to fill, this gap and provide an in depth understanding of the patterns of LU dynamics, levels of urbanization and implications for planning appropriate land management in the study area.
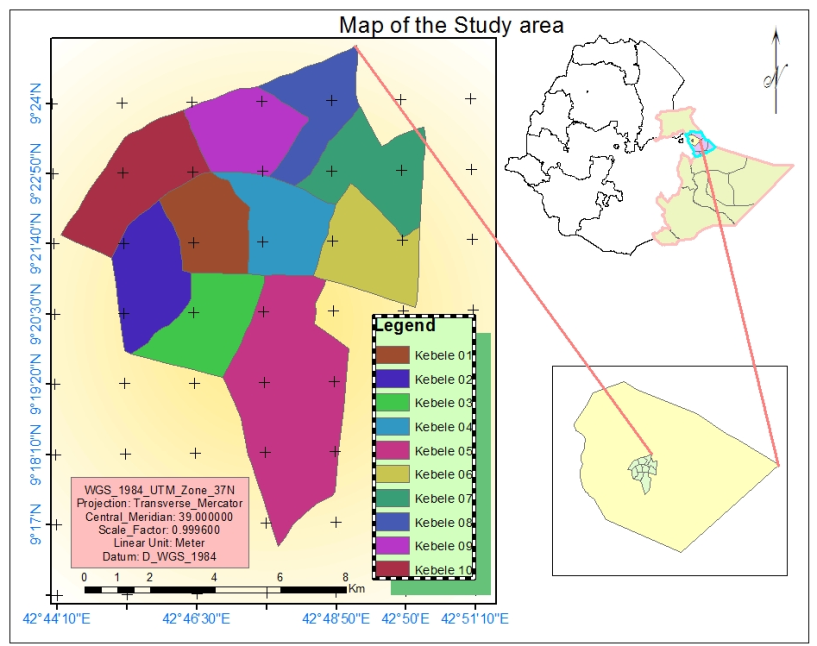 | Figure 1. Location map of the study area |
2. Study Area
- Jijiga town (which is the capital city of the Ethiopian Somali region) is found within fafan zone and is located at 675 km from Addis Ababa and at closer distance to Hargeyssa, the port of Somalia land. It is astronomically located at 9°30’ N latitude and 42°50’ E longitude. Relatively speaking it is bounded by towns of Hadew, chinaksen, Togochale and Lefe-isa in the West, North West, East and north east respectively. Because of its internal and local advantages, the town has high growth potential. Today it has become an important urban center in the region being playing pivotal role in the political, economic and social arena of the region [20]. Climate through its basic elements (Temperature, Rainfall, wind and humidity etc) has a significant influence in urban planning. Temperature has an influence on urban land use planning since it influences housing typology, housing units, extent of green area etc for enhancing human comfort and creating good urban environment [21]. Hence, the average annual temperature of the town is 20°C indicating the existence of sub-tropical temperature condition whereas the mean monthly temperature varies from 17.34°C to 21.43°C in December and April, respectively. The hottest month is May while December is the coldest month with an average annual temperature of 20.02°C [22] representing sub-tropical agro-climatic ecological zone. Accordingly, this subtropical temperature condition in general has moderate impact on urban land use planning; housing typology and spacing [21]. The mean annual rainfall of Jijiga is just about 598 mm. The mean monthly amount of rainfall varies between 10.2 mm to 102.2 mm in February and April, respectively [22].
3. Methodology
- Since land use land cover analysis is a complex phenomenon, it becomes difficult to effectively analyze it using a single research design. Hence, a mixed design that includes (qualitative and quantitative approaches) was applied for this research due to its importance for triangulation of sources and interpretation.Data was collected from sources (both primary and secondary sources) using instruments of hand held GPS (for collecting training and ground verification data used for image classification and accuracy assessment respectively), in depth interview with key informants (about the types, impact, magnitude, distribution and ways of mitigation), and reviewing of related documents such as articles journals, books and census reports. Method of data analysisPre-processing of satellite images prior to image classification and change detection is essential. Due to spatial, spectral, temporal and radiometric resolution constraints, the complexity of physical environment cannot be accurately recorded by normal remote sensing sensors [23]. Hence, before performing the classification of remote sensing data, it is important to pre-process the data to correct the error during scanning, transmission and recording of the data [24]. Radiometric correction was performed for correcting the data for sensor irregularities and compensating the effects of atmosphere through histogram equalization, haze and noise reduction. Image enhancement was performed in order to improve the quality of the image. Suitable band selection of different false color composite images was done to enhance the raw satellite image for identification of different land cover classes in the study area.Image Classification and Accuracy Assessment In this study unsupervised and supervised image classification operations were performed to produce land use and land cover maps of the study area from land sat images. Firstly, Preliminary land use and land cover classes were determined based on the information acquired from unsupervised classification and field observation. Then Landsat images of each study year were independently classified with supervised classification technique. Maximum Likelihood Algorithm was applied to classify the land use and land cover types in ERDAS Imagine 10 software. Finally, the accuracy of the classification results was tested using data for accuracy assessment. Therefore, the error matrices and other statistics, which includes producers and user’s accuracy and kappa statistic, were employed to determine the accuracy of classes obtained from the image classification Process. In this study, Post classification method was used to detect analysis of land use and land cover changes. It is used when users separately classify two temporal satellite images and then differentiate those two date classified images. In this study, the Post classification comparison was employed using separately classified Landsat images and then a comparison was made for the LULC maps.
4. Results
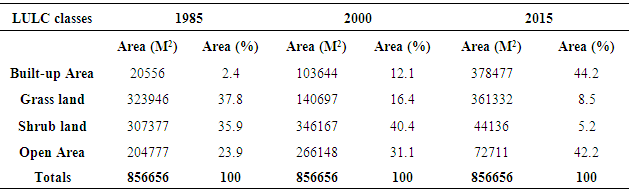
- Accuracy AssessmentIt is inevitable that errors occur from any digitally generated land cover maps of remote sensing imagery. These errors may result from the source (error during data acquisition) or image processing (errors of classification techniques). Therefore, an assessment of the classification accuracy is needed to guaranty the reliability of the result [23]. Accuracy assessment helps to evaluate a classified image file. The accuracy assessment cell array is an organized way of comparing your classification with ground truth data, previously tested maps, aerial photos, or other data [24]. There is some similarity between accuracy assessment and training classifiers in that both use the same data sets. However, there is a possibility for overestimation of classification accuracy simply because of using the same data sets both for training and testing purposes. To avoid this problem, it is good to use randomly selected pixels, which can be checked with reference to ground verified data [25]. The values of Kappa statistics are categorized into 3 groups based on agreement of classification: a value of greater than 0.8, between 0.4 - 0.8 and below 0.4 represents strong, moderate and poor agreements of classification respectively [26]. The accuracy assessment result for this classification made in ERDAS imagines software provides an overall classification accuracy of 84% and 0.7728 kappa statistics indicating as the classification reveals moderately agreed and acceptable result of classification.Land use land cover distributions From the below classified map of jigjiga town in 1985, it is possible to observe that the highest portion of land use land cover was occupied by Grassland (37.8%), followed by shrub land (35.9%) and Open Area (23.9%). On the contrary, the least percentage of land use land cover share was occupied by Built-up Area (2.4%). This difference in percentage share of land classes at this period was attributed to the existence of insecurity revealing low population number, inappropriate urban development policy, people’s low attitude of settling in urban areas being life at the time was highly associated with pastoral activities and even above all the low level development of country. Such conditions in turn leads for the domination of grass lands and shrubs by allowing for the existence of naturally prevailing vegetation type land covers. In relation to this [27] also found in his study that in areas where low population number and questionable security issues prevail, there is low level of urbanization and more of vegetation type cover domination. Particularly, [20] on his analysis to the city says, the area where the town of Jigjiga is located was once a forest area covered with indigenous trees, mainly acacia. Inside the forest a number of wild animals such as: lion, leopard, hyena, elephant, gazelle, bushbuck, ostrich and others are reported to have sheltered. The area was also rich in pasture with abundant water resource. This idea supports being the area in 1985 was dominantly covered with grasses and shrubs.
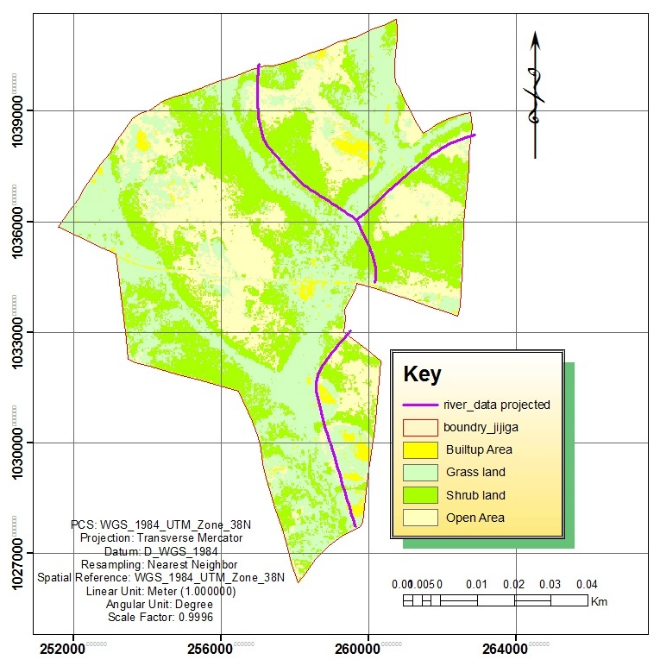 | Figure 2. Land use land cover of jigjiga town in 1985 |
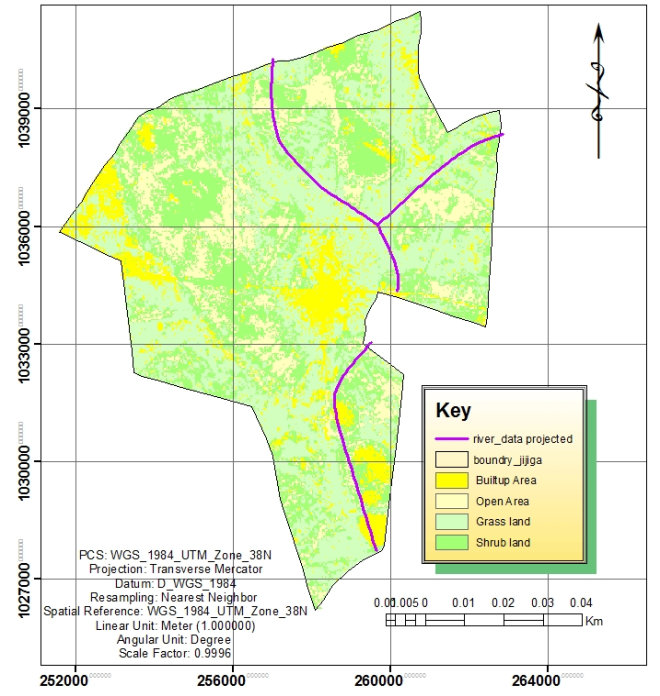 | Figure 3. Land use land cover of jigjiga town in 2000 |
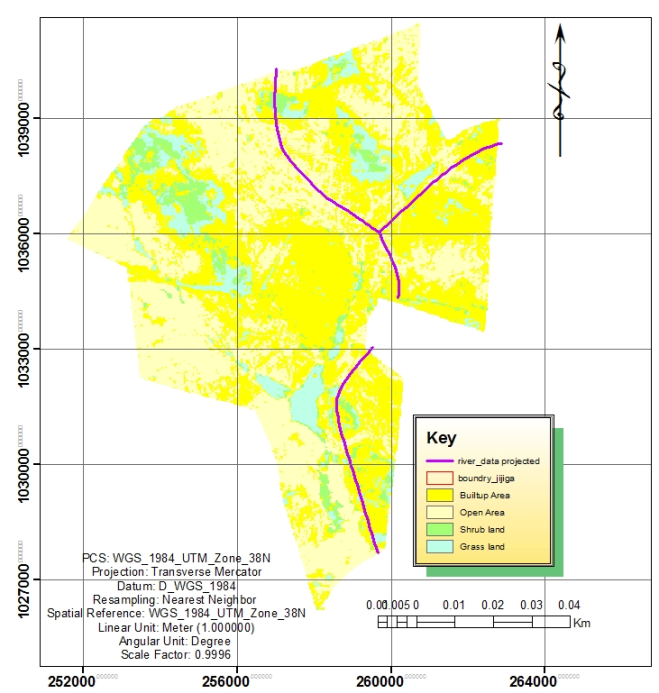 | Figure 4. Land use land cover of jigjiga town in 2015 |
 | Table 1. Land Use Land Cover Distribution Analysis (1985, 2000, and 2015) |
5. Change Analysis
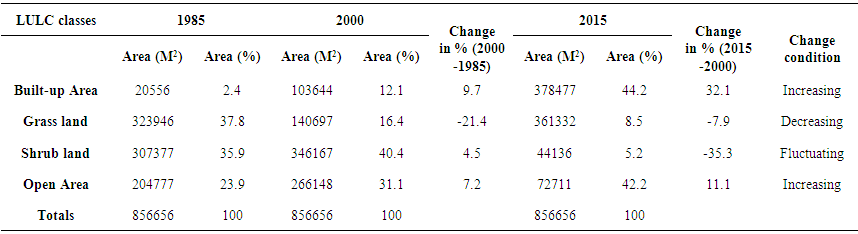
- Figure 5 portrays, the expansion of built up areas within 30 years. Therefore, large areas are occupied by built ups which were covered by other land classes in 1985. This land cover change analysis show that the rate at which land cover change occurred in all sub periods is different. The change for the sub periods (1985-2000 and 2000-2015) revealed that four important land cover changes were occurred. The results further revealed that, built-up and open area classes are increased continuously in all study periods. This means that, they are showing more increment in the second period (2015 - 2000) than the first (2000 - 1985). On the contrary, the grass land class is decreasing continuously in the study periods with more decreasing magnitude in the first period than the second. The shrub land class is showing fluctuations across the study periods i.e increasing in the first period (2000 - 1985) while decreasing in the second (2015 - 2000).
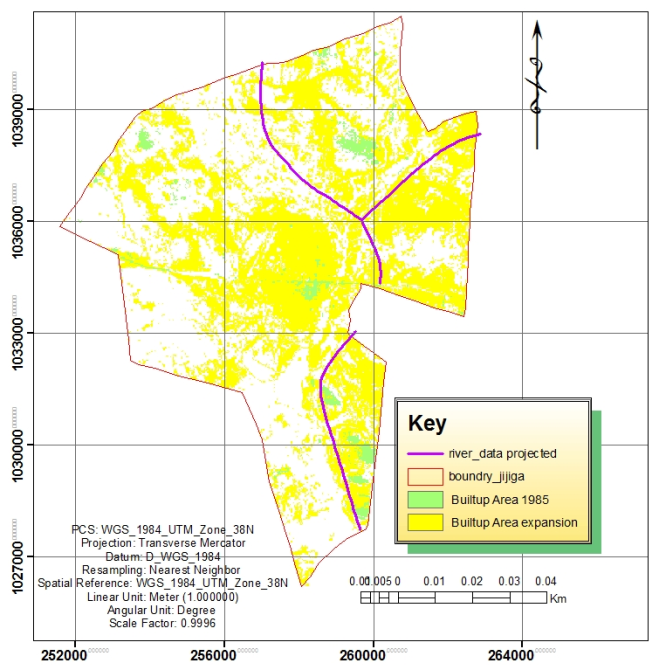 | Figure 5. Built-up expansion image differencing between 2015 and 1985 |
 | Table 2. Conditions of changes for the land classes over the study years (1985, 2000, and 2015) |
6. Conclusions
- As it is clearly seen from the classification results, the techniques and satellite imageries employed for the analysis were effective in extracting land cover classes for change detection. It is possible to behold that the developed Land use land cover schema was appropriate for the study area since there is no significantly unclassified area detected on the developed land use land cover map of the study. Beyond this the accuracy assessment result indicates as the result from the analysis is acceptable making the overall analysis a good indicator of the actual land cover classes in the area. From the overall analysis in general and change detection in particular, more land parcels undergo changes than remaining holding their previous attributes. It is observed that, there is a change in every plots of the study area in respect to its changing dynamics indicating as the area is under a continual and dynamic change and transition. The change in one land use class is done at the expense of others. This implies as there exists land cover classes like built-up areas under continual increment while others like grass lands suffer continuous reduction. Hence, land cover classes never be stagnantly changed over time. But if there is no any checking mechanism such as timely land use analysis, there is a probability of dominating one over the other (built-ups over vegetated parcels) especially in urban settlements. This is attributed to the factors of urban expansion such as population increment, encouraging urban policies and the people perception towards settling in urban areas.
ACKNOWLEDGMENTS
- First and for most our great pleasure goes to the JJU research, publication and technology transfer directorate office for being funding and giving required support for the success of this research. We would also like to express our sincere and whole gratitude to those individuals participated in the FGD and interview for their esteemed and genuine response they provide which plays a vital role for the output of this research. It would be a great burden for us to close our acknowledgement without showing gratitude for the other persons and organizations who directly or indirectly help us in providing data for the success of this paper.