-
Paper Information
- Previous Paper
- Paper Submission
-
Journal Information
- About This Journal
- Editorial Board
- Current Issue
- Archive
- Author Guidelines
- Contact Us
Resources and Environment
p-ISSN: 2163-2618 e-ISSN: 2163-2634
2016; 6(5): 104-107
doi:10.5923/j.re.20160605.03

Mean Annual Increment of Rubber Plants along Coal Transport Road in Regency of Tapin, South Kalimantan
 Abstract
 Reference
 Full-Text PDF
 Full-text HTML
Junaidi1, 2, Soemarno3, Arief Rachmansyah4, Yudi Firmanul Arifin5
1Doctoral Program of Environmental Science, University of Brawijaya, Malang, Indonesia
2Health Polytechnic, Banjarmasin, Indonesia
3Faculty of Agriculture, University of Brawijaya, Malang, Indonesia
4Faculty of Engineering, University of Brawijaya, Malang, Indonesia
5Faculty of Forestry, Lambung Mangkurat University, Banjarmasin, Indonesia
Correspondence to: Junaidi, Doctoral Program of Environmental Science, University of Brawijaya, Malang, Indonesia.
| Email: |  |
Copyright © 2016 Scientific & Academic Publishing. All Rights Reserved.
This work is licensed under the Creative Commons Attribution International License (CC BY).
http://creativecommons.org/licenses/by/4.0/

Dust pollution along the coal transport road is not only affecting the human’s health but it also the growth of plants around the roads, e.g. rubber plants in Tapin Regency. The aim of this study was to analyze the impact of dust from the coal transport road on the growth of rubber plants along the coal transport corridors. This study used the Mean Annual Increment (MAI) to assess the increment of the rubber plants annually, by measuring the diameter of the trunk. We also assess the condition of the rubber plant and the soil quality (soil fertility). The results showed the increment on the high dust-polluted zone was lower than on the low dust-polluted zone. Diameter increment of rubber plants in the zone with high dust pollution is 1.19-2.03 cm; while in the second zone with low dust pollution is 1.32-2.49 cm. We recommend buffer zone or planting trees about 100 m from each road side to decrease the effect of dust. Besides for the rubber plants, the buffer zone also protects the local dwellers from dust pollution.
Keywords: Coal transport corridors, Dust dispersion, MAI
Cite this paper: Junaidi, Soemarno, Arief Rachmansyah, Yudi Firmanul Arifin, Mean Annual Increment of Rubber Plants along Coal Transport Road in Regency of Tapin, South Kalimantan, Resources and Environment, Vol. 6 No. 5, 2016, pp. 104-107. doi: 10.5923/j.re.20160605.03.
Article Outline
1. Introduction
- Coal as one of energy sources exploited either from open pit mining or underground mining. The realization of national coal production in 2015 is 257.3 million tons, besides private companies, thus the total production as the target is 425 million tons [1]. South Kalimantan is the second largest producer of coal after East Kalimantan. Coal reserves in South Kalimantan are 10,659 Million tons [2]. The high coal production in this province has consequences such as land use changes for coal stockpile, ports, and increased transport for coal (dump truck, capacity of 20-100 tons).Since June 1st 2009, after Regional Regulation No. 3 of 2008 on the Public Road Use and Special Road for Transport of Mining and Plantation Companies is in effect, coal transportation was practically altered from using public roads to special roads. One of special roads that have increased volume of vehicles post the issue of the regulation is located in the area of Tapin Regency, which has 50 km in length. Currently, the road uses by about 25 coal mining companies. Traffic volume of the dump truck that passed the road is 4,000 to 5,000 units per day [3]. Environmental pollution that occurred due to the dust dispersion mostly caused respiratory disease of local dwellers. Impact of the dust pollution along the coal transport road is not only affecting the human’s health, but also the growth of plants around the roads. It is especially affect the annual trees because the plants are continuously affected by the dust dispersion. Annual plants that studied in this research are rubber plants (Hevea brasiliensis). The road for coal transport is crossing trough the rubber plantation for 10 km in length, which include in Tapin Regency. Along that 10 km long road, the rubber plants is immediately adjacent to the road, thus the dust is directly dispersed on the rubber plants. The dust covered the surface of the leaves and affects the growth of the plants. Therefore, this study was aimed to analyse the impact of dust from the coal transport road towards the growth of rubber plants along the coal transport corridors.
2. Methods
2.1. Study Site
- Tapin Regency is geographically located at 2°32’43” - 3°00’43” N and 114°46’13” -. 115°30’33” S. Tapin has numerous coal reserves. Coal production of Tapin Regency is 8.1% of the provincial coal production in 2015, i.e. 12,088,524 million tons. Coal production started to increase since 2007, which twice as much as previous year 2006 and the highest production in 2013, i.e. 15,471,377 million tons.The total length of the special road for coal transport is 56 km which connect the port and the mine location. To use the road, coal mining companies paid for the road fee. The volume of the coal transport traffic in this road is evenly in each hour, for 24 hours. Especially for the dump truck with capacity > 20 tons at the first point for 3.338 units; means 139 units of dump truck per hours passed the road. On the second point, 1.982 units of dump truck passed or 86 units per hour.The study was not conducted all along the road, but only on some segment of the road purposively, based on the location of the rubber plantation that crossed trough by the road. Rubber plants were located 100-300 m from the both road sides about 13.2 km long with approximate 26.4 ha area. Annual rainfall in Tapin Regency for the last 10 years is > 1,400 mm per year. The lowest rainfall was 1,319.2 mm in 2014 and the highest rainfall was 3,536.9 mm in 2010. The Rainy season started from October to May or June, while Dry season along July, August, and September. Average annual temperature ranged 26.3–28.2°C, with the lowest temperature in February and the highest temperature in May and August [4]. The topography of the study area is relatively flat and opened (no hill or valley). Low temperature gradient caused low air pressure, thus wind flow is also low. The area is also relatively far from the coast, thus the effect of sea wind is less.
2.2. Data Collection
- We collected primary data for the growth of rubber plants by direct observation and measurement on the tress diameter, Mean Annual Increment (MAI), the condition of the rubber plants, and soil fertility.
2.2.1. Diameter of the Rubber Tree
- The diameter of the trunk obtained by measure the circumference at the height of 1.3 m above ground. The diameter calculated from the circumferences. Samples of rubber trees were grouped into two zones based on the dust dispersion. The first zone has dust concentration above the standard threshold and second zone with dust concentration below the standard threshold. Two quadratic sample plots were taken in each zone with size 20 x 20 m [5] as illustrated in Figure 1.
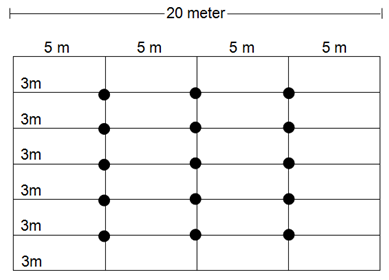 | Figure 1. Sample plot for the rubber plants |
2.2.2. Mean Annual Increment (MAI)
- MAI is the average increment of tree’s dimension of each year. MAI obtained by dividing the reached dimension to needed times. Data were analyzed statistically with independent T test to determine the difference between two zones of dust concentration.
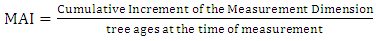 | (1) |
2.2.3. Condition of the Rubber Tree
- Life quality was directly observed the leaves condition, includes leaves’ density and colour helped by expert. Leaves’ colour divided into dark green or yellowish green. Data of life quality was used to supports the discussion on the increment of rubber plants.
2.2.4. Soil Fertility
- The analysis of soil quality was conducted to determine the soil fertility on both zones of rubber plants. Sample of soil was taken by using soil drill with diameter 5 cm on the depth of 20-30 cm. the sampling point for the soil is in the middle of the sampling plot for rubber plants. Soil sample from the same zone were homogenized. Soil was analyzed in the laboratory to assess the soil fertility. Parameter for the fertility was limited to chemical parameter, i.e. C-organic, N-total, P-total, K-total, pH, exchangeable Ca, Mg, Na, K, CEC and base saturation.
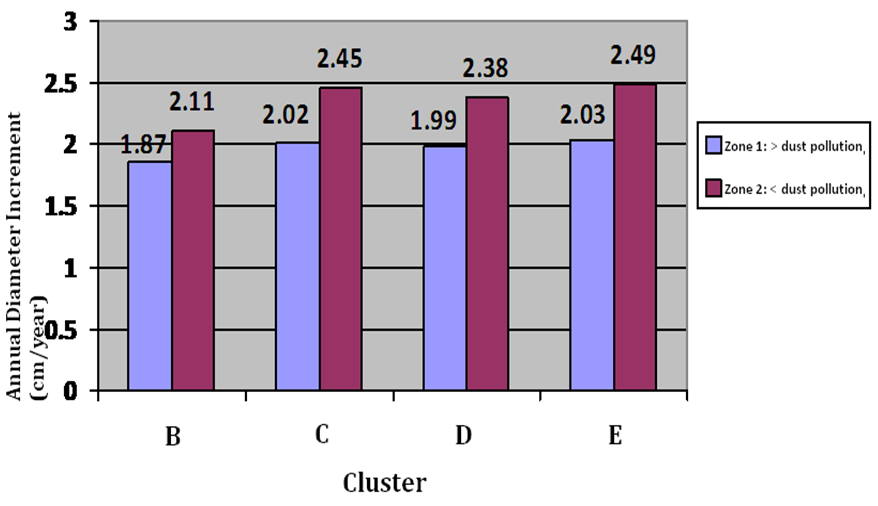 | Figure 2. Mean Annual Increment of the Rubber Plants (Diameter) |
3. Results and Discussion
3.1. Increment of the Rubber Plants
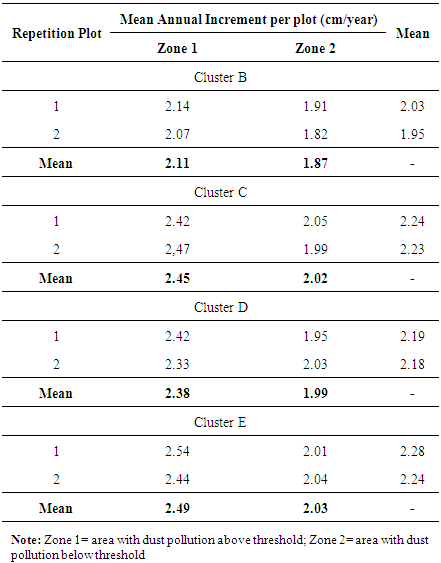
- The measurement on the trunk of rubber tree was grouped into four clusters, based on the ages. Cluster A with 25 years rubber plants was not included in this study because it is already existed before the coal transport road was established (16 years ago). Cluster B for 7 years old rubber tree, Cluster C for 6 years old, Cluster D for 5 years old and Cluster E for 4 years old. Each cluster divided into two zones, i.e. rubber plants in 100 m range from the road side (with dust pollution above the threshold) and rubber plants after 100 m range from road side (with dust pollution below the dust pollution threshold) as comparison. The results of diameter increment of the rubber plants showed in Table 1.
|
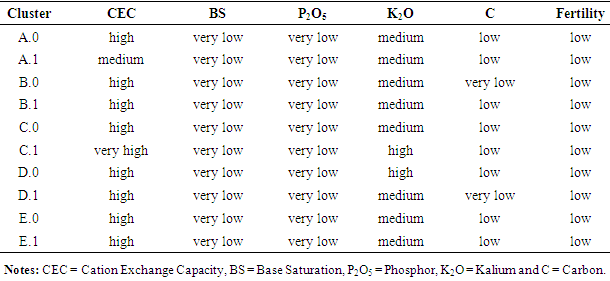
3.2. Soil Fertility
- The laboratory analysis results showed a similar level of fertility in all cluster area of the rubber plants (Table 2). Thus, edaphic factors which represent by the chemical characteristic of the soil were not making any differences on the rubber plants. Dust accumulation enables gradual changes to the nutrient content, base saturation, cation exchange capacity and soil pH [7]. For the soil pH, zone with more dust pollution is lower (Cluster A, B, and C) than the zone with low dust pollution.
|
3.3. Condition of Rubber Plants
- Dust exposure on the rubber plants caused the dust accumulation on the surface of the leaves, trunk and branch, soil surface, and plants root. Dust accumulation on the leaves surface changes the leaves colour into greyish. The dust covered the leaves surface affect the photosynthesis process which is crucial for the growth of plants. Besides photosynthesis, respiration of the plants also affected. The photosynthesis and respiration process was disturbed mostly because the stomata were covered by the dust. Although the dust coverage on the leaves could be decreased by the wind and rain, the dust dispersion happens 24 hours. Thus in years, accumulation of dust particulate cannot be avoided (Fig. 3).
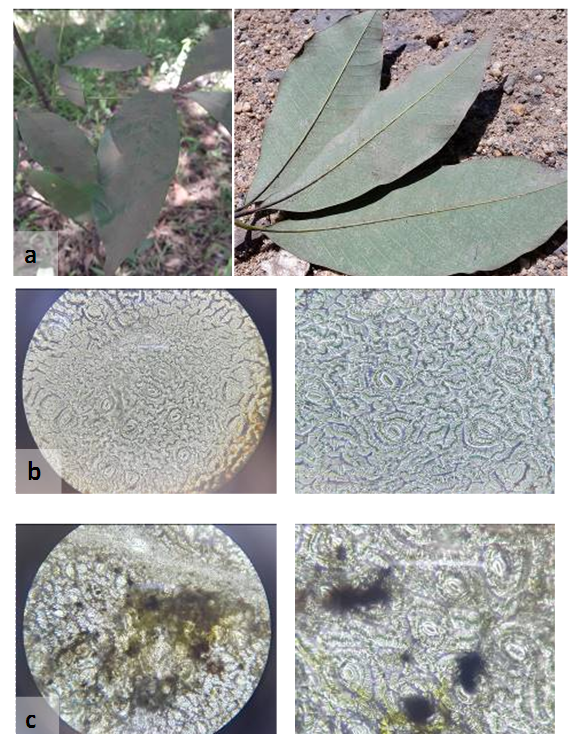 | Figure 3. Dust Accumulation on the Leaves of the Rubber Plants. (a) dust accumulation on the leaves surfaces, (b) leaves without dust accumulation, (c) leaves with dust accumulation (Magnification 40 x) |
4. Recommendations
- We recommend buffer zone or planting trees on the road side. Vegetation assumed to hold up the dust dispersion effectively. Road side trees barrier the dust distribution and localizes the dust to the lower part of the plants. The more dense and thick the tree formations have, the more dispersion of dust that can be inhibited and reduced. We recommend plants with hairy leaves and rough surfaces, such as Cananga adorata, Tamirindus indica, Baubinia monandra and Mussaenda erythrophylla [8].
5. Conclusions
- The dust from coal transportation affects several aspects along the road. The dust pollution analysed with certain method to assess the level of dust pollution and strategy to overcome the problems that occurred due to the pollution. Diameter increment of rubber plants in the zone with dust pollution above standard threshold ranged 1.19-2.03 cm, while in the second zone with dust below the threshold is 1.32-2.49 cm. It shows that the increment on the high dust-polluted zone was lower than on the low dust-polluted zone. Thus, it confirm that the dust dispersion from the coal transport road affect the rubber plants growth. We recommend to established buffer zone or planting trees about 100 m from each road side to decrease the effect of dust dispersion to the rubber plants growth. Besides for the rubber plants, the buffer zone also protects the local dwellers from dust pollution on their health.