Siswo Hadi Sumantri, Sukoso, Imam Hanafi, Ratno Bagus Edi Wibowo
Graduate Program of Environmental Science, University of Brawijaya, Malang, Indonesia
Correspondence to: Siswo Hadi Sumantri, Graduate Program of Environmental Science, University of Brawijaya, Malang, Indonesia.
| Email: |  |
Copyright © 2016 Scientific & Academic Publishing. All Rights Reserved.
This work is licensed under the Creative Commons Attribution International License (CC BY).
http://creativecommons.org/licenses/by/4.0/

Abstract
Surabaya as one of the cities with a high population growth needs to consider the availability of raw drinking water for the next decade, as it is possible that the excessive raw drinking water can no longer meet the drinking water needs of Surabaya. The decline in comparison of needs and availability of drinking water is not only due to the growth in consumption, but also due to the level of waste generated by the public and industry that could reduce the quality and quantity of drinking water. The research uses simulation of system dynamics to see the trend of raw water availability in Surabaya up to the next thirty years. The simulation results indicate that the availability of raw drinking water will be below needs in around 2036. From the resulting trend, interventions are carried out in the form of environmental policy for industrial waste and improving the quality of education for the public living near the watersheds. The interventions reveal that the availability of raw water Surabaya is still able to meet the demand for drinking water until 2040.
Keywords:
Availability of raw water, the system dynamics
Cite this paper: Siswo Hadi Sumantri, Sukoso, Imam Hanafi, Ratno Bagus Edi Wibowo, Maintaining Availability of Raw Drinking Water in Surabaya under the System Dynamics Approach, Resources and Environment, Vol. 6 No. 5, 2016, pp. 95-103. doi: 10.5923/j.re.20160605.02.
1. Introduction
Surabaya is the second most populous city in Indonesia. Its population is now more than 2.7 million with the growth rate of 4.44% (BPS, 2010), and it would require higher and better provision of facilities and infrastructure. One of the critical needs of this growing population is the need for clean water. Clean water in Surabaya is consumed by the people as well as by industries. The rapidly growing population of Surabaya influences on the development of the industries, including the needs of primary and secondary industries. On the other hand, industrial growth also affects the level of urbanization, leading to such fast population growth of Surabaya, not to mention most of the urban community that brings their families along. The causal relationship creates an increased need for clean water that is no longer linear.On the other hand, clean water sources in Surabaya are largely drawn from Surabaya River (95%) having a relatively constant discharge. In the rainy season, the discharge rate in Surabaya River is 40m3/sec, while during the dry season the discharge rate decreases to 20m3/sec. At this time, the number is still very sufficient to meet water needs of Surabaya, but not safe for twenty to thirty years ahead.Another problem arising from the growth of the population and the industry is the amount of waste generated. The more the number of people who live in the watersheds, the more the waste pollution in Surabaya River both in quantity and in quality will be. The growing number of industry as well will increase the amount of waste both in quantity and in quality. Data from PDAM1 Surabaya show that the increase of industrial waste is very influential toward the ability of PDAM Surabaya to manage the river water, especially in the dry season. Discharge of water that can be processed during the dry season is even half of normal.The population growth and industry in Surabaya will affect the growth of waste that affects the quality and quantity of Surabaya River as a source for drinking water, and ultimately the decline in the availability of raw water that is ready to be processed. From some of the afore-mentioned problems, the researchers attempt to develop policies to reduce the amount of waste that goes to Surabaya River. The purposes of this study are to determine the factors that affect the availability of raw water in Surabaya; and recommend the policy that is effective to intervene the reduced availability of raw water in Surabaya.
2. Research Method
The availability of clean water is basically influenced by various factors that make up a system. The rapid growth of population and industry is interlinked, which also affects the amount of waste that could reduce the availability of water in Surabaya, both in quality and quantity. In this case, intervention is needed in the form of a policy to prevent or minimize the reducing availability of raw water.To determine the effectiveness of the policy, we can previously perform a simulation. As factors are interrelated within the clean water supply system, then the system itself looks complex.One approach often done to simulate a complex system is dynamic systems. Conceptually, feedback is at the core of the system dynamics approach. Loop diagram of information feedback and circular causality is a tool to conceptualize the structure of complex systems and to communicate the knowledge-based model. Intuitively, feedback occurs when the information generated from some action moves through the system and ends up back in some form to the point of origin, potentially affecting future actions (www.systemdynamic.org). Feedback in this case means that the X situation affects Y and Y otherwise affects X, which may occur through a causal chain (Arvitrida, 2008).The simulation of system dynamics is expected to know the level of water consumption needs of Surabaya and the waste level that could affect the availability of water in twenty to thirty years ahead.Stages of system dynamics modeling is as follows (Budiman, 2008):1. Identify and define the problem. The first step is to determine the issues to be studied in order to clearly define and focus on the problems faced.2. Make the system conceptualization. The second phase is to structure problems in a conceptual model, which is a diagram of feedback that describes the relationship between the elements contained in the system.3. Formulate the model. This phase will produce a flow chart with equation so that it becomes the form of quantitative feedback from the loop diagram created earlier.4. Verify the model. This is done by verifying the model structure through expert review and verification software with check unit and check model.5. Analyze model behavior. This stage produces a description of the patterns of behavior that occurs on each element or variable after the model is simulated.6. Test the model. This stage aims to test the validation of the model to see whether the model has been representing the real system or not. Test is done by comparing the historical data and simulation data.7. Analyze the intervention and the implementation of the model. This phase results in some scenarios as a form of intervention toward the model so the behavior of elements in it is in accordance with the purpose.8. Data collection. Data collection method in this study consisted of the collection of secondary data and primary data. Secondary data is obtained by reviewing the literature and collecting data from various agencies, while the primary data collection method is done through interviews with experts.
3. Analysis and Discussion
From the literature study, some of the variables that influence the availability of raw water system in Surabaya are found. Variables are then compiled into a concept model in the form of a causal diagram as seen in Figure 1.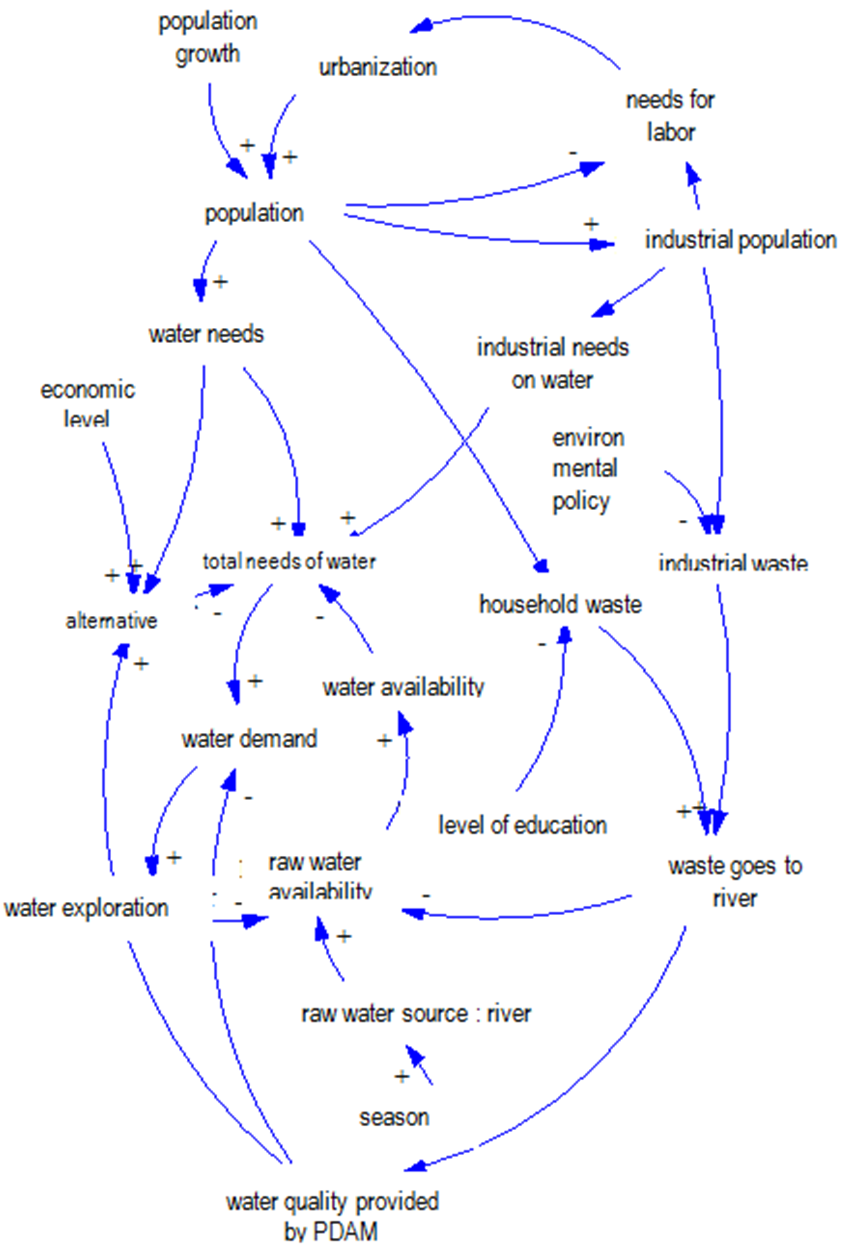 | Figure 1. Causal diagram of raw water availability in Surabaya |
Conceptualization of SystemThe causal loop diagram is broadly divided into two sub-models, namely population and industrial growth and raw water availability.Based on the model, population growth, in addition to be affected by natural growth or birth, can also be influenced by the level of urbanization to Surabaya. Population growth affects the growth of industry and the growth of waste that pollute the river water. On the other hand, industrial growth increases the demand for labor, and the need of labor also leads to increased urbanization, which in turn also affects population growth, and so on. Industry is also a contributor to the waste that pollutes rivers where waste is increasing with the growth of the industries.Related to the problem of waste, previous studies confirm that levels of public education, especially community along the watershed, can affect the level of pollution generated. In term of industry, industrial pollution can be minimized with better policies.Two things influence the amount of raw water availability: the seasons and waste. The rainy season increases the flow of water, while the waste in the river reduces the flow of clean water that can be used. The raw water is then processed by PDAM into clean water piped into households and industries.The causal diagram above shows three variables that influence on the availability of raw water in Surabaya, namely:1. Population2. The number of industries3. The amount of waste in the riverIn this case, the easiest variable to be controlled is the amount of waste produced.Formulating the ModelThe formulation of the model is a step to change conceptual model in the form of causal loop diagram into a model that can be executed by a computer that is analogized into a structure of the stock and flow, better known as stock flow diagram.Assumptions used include:1. Every 12 immigrants, one brings his family;2. Population growth is only affected by natural growth and urbanization rate;3. The work force is 40 percent of the population;4. The need of the industry is in analogy with three thousand liters of water needs;5. Fraction of industrial waste is 100m3/industry; and6. Faction community wastewater is 1m3/person.From the data obtained, and assumptions mentioned above, stock and flow diagram formulated is shown in Figure 2.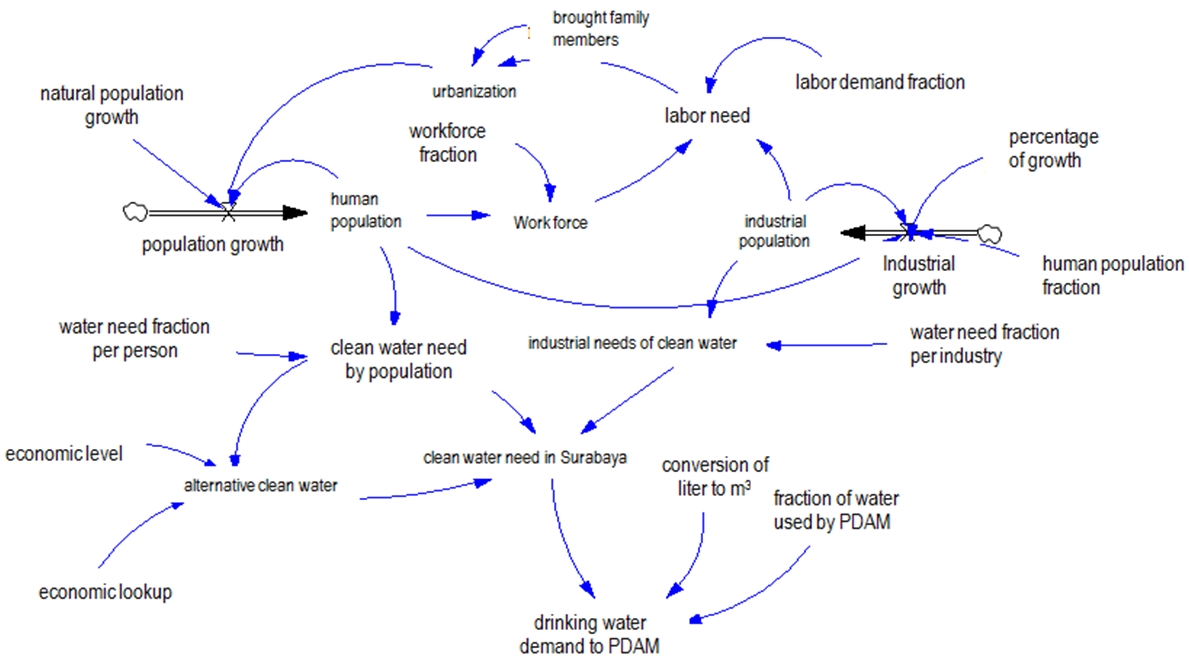 | Figure 2. Stock flow diagram as the sub-model of population and industry |
In Figure 2, the number of population is the sum of the natural growth rate (data from birth and death rate) with the speed of urbanization. The population increase was formulated as follow:Population = (present population*percentage of natural population growth) + UrbanizationThe population triggers industrial growth by one percent per year, and the population of the industry will trigger industrial growth. This picture illustrates that many industry could trigger a new business such as maintenance services, delivery services, and so forth. In this simulation, industrial growth rate is 1% of the population. Industrial increase formulated as follow:Industrial increase = (industrial population*percentage of increase) + (population growth*fraction population growth)The industrial growth leads to the need of labor. Forty percent of the population is a labor rce that is ready to meet the needs of workers, the rest of labor needs is met by urbanization. Needs of Labor = IF THEN ELSE (labor force > (fraction of labor needs*industrial population), 0, ((fraction of labor needs*industrial population)-work force))These urbanized labor candidates move to Surabaya, and some of them bring their families.Figure 2 gives mutually reinforcing growth pattern between population growth and industrial growth, and this interdependence has resulted in no longer linear growth. The growth of population and industry triggered the growth of drinking water need in Surabaya. Drinking water need was formulated as follow:Clean water need in = clean water for industry + clean water for population – alternative clean water Figure 3 showed that the population (assumed to be 5%) in the watershed accounts for household waste thrown into the river. Waste is divided into two, in quantity and in quality. Quantitatively, each person is considered to contribute 1m3/month of waste, and the quality of waste depends on the quality of the education of the community living along the watershed.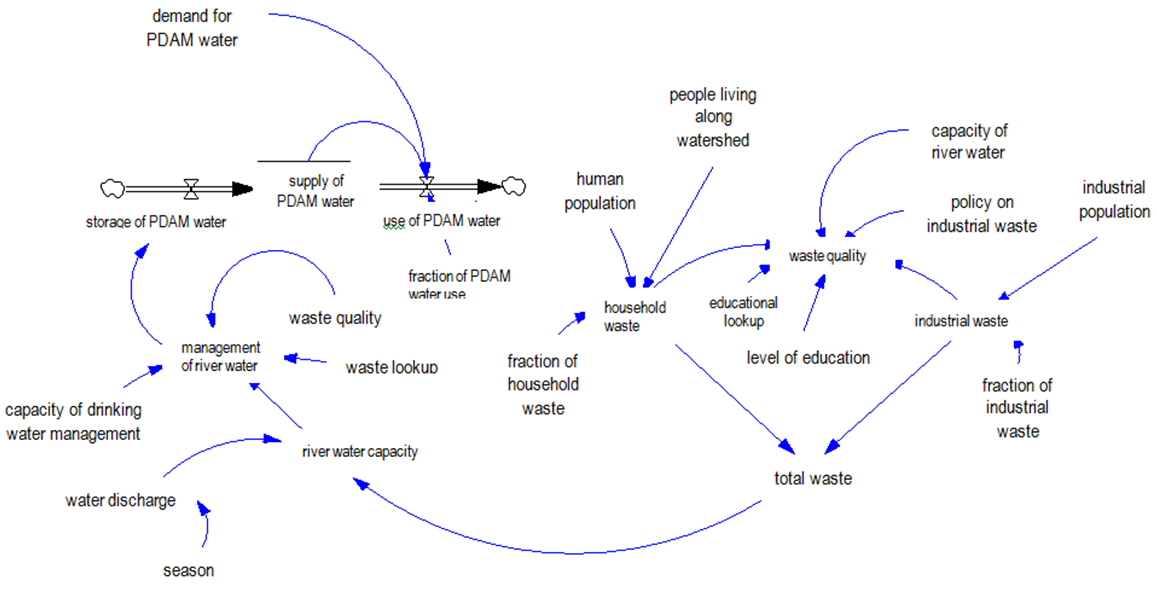 | Figure 3. Stock flow diagram as the sub-model sub model of raw water availability |
The same pattern is for the industry where waste generated is divided in quantity and in quality. The quantity of waste is 100m3/month. In quality, industrial waste is scaled 1-10 with a value of 10 for the most hazardous waste. The quantity of total waste is calculated as a percentage of river pollution on river discharge, and the quantity of waste affects the river water discharge. River water management in addition affects river flows and incoming waste is also limited by the ability to manage raw water in Surabaya River by PDAM. In the simulation, waste quality and quantity was formulated as follow: Waste Quality = ((educational lookup (level of education) * household waste) + (industrial waste * (policy on industrial waste/10))) / (industrial waste + household waste + river water capacity)Total waste = household waste + industrial wasteWhile the PDAM ability to manage the river water is affected by the quality and quantity of the waste as formulated as follow: Management of river water = (MIN (capacity of river water, capacity of drinking water management))*waste lookup (waste quality)In terms of drinking water, consumption rate is influenced by the water needs of households and industry. Consumption of water for cooking and drinking depends on water quality and economic level; some people have switched to water refill (water alternatives). Formula for the use of alternative drinking water is: Alternative clean water = population need of clean water * (economic lookup (economic level))Public consumption provided by PDAM is currently around 64% (Setiawan, 2003) consumption needs of the entire community.Verification of the ModelVerification of the model is done after the model is made, then model is confirmed to with relevant experts.Once verified by experts, later the model is validated using vensim simulation software (Ventana, 1999). If the check result shows the model is OK, then there is no problem with the structure and formulas and the simulation can be run. Check unit is declared valid if the window unit shows OK, which means that the dimensions of the unit at each formula run well. The results of verification of the model can be seen in Figure 4. Once the verification is done and matches, then the model is ready to run the simulation.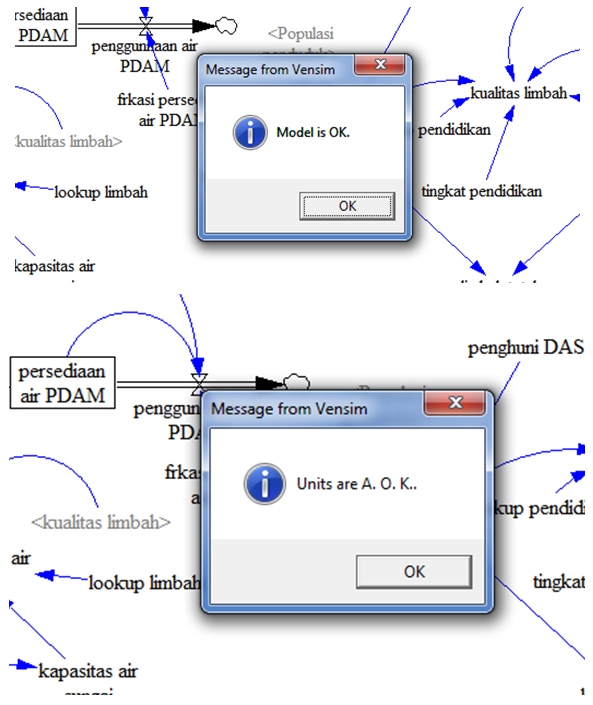 | Figure 4. Verification of the Structure and Dimension of the Model |
Analysis on Model Behavior In this process, the model is run under conditions without any intervention at all its variables. The model is run for thirty years and data storage is done once a month.From Figure 5, Surabaya population will increase to eight (8) million in 2046. The growth becomes non-linear as industry growth results in the need of workforce which is more than the number of working-age population in Surabaya. This disparity becomes the cause of urbanization so that the population growth is not only influenced by natural growth alone.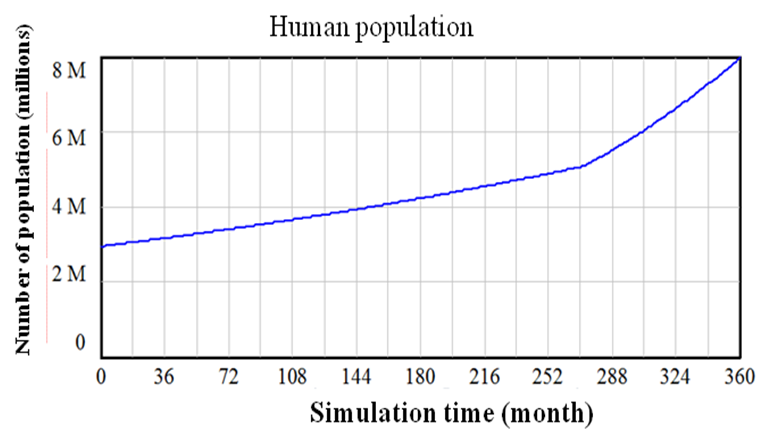 | Figure 5. Pattern of Population Growth over Time until 2046 (month of 360) |
The growth of the industry is shown in Figure 6. The population of the industry rises to more than 160 thousands. Industrial growth is not linear because population and number of industry influence its growth. Industrial and population growth reinforce each other in accordance with the previous hypothesis.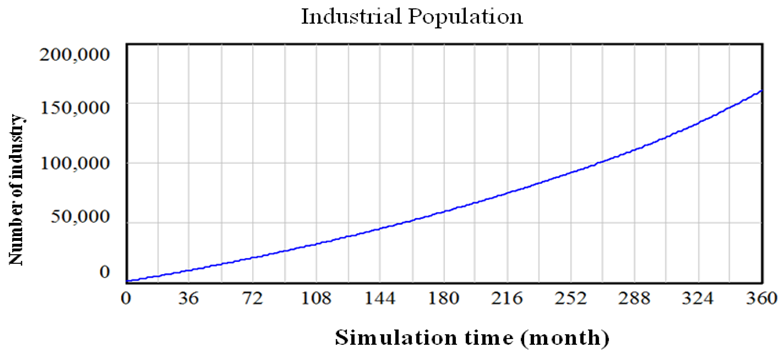 | Figure 6. Pattern of Industrial Growth until 2046 |
Figure 7 shows the water consumption needs of Kota Surabaya in the next thirty years. Of the chart pattern, PDAM water demand will reach 17 million m3/month in 2036 and reaches 28.18 million m3/month in 2046. The amount of PDAMS water demand increases with the increase of population and industry.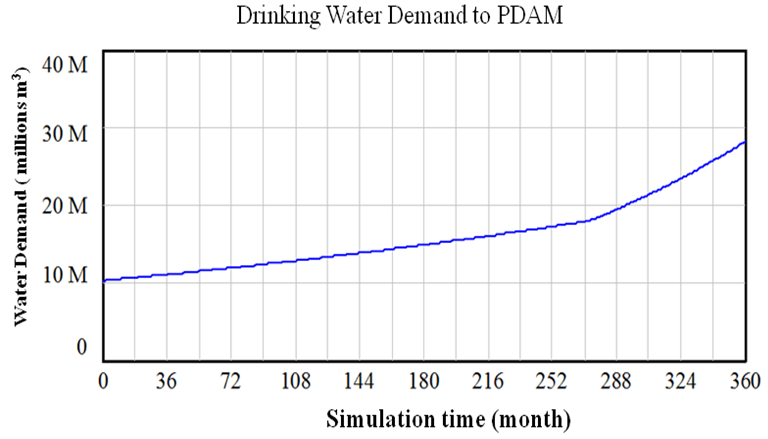 | Figure 7. Pattern of PDAM Water Demand until 2046 |
The growth of PDAM water demand resulting from population and industrial growth can be lowered by pressing industrial growth through the deployment of industrial areas around Surabaya such as Sidoarjo, Gresik, Lamongan, and Mojokerto. However, it is rather difficult for industry related services directly to the public.Capability on the management of raw water by PDAM relies on its capacity in water management and the amount of raw water available. Figure 8 shows a graph of water availability by PDAM.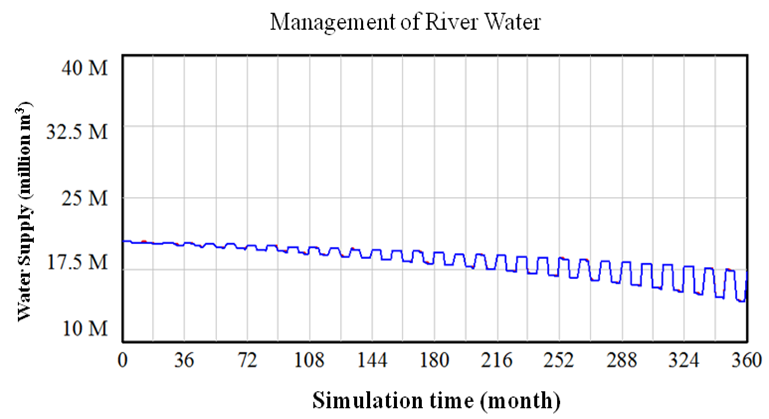 | Figure 8. Pattern of PDAM Water Availability until 2046 |
Figure 8 shows decrease for availability in which the average in 2036 is equal to the demand of clean water and is equal to the average water consumption. However, in the dry season, a deficit of water demand happens due to low amount of raw water that is about 16 million m3/month. The ability to provide water during the rainy season and the dry season goes on with even higher difference. The significant difference is due to high waste amount in Surabaya River in the dry season under low water discharge, and the low waste amount in the rainy season under high water discharge. Thus, the raw water processed by PDAM in the dry season is much less than the raw water in the rainy season.At the beginning of the simulation, even though the water flow in the rainy season is doubled of the dry season, water needs can still be met as the need of water consumption and pollution level are still below the amount of raw water. However, near the end of the simulation, water demand is increasing and is followed by the amount of waste.Figure 9 shows the total waste reaches 10m3/month in 2036, and thus reduces by half the water supply of the river during the dry season.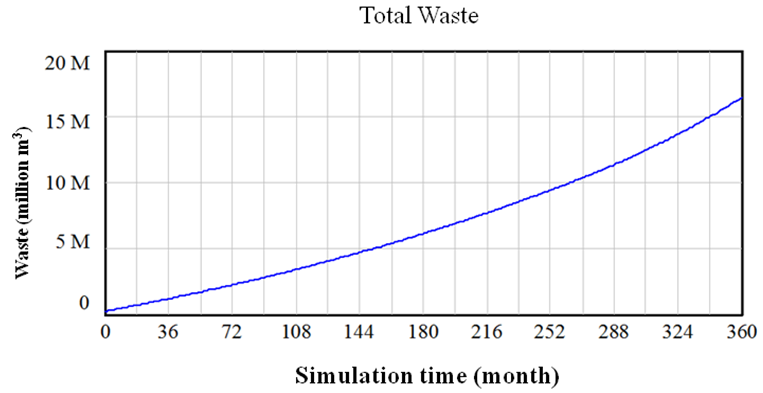 | Figure 9. Growth Patterns of Waste Generated by Industry and Households |
From the simulation results above, one of the variables that we can always change to maintain the availability of water is waste pollution, with the hope that the amount of raw water is enough to meet the needs of water in Surabaya.Scenario to Reduce River PollutionTo ensure the availability of water for longer time, reducing the incoming waste into the river must be done in the model of the waste generated by households and industry. Based on literature review, it is known that treatment on waste by those living along the watershed depends on the level of education, while for industrial waste it depends on the government firmness in industrial waste treatment policies.The amount of waste is intervened by increasing public education and policies on industrial waste treatment before being discharged into the river.The first scenario is to increase the level of public education around the river. In the simulation, the results show that raising the level of education scaled 1-6 does not have a significant impact (see Figure 10). The education level of the community is a good influence on the decrease for waste generated as they produce only 2.5% of the waste. Thus, change in the quality and quantity of public waste has no significant effect on the total waste. Figure 11 is the scenario for environmental policy applied to industry.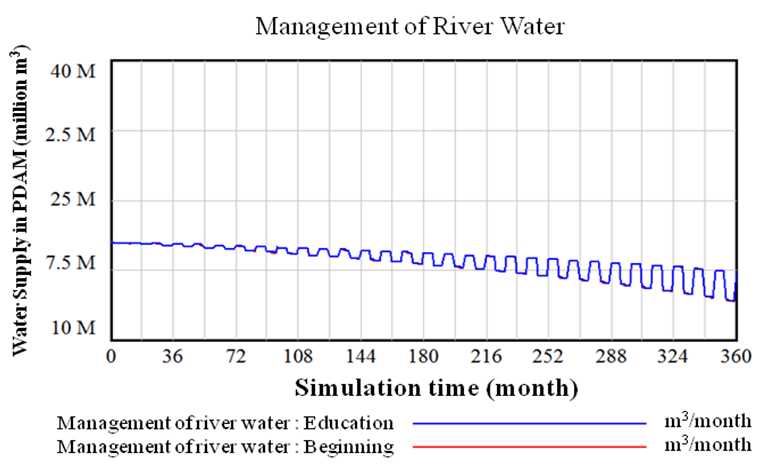 | Figure 10. Scenario 1 The Effect of Improving Education on Community Living along the Watershed toward Raw Water Availability |
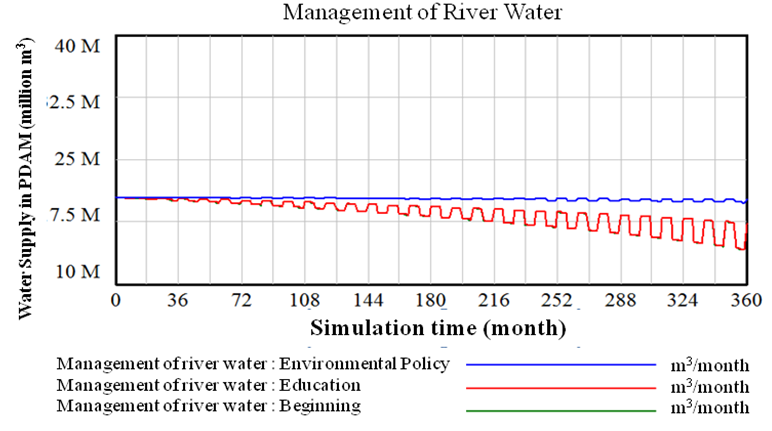 | Figure 11. Scenario on the Effect of Environmental Policy Applied to Industry toward Raw Water Availability |
In the second scenario, the intervention is reducing industrial waste with environmental policies for the industry. An environmental policy is capable of reducing the level of industrial pollution simulated in this study by lowering the pollution level of each industry up to 1/10 of the initial conditions, then a visible increase in availability of water presents. The result of the second scenario is displayed in Figure 11 where the availability of water could be maintained in the position of 19.3 million m3/month in 2046.From the simulation results, it can be seen that until the end of 2046 availability of water is still relatively constant in 20 million m3/month. The consumption of drinking water can be fulfilled until 2042.The two scenarios succeed in reducing waste levels. However, the ratio of household waste is much smaller than industrial waste, which is in the range of 2.5% of the total waste, a decrease in the amount of household waste has no significant effect when compared to a decrease in industrial waste.
4. Conclusions
The following conclusions can now be drawn:1. Factors that influence the availability of raw water system in Surabaya is the season, the water discharge, the waste in the river, the total population, the number of industry, the level of urbanization, the availability of alternative water, and the economic levels of society.2. The scenario most effective in minimizing reduced number of water availability is environmental policy for industrial waste, where industry must reduce its waste levels until only 10% so that the amount of raw water can be maintained until 2046, or 30 years from now and it is able to meet consumption until 2041.
5. Recommendations and Suggestions
In this study, there are still many things that need to be considered as an influential factor in the upstream along the River prior reaching Surabaya, groundwater that could be an alternative source of raw water, as well as the provision of dams to minimize the gap of water availability in the rainy season and dry season.Additionally, several variables in the form of assumptions can cause deviations to the results expected. Some simulation data may be replaced with real data so that the results obtained can be more accurate.This study has not done any intervention at the level of population and industrial growth. Simulation can be done by moving some industry outside Surabaya and controlling the population growth rate. These all are done to see how significant the process of controlling the demand of PDAM water in Surabaya.Several researches to be done based in this study are: 1. Modeling on the quality of clean water before entering Surabaya2. Modeling on the life pattern in the watershed area towards the river water quality3. The effect of industrial population policy and population towards the water supply in Surabaya4. The effect of waste quality towards the drinking water supply in Surabaya
Note
1. Local Water Company normally run by the local government.
References
| [1] | Arvitrida, Niniet Indah (2008), 'Simulasi koordinasi supply chain pisang: Studi kasus pisang mas dari Lumajang', Simulation (Sepuluh Nopember Institute of Technology). |
| [2] | BPS (2010), “Sensus penduduk 2010”, (http://www.bps.go.id). |
| [3] | Budiman, Uli Nurmalasari (2008), “Pemodelan Dinamika Ketersediaan Air Bersih Perpipaan Di Kota Cimahi Dengan Skenario Intervensi Pada Sisi Penyediaan Dan Sisi Permintaan” (Bandung Institute of Technology). |
| [4] | Kementrian PU (2010), “Kajian Keterpaduan Pengembangan Air Baku, Air Bersih Dan Sanitasi” Ministry of Public Work, Jakarta. |
| [5] | Setiawan, M. Ikhsan (2003) “Study Pemenuhan Kebutuhan Air Bersih PDAM Kota Surabaya Tahun Proyeksi (2015)” Neutron VOl. 3 No. 1. |
| [6] | Ventana system, (1999), “Vensim PLE Plus personal learning edition” http://www.vensim.com. |
| [7] | www.systemdynamic.org'system dynamic society', (http://www.systemdynamics.org/what_is_system_dynamics.html). |

 Abstract
 Reference
 Full-Text PDF
 Full-text HTML