-
Paper Information
- Paper Submission
-
Journal Information
- About This Journal
- Editorial Board
- Current Issue
- Archive
- Author Guidelines
- Contact Us
Resources and Environment
p-ISSN: 2163-2618 e-ISSN: 2163-2634
2016; 6(4): 80-87
doi:10.5923/j.re.20160604.03

Assessment of Soaked California Bearing Ratio Value Using Geotechnical Properties of Soils
 Abstract
 Reference
 Full-Text PDF
 Full-text HTML
Surendra Roy
Department of Civil Engineering, PSIT College of Engineering, Kanpur, Uttar Pradesh, India
Correspondence to: Surendra Roy, Department of Civil Engineering, PSIT College of Engineering, Kanpur, Uttar Pradesh, India.
| Email: |  |
Copyright © 2016 Scientific & Academic Publishing. All Rights Reserved.
This work is licensed under the Creative Commons Attribution International License (CC BY).
http://creativecommons.org/licenses/by/4.0/

California Bearing Ratio value is used for the evaluation of subgrade strengths during design of flexible pavements. To simulate worst moisture condition of the field, soaked California Bearing Ratio value is used in the design of pavements. But this test is an expansive and time consuming method. In this study, a detailed survey was carried out within a 5 km radius of Sirsa and 10 locations were identified for soil sampling. The soil samples were collected at 50 cm depth from ground surface and analysed for different geotechnical properties like specific gravity, particle size, liquid limit, plastic limit, plasticity index, maximum dry density, optimum moisture content and soaked California Bearing Ratio. With the help of particle size distribution curves, coefficient of uniformity and coefficient of curvature were evaluated to find out the gradation of particles. Influence of the geotechnical properties on soaked California Bearing Ratio was studied. Stepwise regression procedure was carried out for the selection of most influencing variables. Incorporating selected variables, multiple regression model was developed for the prediction of soaked California Bearing Ratio. The performance of the multiple regression model was assessed in terms of correlation coefficient, F-statistics and residuals pattern. Using the developed model, soaked California Bearing Ratio can be computed for the study area.
Keywords: California Bearing Ratio, Correlation, Significant, Multiple Regression Analysis, Geotechnical Properties
Cite this paper: Surendra Roy, Assessment of Soaked California Bearing Ratio Value Using Geotechnical Properties of Soils, Resources and Environment, Vol. 6 No. 4, 2016, pp. 80-87. doi: 10.5923/j.re.20160604.03.
Article Outline
1. Introduction
- Of all the methods of pavement design, the California bearing ratio (CBR) method has been found as the most reliable means for evaluating the strength of the subgrade (bearing capacity of the soil) and construction materials, and hence estimating the required thickness of pavement [1]. It is a penetration test meant for the evaluation of subgrade strength for roads and pavements. The results obtained by these tests are used with the empirical curves or charts to determine the thickness of pavement and of its component layers. This is the most widely used method for the design of flexible pavement [2]. The relevant tests for subgrade soil include moisture content determination, liquid and plastic limits, specific gravity and particle size analysis. Although provision of subsoil drains could likely reduce the effect of water on subgrade, fully soaked CBR is considered to be appropriate for pavement design purposes [3]. According to Patel and Desai [4], the CBR is affected by the type of soil and different soil properties. Its prediction using index properties of soils can be the alternate method for the time consuming test like CBR. As per Carter and Bentley [5], soil type, density, moisture content and method of sample preparation play an important role in affecting CBR. Talukdar [6] explained that CBR depends on many factors like maximum dry density, optimum moisture content, liquid limit, plastic limit, plasticity index, type of soil, permeability of soil etc. Yildirm and Gunaydin [7] used statistical techniques for the evaluation of CBR from sieve analysis, Atterberg limits, maximum dry unit weight and optimum moisture content of soils. To simulate worst moisture condition of the field, the specimens are tested in soaked conditions, for this, these are kept submerged in water for about 4 days before testing [8]. According to different researchers [9, 10], CBR test in laboratory requires a large soil sample and is laborious, expensive and time consuming. Furthermore, the results sometimes are not accurate due to poor quality of skill of the technicians testing the soil samples in the laboratory. All these problems may result in serious delay in the progress of the project and ultimately it may lead to escalation of the project cost. To overcome this situation, it is better to predict CBR value of subgrade soil with easily determinable parameters. Considering these, different geotechnical properties of soils were determined, its influence were assessed on the CBR and prediction models were developed using SPSS software for the computation of CBR.
2. Methodology
2.1. Sampling Locations
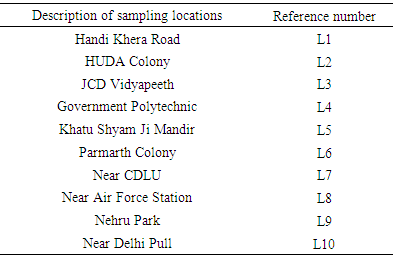
- Sirsa town is situated at latitude 29°32’0” north and longitude 75°1’0” east in Haryana, India. It is at distance of 260 km by rail from Delhi. As the Sirsa township is developing in different directions, therefore, a detailed survey was conducted within a 5 km radius of Sirsa to identify locations for the evaluation of the CBR of the subgrade. Accordingly, 10 sampling locations in different area were selected for soil sampling. The details of the sampling locations are given in Table 1.
|
2.2. Collection of Samples
- Different researchers have collected the soil samples from different depth for the CBR test. The samples have been collected by digging a pit of about 1m x1m x1m but it is possible to get acceptable quality of soils within 60 cm depth from the ground level, which can be used in the subgrade and even in subbase/base courses [11]. Alhassan and Olaniyi [12] collected the soil samples from the depths between 40 cm and 150 cm after removing the topsoil whereas Riaz et al. [13] collected the samples from 91.4 cm depth. Jayakumar and Singh [14] collected the samples from the depth of 50 cm to 80 cm to assess the strength of subgrade soil. Considering these, the samples were collected from 50 cm depth from the ground surface. The tools like trowel, spade, auger, etc were used for samples collection. Sampling tubes made up of steel were used for the collection of bulk density samples. The collected samples kept into thick quality polythene bags were labelled, sealed and brought to the laboratory for analysis.
2.3. Testing of Geotechnical Properties of Soil
- The geotechnical properties of soils were determined in the Geotechnical Laboratory of Civil Engineering Department, Jan Nayak Ch. Devi Lal Memorial College of Engineering, Sirsa. The methods adopted for testing of different parameters are as under:
2.3.1. Specific Gravity
- It is the ratio of the weight in air of a given volume of dry soil solids to the weight of equal volume of distilled water at 4°C. Particles passed through 4.75 mm IS sieve were used for determining specific gravity with the help of density bottle [8]. The density bottle method is the most accurate and is suitable for all types of soils in the laboratory [15].
2.3.2. Grain Size Analysis
- For grain size analysis, air dried soil sample of 500 gm was sieved through a set of sieves ranged from 4.75 mm to 75 µm. The entire set of sieves was kept on electric sieve shaker machine and operated for 10 minutes. Percent finer for different sizes of the particles retained on different sieves were calculated. The percentage finer (summation passing) was plotted as ordinate (on arithmetic scale) and the particle size (aperture size) as abscissa (on log scale) [16, 17].
2.3.3. Consistency Limits
- Soil sample passing through 425 µm sieve, weighing 120 gm was mixed with distilled water to form a uniform paste. A portion of the paste was taken in the cup of a liquid limit device. In the paste, a groove was formed and then device was operated at the rate of two revolutions per second until the two parts of the soil came in contact at the bottom of the groove along a distance of 12 mm. After that the numbers of drops were recorded. Finally, moisture content corresponding to 25 numbers of blows was taken as the liquid limit [18].For the determination of plastic limit, 20 gm of soil passing through 425 µm sieve was taken and mixed thoroughly with distilled water so that it could become plastic enough. Then out of 20 gm wet soil, 8 gm of soil was taken to form a ball. The ball was rolled on the glass plate with the palm of the hand to form a thread of 3 mm uniform diameter throughout its length. The rolling process was continued till the thread just crumbles at 3 mm diameter. Then moisture content of the crumbled thread was determined as plastic limit [17]. The numerical difference between liquid limit and plastic limit is known as plasticity index. It indicates the degree of plasticity of a soil. Greater the difference between liquid and plastic limits greater is the plasticity of the soil. A cohesionless soil has zero plasticity index. Hence it is called non-plastic [19].
2.3.4. Compaction Test
- 3 kg of air-dried soil was sieved by 4.75 mm sieve. As the percentage of soil retained on the 4.75 mm sieve was less than 20%, therefore, 100 mm diameter mould was used. The capacity of the mould was 1000 ml and the weight of the rammer was 2.6 kg. The samples were mixed with water to about 4% in case of sandy soil and about 8% in the clayey soils. The moist samples were compacted into the mould in three layers with each layer of 25 blows from 310 mm drop height. The water content and dry density of the compacted soils were determined. Further, the water content was increased in the soil and compacted. Different values of water content and dry density were computed and graph was plotted to determine the maximum dry density (MDD) and optimum water content (OMC) [20].
2.3.5. California Bearing Ratio
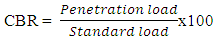
- The CBR is the measure of strength of subgrade soils (foundation soils) for construction of the pavements [21]. It has been found that moisture content is the most important factor in the case of clayey soils, which are most likely to suffer by water absorption. It is therefore, important to ascertain the wettest condition in a given case and the basis of design should be the strength of the subgrade in that condition. Testing the compacted soil for bearing strength at 100 percent saturation is essential for areas subject to water-logging and floods. As the governing factor is the bearing strength after full soaking, a soil which does not prove satisfactory after full soaking can be improved by suitable admixture of granular material. All clayey soils must be tested after full soaking whether or not the area is subjected to water-logging [1]. The CBR method combines a load penetration test performed in the laboratory or in-situ with the empirical design charts to determine the thickness of the pavement and of its constituent layers. It is a small scale penetration test in which a cylindrical plunger of 5 cm diameter is penetrated into a soil mass (subgrade material) at the rate of 1.25 mm/minute. The loads required for a penetration of 2.5 mm and 5.0 mm were determined. The greater of these values was taken for the design of pavement.
 About 5 kg soil was taken and mixed with exact quantity of water required for optimum water content. The sample was kept in the mould and compacted in 3 equal layers, each layer given 56 blows by 2.6 kg rammer with drop height of 310 mm and soaked into water for 96 hours for soaked test. Two weights each of 2.5 kg was put in CBR mould during testing. The load dial gauge and the displacement dial gauge were adjusted to zero. Load was applied on the plunger to keep the rate of penetration as 1.25 mm per minute. Load corresponding to penetration of 0.0, 0.5, 1.0, 1.5, 2.0, 2.5, 3.0, 4.0, 5.0, 7.5, 10.0 and 12.5 mm were noted. Then load-penetration curve was plotted. The corrected loads corresponding to penetrations of 2.5 mm and 5.0 mm were found out [8, 20].
3. Results and Discussion
- Different geotechnical properties like specific gravity, particle size, liquid limit, plastic limit, plasticity index, maximum dry density and optimum water content of soils, collected from the different locations of the Sirsa town were determined. The California bearing ratio was also assessed. At most of the locations, soils were cohesionless in nature. Only at few locations, soils were cohesive. Influence of individual and multiple geotechnical properties of soils on CBR were assessed.
3.1. Specific Gravity
- Specific gravity is an important index property of soils that is closely linked with mineralogy or chemical composition [22] and also reflects the history of weathering [23]. The plot of specific gravity with CBR shows that increase in specific gravity increases the CBR values (Figure 1). Correlations are statistically significant at 1% level of significance indicating influence of specific gravity on CBR. It gives an idea about the suitability of the soil as a construction material; higher value of specific gravity gives more strength for roads and foundations [24].
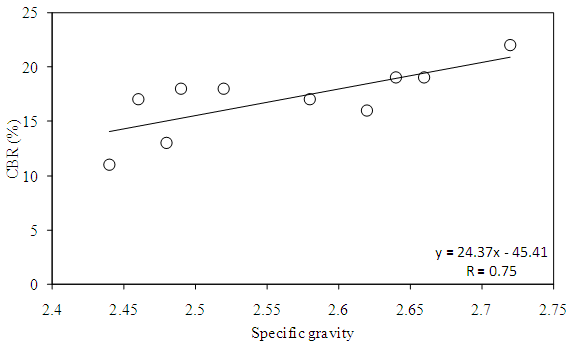 | Figure 1. Correlation of CBR with specific gravity |
3.2. Particle Size Analysis
- The particle size distribution curve (gradation curve) represents the distribution of particles of different sizes in the soil mass [25]. The subgrade soil strength depends on type of subgrade soil, internal structure of the soil and the type and mode of stress application. The shearing resistance in soil represents the subgrade soil strength [26]. The shear strength parameters of a granular soil are directly correlated to the maximum particle size, the coefficient of uniformity, the density, the applied normal stress, and the gravel and fines content of the sample. It can be said that the shear strength parameters are a result of the frictional forces of the particles, as they slide and interlock during shearing [27]. Soil containing particles with high angularity tend to resist displacement and hence possess higher shearing strength compared to those with less angular particles [28].The particle size distribution curves are shown in Figure 2. The curve is used to define the grading of soil in terms of effective size, the uniformity coefficient and the coefficient of curvature. The coefficient of uniformity (Cu) and the coefficient of curvature (Cc) are defined as
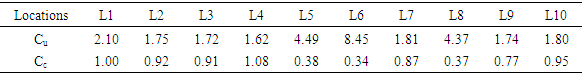
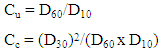 Where, D10=particle diameter at 10% finer, D30=particle diameter at 30% finer, D60=particle diameter at 60% finer.The coefficient of curvature, Cc is a measure of the symmetry and shape of the gradation curve. For a soil to be well graded, Cc must lie between 1 and 3 and in addition, Cu must be greater than 4 for gravels and greater than 6 for sands. If both these requirements are not met, the soil is termed as poorly graded [28, 29]. From Table 2, it is observed that coefficient of uniformity and coefficient of curvature obtained from the Figure 2 does not meet the criteria hence soils might be considered as poorly graded.
|
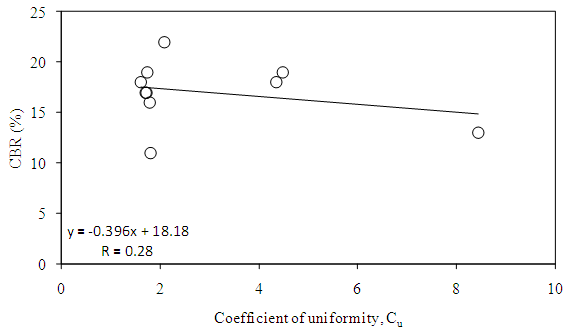 | Figure 3. Correlation of CBR with coefficient of uniformity |
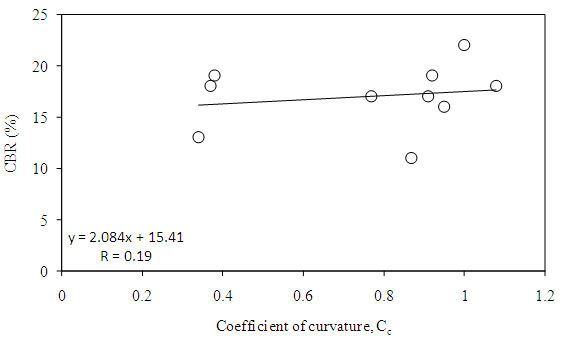 | Figure 4. Correlation of CBR with coefficient of curvature |
3.3. Consistency Limits
- Consistency limits and the plasticity index vary for different soil types and therefore, these properties are generally used in the identification and classification of soils. Soils having high values of liquid limit and plasticity index are poor as engineering materials. Both liquid limit and plastic limit depend on the type and amount of clay in soils. The plasticity index generally depends only on the amount of clay present; giving an indication of clay content in soil [26].The liquid limit of a soil is defined as the moisture content above which the soil behaves as a liquid [30]. The correlation between liquid limit and CBR is insignificant (Figure 5) whereas negative trend line indicates that as the liquid limit increases CBR decreases. In the study area, most of the locations have cohesionless soils, which might be the reasons of poor correlations. The negative insignificant correlation between liquid limit and CBR was also observed by Talukdar [6] and Saklecha et al. [21].
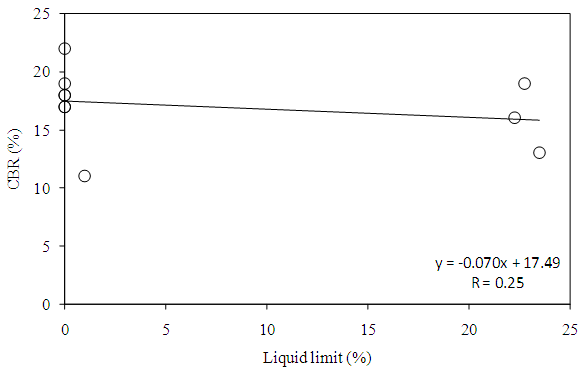 | Figure 5. Correlation of CBR with liquid limit |
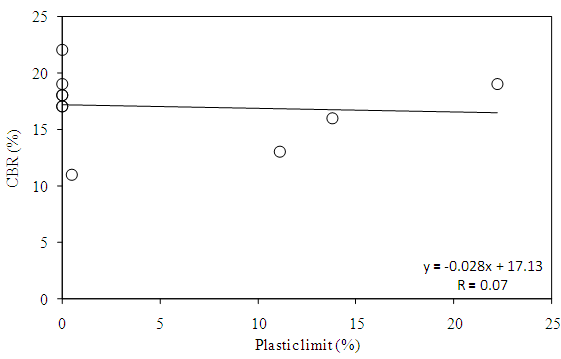 | Figure 6. Correlation of CBR with plastic limit |
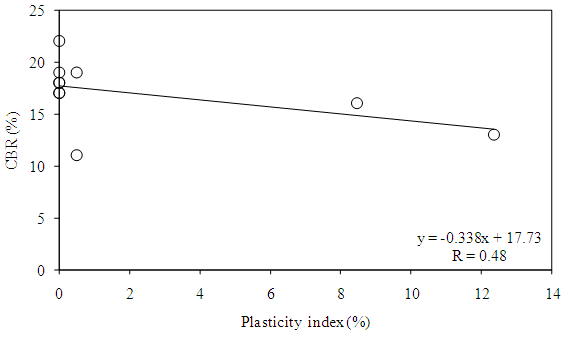 | Figure 7. Correlation of CBR with plasticity index |
3.4. Compaction
- Water in soil acts both as a lubricant and as a binding agent among the soil particulate materials, thereby influencing the structural stability and strength of soil and geologic materials [31]. The correlation between CBR and maximum dry density was found significant (Figure 8) indicating that density influences the CBR. According to Raj [17], CBR values are higher when the compacted densities are high and when the clay content, liquid limit and plasticity index are low. Figure 9 shows influence of optimum moisture content on CBR. The correlation was statistically significant indicating that as the OMC increases CBR decreases.
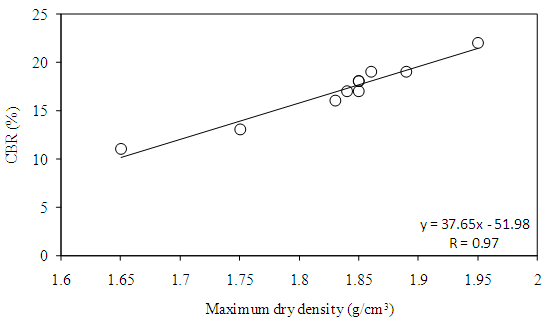 | Figure 8. Correlation of CBR with maximum dry density |
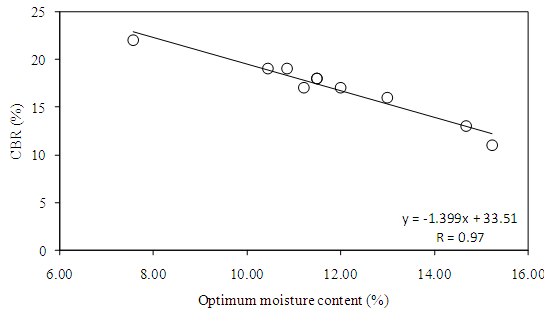 | Figure 9. Correlation of CBR with optimum moisture content |
3.5. Multiple Linear Regression Analysis of Data
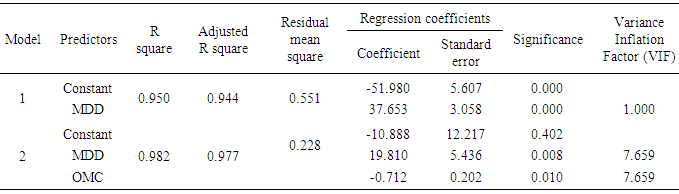
- In preceding sections, it was observed that individual correlation of geotechnical properties with CBR varied differently. To determine the most influencing parameters as well as to develop a multiple linear regression model for the assessment of CBR from the sets of data generated, SPSS software version 13.0 was used. Stepwise regression algorithm was followed for the selection of variables. According to different researchers [32-34], stepwise multiple regression procedure is commonly used to produce a parsimonious model that maximizes accuracy with an optionally reduced number of predictor variables. Table 3 shows the model summary of CBR. The adjusted R2 value is the highest and the residual mean square is the lowest for model 2. The derived regression coefficients are neither zero nor less than the standard error. For a model, adjusted R2 increases if the addition of the variable reduces the residual mean square. In addition to this, it is not good to retain negligible variables, that is, variables with zero coefficients or the coefficients less than their corresponding standard errors [35]. Variance inflation factor (VIF) for the input variables is lower than 10 indicating that there is no multicollinearity. According to Montgomery et al. [35], VIF lower than 10 do not imply problems with multicollinearity whereas higher values cause poor prediction equations. Therefore, regression coefficients for the predictors of model 2 were used to derive the equation for CBR, which is as under:
 | (1) |
|
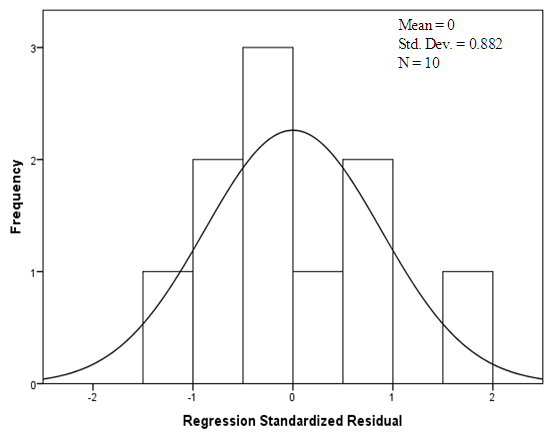 | Figure 10. Standardized residual analysis of CBR |
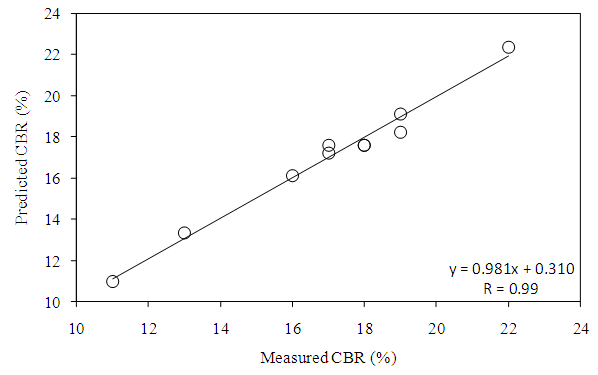 | Figure 11. Correlations between predicted and measured values of CBR |
4. Conclusions
- Coefficient of uniformity and coefficient of curvature determined with the help of particle size distribution curves showed poor gradation of particles.CBR was significantly correlated with specific gravity, MDD and OMC whereas it was insignificantly correlated with liquid limit, plastic limit and plasticity index. The soils at most of the locations are cohesionless in nature, which might be the reasons for insignificant correlations with these properties. Poor gradation of particle sizes indicated insignificant correlations with coefficient of uniformity and coefficient of curvature.Based on stepwise regression procedures, MDD and OMC were selected as the most influencing parameters for the CBR. Model adequacy checked by various statistical methods showed that developed multiple regression models can be used for prediction of CBR of the study area. Hence, the model developed does not need to go for sophisticated and time consuming laboratory tests for the soaked CBR.The models will be useful not only for individuals but also for the government agencies, who are involved in road constructions in the study area. The cost and time required for soaked CBR test will be saved.