-
Paper Information
- Paper Submission
-
Journal Information
- About This Journal
- Editorial Board
- Current Issue
- Archive
- Author Guidelines
- Contact Us
Resources and Environment
p-ISSN: 2163-2618 e-ISSN: 2163-2634
2016; 6(1): 9-15
doi:10.5923/j.re.20160601.02

An Analysis of Soil Physico-Chemical Properties of Kerang Volcanic Landscape Catena, Jos Plateau, Nigeria
 Abstract
 Reference
 Full-Text PDF
 Full-text HTML
Musa Salihu Danlami, Abu Hassan Onimisi
Department of Geography and Environmental Studies, Kogi State University, Anyigba, Nigeria
Correspondence to: Abu Hassan Onimisi, Department of Geography and Environmental Studies, Kogi State University, Anyigba, Nigeria.
| Email: |  |
Copyright © 2016 Scientific & Academic Publishing. All Rights Reserved.
This work is licensed under the Creative Commons Attribution International License (CC BY).
http://creativecommons.org/licenses/by/4.0/

An analysis of soil physico-chemical properties along the volcanic landscape catena in Kerang, Plateau State, Nigeria, was carried out to determine the level of soil variation along the landscape. Kerang volcanic landscape serves as a hub for agricultural activities on the Plateau. The performance of the crops on the volcanic landscape differs from one segment to another, the graduation in the crop performance as reflected by their height and vigor along the volcanic landscape brought about the need to examine the physico-chemical properties of soils in Kerang. To ensure large crop production and food security, there is a need to find out the variation in soil chemical properties along the landscape so as to be able to advise the farmers on soil management techniques and the type of crops to be grown on each segment to ensure sustained food production and food security in the region and in Nigeria at large. The study area covered a horizontal distance of about 2km and a vertical height of 160m. Five sampling points were identified; the crest, the side slope, upper foot slope, middle foot slope and the lower foot slope. A composite systematic sampling technique was adopted for the collection of the soil samples. The materials used include soil auger, hand trowel, measuring tape and polythene bags. The result of the laboratory analysis carried out showed considerable variation in the soil physico-chemical properties across the volcanic landscape. The results were further subjected to analysis of variance test at 0.05 confident level. This scenario indicates heterogeneity of the landscape implying that all crops can grow everywhere in the study area.
Keywords: Catena, Kerang, Volcanic, Farmers, Soil
Cite this paper: Musa Salihu Danlami, Abu Hassan Onimisi, An Analysis of Soil Physico-Chemical Properties of Kerang Volcanic Landscape Catena, Jos Plateau, Nigeria, Resources and Environment, Vol. 6 No. 1, 2016, pp. 9-15. doi: 10.5923/j.re.20160601.02.
Article Outline
1. Background to the Study
- One of the striking observations that are unique of a typical volcanic landscape on the Jos Plateau is the graduation in crop’s performances as reflected by their height and vigor along a land catena (Olowolafe, 1995). Another obvious differentiating characteristic of the volcanic landscape on the Jos plateau in Nigeria is the extensive and intensive agricultural activities going on in the area (Kerang) during cropping seasons. The crops grown in the upper parts appeared relatively better than those in the lower part of the landscape. Since the underlying geology, climate, and agricultural land management practices are relatively uniform, the difference in the internal properties of soil across the landscape may have contributed to such variations (Olowolafe, 2001).These variations may have considerable consequences for crop production. Agriculture is and has always been an activity involving close interaction with the environmental factors. Soils, Climate, Topography, Hydrology and Biological conditions all exert major control upon farming operations, farming techniques and profitability of Agriculture. The importance of these variations in soil properties across a typical volcanic Landscape can only be seen in the magnitude of change and potential implications in the total crop yield per annum.If every other environmental factors is held constant, since the region is within the same geographic zone, then variation in the soil chemical properties which determines the level of soil fertility may have been responsible for such variation in crop performances across the volcanic land catena, hence the need to investigate the status of soil chemical properties across the volcanic land catena. To ensure soil good management techniques and environmental sustainability that could culminate into great crop yield, the status of soil chemical properties should be determined.Several approaches have been advocated to ensure high agricultural productions and environmental sustainability; such approaches according to Amuyou (2015) include precision agriculture. This concept is geared towards Site Specific Crop Management (SSCM). It is defined as matching resources application and agronomic practices with soil and crop requirements as they vary in space and time within a field (Whelan and Mcbratney, 2000).The main objective of this study is to find out the variation in soil chemical properties across the landscape and hence determine the level of soil fertility across the volcanic land catena. According to Budelman et al., (1998), the soils of a catena are all derived from the same parent material, but topography and the movement of water could cause differences in its chemical properties over time hence reflecting in the performances of the crops on the volcanic landscape catena. He argued that the soils on the upper parts of the slope in the northern region of Sukumaland, Tanzania are typically well drained, light and sandy at the crest.Lufafa et al., (2003) and Fungo et al., (2011), argued that increased intensive cultivation of fragile landscape has led to severe soil degradation in the tropical environment. The rapid rate of soil loss and fertility decline in the tropical environment characterized by fragile topographic processes has led to food insecurity in developing countries (Amuyou et al., 2015). The management of an agricultural volcanic landscape intensively and extensively cultivated should have a functional relationship with the fertility status of the soil. According to Olowolafe et al., (1999), the double challenge of increasing food production to cover human need and preserving the natural resources on which agricultural production depends has led to the concept of sustainable agriculture. International agreement has been achieved on the core Land Quality Indicator (LQI) recommended for research on sustainable agriculture in the major Agro-Ecologic Zones (AEZ’s) of tropical, subtropical and temperate environments. These include nutrients balance, yield trends and yield gap, land use intensity land use diversity (agro-diversity).Olowolafe et al., (2001) who carried out a similar study on Vom and Miango volcanic land catena found out that, the soil pH decreases from the upper parts of the catena to the lower part. At the shoulder, back slope, foot slope and toe slope the pH he recorded were 5.9, 4.8, 4.5 and 4.4 respectively. He equally observed that the organic matter content, potassium, calcium and magnesium generally decreases from the upper part of the catena to the lower part, showing that the farthest soil sample from the volcano contain low K, Ca and Mg. He however stated that this does not hold for the soil along the drainage channel because of its exceptional high content of sediments from upstream. According to Egawa (1977), Shoji et al., (1985), and Olowolafe (1995) the CEC of the soil derived from volcanic materials are greatly enhanced by their organic matter content.
2. Methodology
- Ÿ The vertical height of the volcanic landscape from lower foot slope to the crest is about 160 metre while the horizontal distance covers about 2km from the lower foot slope to the crest. This was divided into five sampling points based on the various segments marked out along the catena which are: the crest, upper foot slope, side slope, middle slope and the lower slope.Ÿ Systematic composite sampling techniques were used to collect soil samples along the catena, this involved collection of four samples at every sampling point and mixed together and then a single sample taken from the mixture to represent that segment. At the end five samples were taken for laboratory analysis. Ÿ The materials used for data collection are; polythene bags, hand trowel, soil auger and measuring tape. Ÿ Laboratory analyses was carried out on the soil samples, using laboratory standard procedure, particles size analysis was made by using hygrometer described by Gee and Bauder (1986). Measurement of pH was done in a 1:2.5 suspension water, organic matter was determined by dichromate oxidation method as described by Nelson and Somers (1982).Ÿ The extraction of Ca, Mg and K was made using IN ammonium acetate at pH 7.0 (USDA 2004). Ca and Mg were measured by using an Atomic Absorption Spectrophotometer (AAS) while K was measure with the aid of flame photometer. Ÿ Available Phosphorus was extracted using diluted HCL/NH4F as described by Bray and Kurtz (1982). Ÿ The total Nitrogen was determined following the regular Kjeldahl method (Bremner and Mulvaney 1982).Ÿ An analysis of variance was carried out to determine the level of variation in OM, pH, Ca, AP, K, Na, Mg and TN across the five positions which are the crest, side slope, upper foot slope, middle foot slope and the lower foot slope.
3. The Study Area
- Kerang is well situated in the central part of Jos Plateau. The study area is located on the latitude 9° 20’N and 9° 25’ N, Longitude 9° 15’ E and 9° 20’E. The area stands out in the central region of Jos Plateau with an elevation of 1388m above mean sea level.The geology of the area is mainly that of newer basalt, pumice, lava flow and as deposits. The newer basalts occupy nearly 388.5km2 in the western and southern Plateau and covers considerable large area below an escarpment in the west and south east. Beyond these areas, newer basalt extended eastward to Shemankar valley (Falconer, 1921). The cones tends to be aligned in the direction of north-north-east and north-north-west corresponding to the numerous diorites dykes which are probably of older basalt of western plateau and the Panyam- Kerang volcanic line as described by Falconer (1921). There are six volcanoes in the study area with lengths of about 29.5km. Dyke spring water came out of one, which explains the location of Spring Water of Nigeria Kerang, Nigeria. (SWAN), a famous water Bottling Company in Nigeria.The climate is determined by two main factors; its high altitude and its position across the path of seasonal migration of the Inter-Tropical Convergence Zone (ITCZ). On account of its altitude the region experiences lower temperature than anywhere else in Nigeria. It has a mean annual rainfall of about 1, 260mm with its peak around July. The mean annual temperature is about 22°C with mean monthly temperature of about 19.5°C. the coolest month is December when the cool and dry north-easterlies a tropical continental air mass come upon it with the temperature dropping to about 16°C in some cases.
4. Discussion of the Results
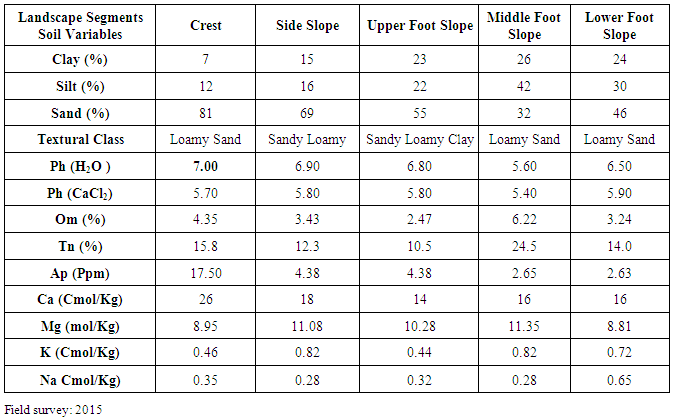
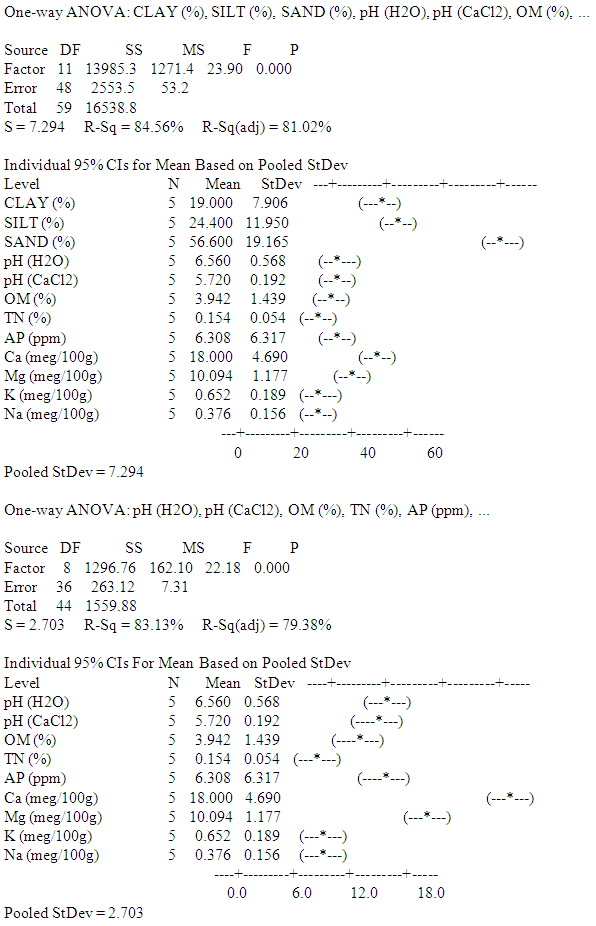
- Soil PropertiesBased on the results of the soil analysis, there are considerable variation in soil properties which could be responsible for graduation in crop performances and crop production along the catena.
|
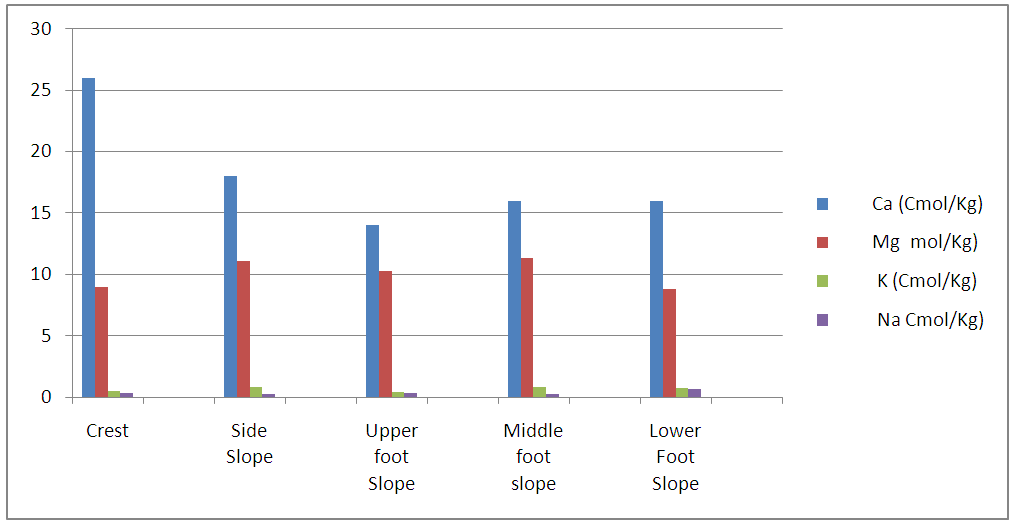 | Figure 1. Variation in Chemical Properties |
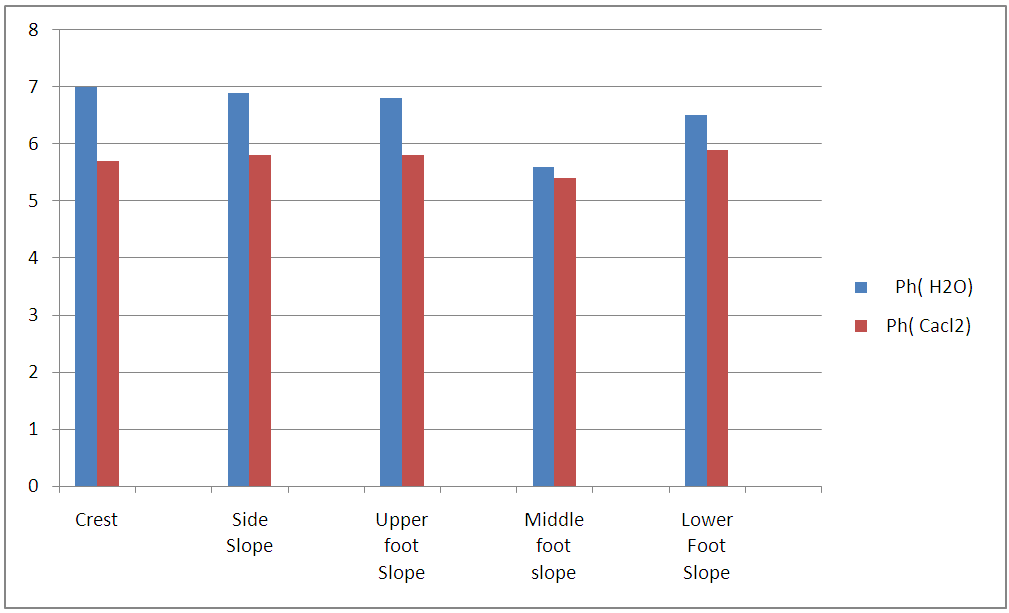 | Figure 2. pH Values across the Landscape |
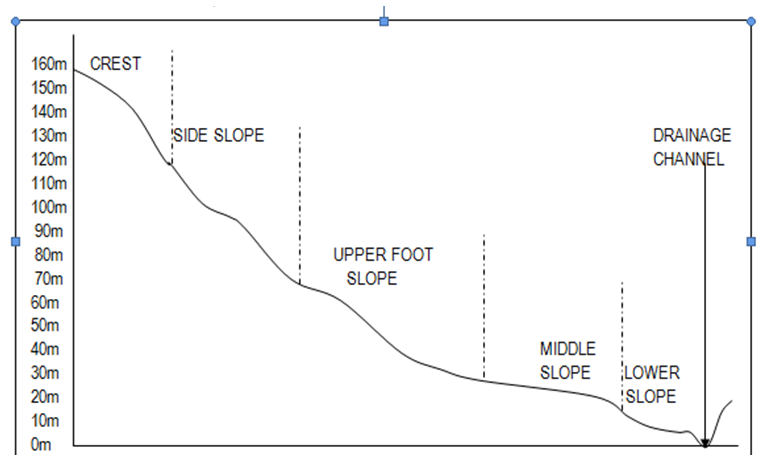 | Figure 3. The Cross Section Showing the Variation in Slope along Kerang Volcanic Landscape, Jos Plateau |
5. Observations
- i. There are variations in soil fertility variables (total nitrogen, available phosphorus and other exchangeable cations) from the crest to the lowest parts of the landscape.ii. The performances of the crops grown on the Kerang volcanic landscape varied from the crest to the lower foot slope, which confirms the finding of Olowolafe, (1995) and Budelman (1998). iii. The soil organic matter is higher at the middle foot slope with 6.22%, this shows that there are more microbial activities at this segment which helps in breaking down of organic materials than the other segments.iv. Clay and silt are higher at the middle and lower foot slope which also shows that the water holding capacity of these segments will be higher and will tend to attract crops that love water.
6. Recommendations
- a. Farmers should be properly educated on the variation in soil physico-chemical properties which determines the level of soil fertility across the landscape so as to guide them on the type of crop to cultivate at certain segment of the landscape.b. The uneducated farmers should be properly taught the best practices of sustainable agriculture particularly in the aspect of land management and soil conservation.c. The farmers could improve on their remedial actions against soil erosion to minimize the movements of soil fertility variables from one segment into another, which could have course the current variations in soil properties across the volcanic landscape catena.d. Farmers are advised to carry out practices such as adding crop residues, house hold manure and animal manure to the soil and the general maintenance of soils surface roughness using minimum tillage system, all to help in the controlling run-off water and to improve infiltration.