-
Paper Information
- Paper Submission
-
Journal Information
- About This Journal
- Editorial Board
- Current Issue
- Archive
- Author Guidelines
- Contact Us
Resources and Environment
p-ISSN: 2163-2618 e-ISSN: 2163-2634
2015; 5(5): 159-166
doi:10.5923/j.re.20150505.04
Application of Cross-Correlation in Pipe Condition Assessment and Leak Detection; Using Transient Pressure and Acoustic Waves
 Abstract
 Reference
 Full-Text PDF
 Full-text HTML
Mohammad Mehdi Hafezi, Mohammad Mirhosseini
Master of civil and environmental engineering, the University of Adelaide
Correspondence to: Mohammad Mehdi Hafezi, Master of civil and environmental engineering, the University of Adelaide.
| Email: |  |
Copyright © 2015 Scientific & Academic Publishing. All Rights Reserved.
Leak detection and location in pipeline network is a major problem and has been the focus of water authorities for many years Application of cross-correlation of pressure transient and acoustic waves have been investigated in this research. For this purpose, the cross-correlation of acoustic waves measured at either sides of a leakage which are generated as a result of existence of that leakage in a pipeline system can provide us with an adequate source of data that gives the time delay of signals. Subsequently, it has been verified that the leakage can be located considering the time delay of signals and the acoustic wave speed. In addition, this research has also recognized pressure waves as an important source of data that can be used in conjunction with acoustic waves. Accordingly Cross-correlation of pressure transient waves has also been verified via numerical simulation and field experiments as an applicable technique in pipe condition assessment. Thus, it has been introduced as an innovative method and also paralleled with the previously recognized method; cross-correlation of acoustic wave in locating leakage or blockage in pipeline systems.
Keywords: Pipe condition assessment, Leak detection, Pipeline analysis, Cross-Correlation, Acoustic wave, Pressure wave
Cite this paper: Mohammad Mehdi Hafezi, Mohammad Mirhosseini, Application of Cross-Correlation in Pipe Condition Assessment and Leak Detection; Using Transient Pressure and Acoustic Waves, Resources and Environment, Vol. 5 No. 5, 2015, pp. 159-166. doi: 10.5923/j.re.20150505.04.
Article Outline
1. Introduction
- According to international surveys, 25-40% of water is lost between source and customers via leakage in pipe networks which make the leakage problem a top priority to tackle [1]. Owing to the fact that the majority of water distribution systems are widely distributed and buried underground, the pipeline condition is very difficult to assess. Identified methods of leak detection are mostly categorized into two major groups: external and internal methods. External techniques are those detecting leaks outside the pipeline such as visual inspection, acoustic emissions, liquid sensing and vapour sensing [2]. Internal methods, which are applied to identify leaks from inside pipeline networks, often require collecting data from the field instruments and analysing the information mathematically or statistically.Acoustic and transient based methods, which are considered as a promising area on leakage detection, are developed quickly in recent years through analyzing induced pressure or acoustic waves in pipelines. As induced waves propagate in a pipeline at the speed of sound, partial of these Pressure waves are reflected back each time they passes the feature [3]. Therefore, pipe conditions can be inferred by analyzing these reflected waves. The theory behind these proposed methods is based on the theory that the fluid propagates sound that travel down a pipe as a fluid escapes from the pipe. The sound can be used not only to detect a leakage but also to pinpoint the location of the leakage along a pipe [4]. This research aims to assess cross-correlation of acoustic wave method which has developed to one the most significant methods in recent years and also propose a new method using transient waves. Both methods has been suggested by employing two sensors to be located at both sides of suspected leak location.Despite the fact that some research has been conducted in the application of cross-correlation of acoustic waves in detecting leakage by analyzing and assessing propagated waves, there are still significant uncertainties and difficulties in the application of this methods that is also targeted to be reflected in this research work.
2. Previous Research Work
- Sharp, et al [5] has primarily proposed a method by analyzing acoustic waves in pipelines. They found recorded or measured acoustic waves contain valuable signals that can reflect any corrosion or leak in pipelines. While, in detection, acoustic or pressure propagated waves analysis works based on the fact that in fluid systems (pipeline in this case), any changes in the steady-state operating condition result in propagate or changes of waves in the assessed fluid system stream [3]. Consequently, a number of research have been conducted on the application of acoustic wave processing using cross-correlation of acoustic waves based on Sharp, et al [5] findings such as; [6], [7] and [8]. It is to be noted that further applications of cross-correlation technology in pipeline assessment have been explored in recent years. For noteworthy instances, Jung, et al [9] and Hanus, et al [10] have suggested applying cross-correlation in flow-rate measurement of dual-phase pipe flow and velocity measurement of liquid-solid flow in vertical pipelines.
3. Leak Detection Using Cross-Correlation of Pressure Signal Waves
- Pressure–time wave signals contain remarkable information which needs to be processed to get desirable information. The basic concept of this method is adapted from the theory of the effect of any changes including leakage or deterioration along the pipelines, on the pressure as result of the movement of pressure transient waves through the flowing fluid in a pipeline. This basis is similar to various pressure- based leak detection method’s basic principle such as Bourne & Ferrante[11], Vitkovsky, et al [12], Taghvaei, et al. [3], Colombo, et al [13] and Gong, et al [14].Interpretable data are to be obtained which can be the basis of the assessment a pipeline condition by processing the pressure wave signals of two points at either side of the leak or deterioration. Cross-Correlation has been identified as the key tool in signal processing to interpret obtained data from those two data points.
3.1. Methodology of the Method
- Cross-correlation is a measure of similarity of two waveforms which is pressure fluctuations along the pipe that is obtained as a function of a time-lag. The calculated time-lag component is applied to one the two assessed signals as a proportion of the signals time intervals. Cross-Correlation has wide range of applicability including recognition of signal patterns, searching for long-signal for a shorter, signal particle analysis, neurophysiology, cryptanalysis and its application in determining the time delay between two signals that is the centre of attention in this method (Hanson, et al., 2007). The cross-correlation for continuous functions g and f is mathematically defined as:
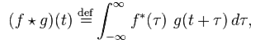 | (1) |
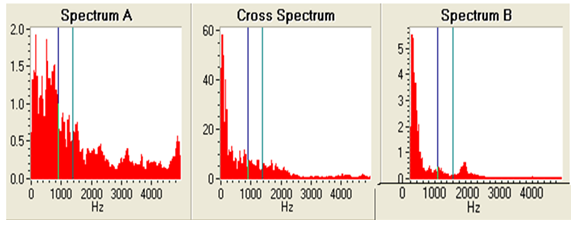
 is the time-lag and f* represents the complex conjugate of f« (first function) and the sign also shows the action of cross correlation between two signals. It is to be mentioned that the Cross-Correlation is similar to the convolution of two functions inherently.Accordingly, the application of cross-correlation in this method is based on the effect of leak or any other unexpected changes along the pipe on two recording pressure points which lead to fluctuation of pressure-time signals. The pressure changes, as result of the leakage, propagates to the recording points along the pipeline as same speed as wave speed. Therefore, the effect of this pressure changing reaches the recording pressure points in different times. In other words, the nearest recording point is affected first and then the pressure of farther recording point or sensor is affected. Recording points or sensors, as explained, are located at the points in either side of the assessed location along the pipe as shown in the following figure.
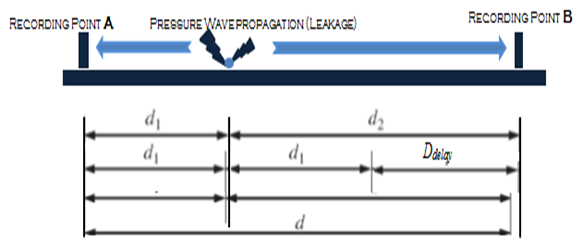 | Figure 1. Layout of cross-correlation Experiment |
 compared to the Point A. Ddelay is the function of wave speed and time delay of two signals
  , so the transient generator or leak can be located using the following equation;
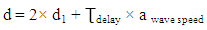 | (2) |
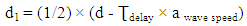 | (3) |
 is obtained using cross-correlation of two signals.
3.2. Numerical Simulation for Leak Detection Using Cross-Correlation of Pressure Wave Signals
- The Hytran software has been used in this experiment to simulate a simple pipeline. The layout of the simulated pipeline is a long pipeline with 22,749.00 meter length and a pressure transient wave generator is located in the pipe where two sensors or pressure measurement points/stations are located at either sides of the generator in different distances as demonstrated in the following figure.
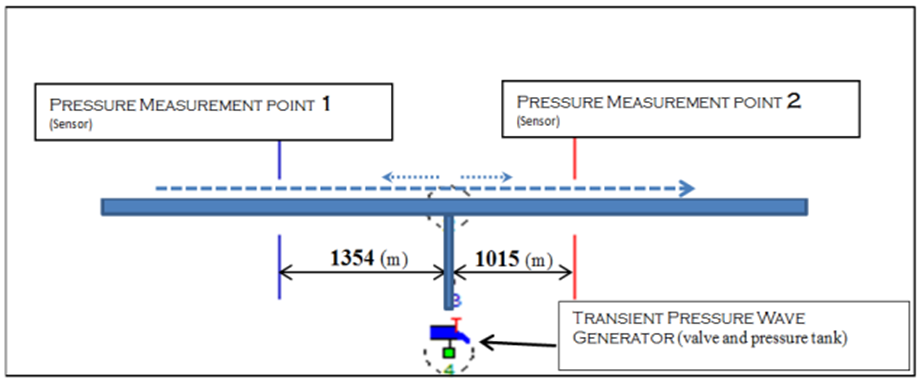 | Figure 2. Layout of Numerical simulation for Cross-correlation of Pressure waves |
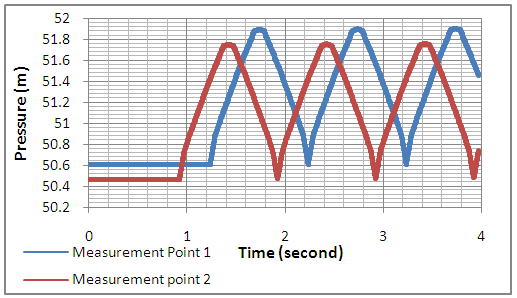 | Figure 3. Measured pressure-Wave signals (Numerical simulation) |
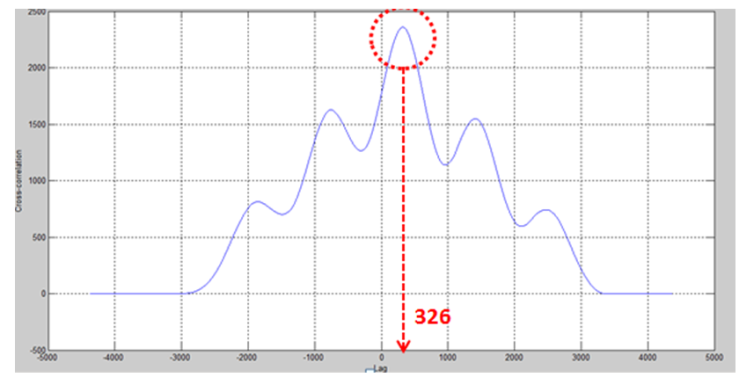 | Figure 4. Cross correlation of measured pressure-Wave signals (Numerical simulation) |
 | (4) |
 | (5) |
 | Figure 5. Layout of field experiment for cross-correlation of pressure wave signals |
3.3. Field Experiment for Leak Detection Using Cross-Correlation of Pressure Wave Signals
- The field experiment analysis is undertaken as a complementary investigation of the theory and numerical simulation. So, the basics and analysis of the experiment were almost the same as the numerical simulation. The experiment has been undertaken on a long pipeline with 2000 meter (2 km) length. A Transient Pressure Wave Generation System was connected somewhere along the pipeline in order to propagate pressure transient wave. In addition, two measurement stations were installed at each side of the pipeline. The following figure demonstrates the overall layout of the experiment.The graphs in the following figure individually displays the recorded pressure signal in the measurement points 1 and 2.Subsequently, the cross-correlation of two pressure signals calculated as 552 time-lag. According to the equations 3 and 4, by using the measured wave speed, the distance from measurement point 2 to the pressure wave generator is calculated to be 854.4 meter.
 | Figure 6. Measured pressure-Wave signals at two measurement points (Field Experiment) |
 | Figure 7. First (initial) signal for cross-correlation in numerical simulation |
 | Figure 8. Second (delayed) signal for cross-correlation in numerical simulation |
 | Figure 9. Cross-correlation of numerical simulation |
4. Leak Detection Using Cross-Correlation of Acoustic Waves
- The leakage in the pipeline system causes the transmission of energy waves. The generated Energy from the leak is transmitted within the pipe through the water and also through the pipe walls toward opposite directions. The transmitted energies contain acoustic waves by the speed of acoustic wave. In assessing two different points in a pipeline system, the acoustic waves reach to the further point with a delay. Thus the time delay of signals can be used similarly to detect a leakage in a pipeline system.
4.1. Methodology of the Method
- The basis of this method is based on the application of cross-correlation in finding the time delay of two signals recorded at either sides of the leak. The key difference of this method compared to the Cross-correlation of Pressure waves is in taking cross-correlation of acoustic waves. Hence, formula similar to equations 5 and 6 can be applied in locating leakage in a pipeline system. However, the acoustic wave speed has to be used in the equation as following;
 | (6) |
4.2. Numerical Simulation for Leak Detection Using Cross-Correlation of Acoustic Waves
- In the numerical simulation of method, the acoustic waves as the basis of analysis have to be simulated. The simulated acoustic waves have to be a result of a leak or any other changes along the pipeline. In this subject, extensive studies were conducted and different software have been tried. As there is not a software special for this purpose, acquiring one wave signal using hydrophones in laboratory and delay that signal to create the next signal, was identified as the best initial step to verify the concept of this method. Accordingly, the first (initial) signal and the delayed signal as the second signal are to be cross-correlated to calculate the time delay, and then the calculated time delay is checked to be compared with the delayed time of the second signal to detect its accuracy. The following figure shows an acoustic sample signal from a leak in an ideal condition which have been taken as the first signal for the numerical simulation.As it can be seen, the signal is a repetitive signal which is similar to an acoustic (sound) wave signal as a result of a leakage in a pipeline system. Then, as an essential step this signal is to be delayed.Then, in order to construct the delayed signal, the first signal is delayed by 500. This delayed signal is known as the second signal for cross-correlation. Figure 81 demonstrates the second signal. Besides, because of the fact that in real conditions signals have different white noises apart from the signal’s major pattern. The second signal is also added by white random noises. The following figure shows the second signal that is delayed and also with added noises.As it can be seen in the figure, the second signal’s pattern is not as clear and the first signal because of the noises. However, the filtering can make the second signal’s pattern legible by removing the white noises. Nevertheless, the first signal (original signal) and second signal (delayed signal with noise) were cross-correlated with each other. The figure below shows the cross-correlation graph.As it can perfectly be seen, the peak of the cross-correlation occurred at the 500 time-lag that is the lag-time which the second signal is delayed. Henceforth, it can be concluded that the cross-correlation can be used to locate the leak position in the pipeline if the acoustic wave resulting from leakage is detectable at either sides of the leak. It is to be emphasized that despite of the noises this simulation is in the perfect condition to verify the original notion, while the further studied like as laboratory experiments have to be conducted to validate the method.
4.3. Laboratory Experiment for Leak Detection Using Cross-Correlation of Acoustic Waves
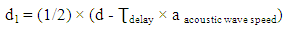
- Laboratory experiments were undertaken as a complementary work to assess the method in more similar to real conditions. Apart from the verification of the methods which is the key target, laboratory experiments have been undertaken for an additional purpose which is the assessment of the variations and effect of different leak size. Single pipeline experiment also aims to examine the effect of different leak size. Two cordless hydrophones that are known as Gutermann - Aquascan model number N 610 have been applied in lab experiments. The sensors were connected to a Laptop to transfer the recorded acoustic waves. Consequently, the cross-correlation is taken using a software, and the time-lag is calculated which is required in the calculation of the location of the leak. The layout of the experiment is shown below;
 | Figure 10. Layout of Laboratory Experiment for leak detection using cross-correlation of acoustic waves |
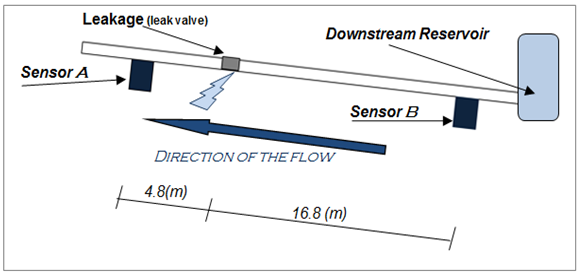
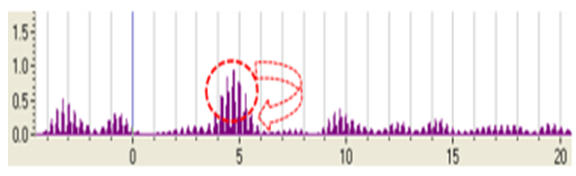
 | Figure 11. Sound wave Spectrum of recorded acoustic waves |
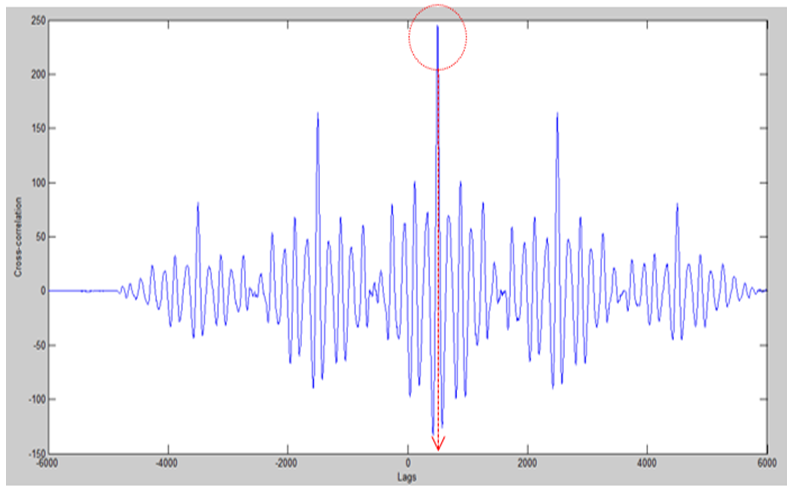
 | Figure 12. Cross-correlation of acoustic waves signals |
5. Discussion of Results and Limitations
- The basis of Cross-Correlation method is based on the time-delay of two signals; the existence of additional patterns can have adverse effect on the method’s ability in leak detection. It is recommended that Cross-correlation of method to be applied mostly in conditions that there are not unwanted signals or any extra devices in a pipeline system. Also, this can be overcome by research on other new forms of pre-processing or filtering methods which can lead to some thought-provoking results. Through the experimental research procedure, different leak sizes have been employed during the experiment by fluctuating the leak valve in order to detect the effect of leakage or corrosion size on the experiment. It has been identified that Cross-correlation of acoustic wave signals method can better detect small size leakages while large sized leakages better suit for applying Cross-correlation of pressure wave method. This fact can scientifically and fundamentally be justified as; smaller leaks are able to create stronger acoustic waves and larger leaks have the capability of propagating stronger pressure waves in pipelines [16].
6. Conclusions
- It is validated and verified in this research that the cross-correlation of acoustic and pressure wave are capable of identifying features which indicate the presence of boundaries, leak and wall thickness change in the pipe network. In terms of leak and wall thickness change detection, the analysis is more accurate and certifiable when the transient reflections from boundaries (reservoir, junction, etc.) are eliminated.Furthermore, the application of cross-correlation of acoustic waves has been verified via numerical simulation and field experiments that the leakage can be located considering the time delay of signals. Also, it was found that the cross-correlation of pressure wave can be used as an applicable and verified method in leak detection. However, the cross-correlation of acoustic wave signals is more suitable for small leakages, while cross-correlation of pressure wave signals are recommended for leakages with large sizes.
ACKNOWLEDGEMENTS
- We would like to express our gratitude for everyone who helped us during this research project, starting with endless thanks for Professor Martin Lambert who didn’t keep any effort in encouraging us, providing our group with valuable guidance and advices to be better each time. We also want to thank Mr. Ian Cates, Mr. Brenton Howie and Dr. Young-ill Kim for their invaluable support during experimental and field works.