-
Paper Information
- Previous Paper
- Paper Submission
-
Journal Information
- About This Journal
- Editorial Board
- Current Issue
- Archive
- Author Guidelines
- Contact Us
Resources and Environment
p-ISSN: 2163-2618 e-ISSN: 2163-2634
2015; 5(4): 110-123
doi:10.5923/j.re.20150504.02
Temporal and Spatial Physico-Chemical Parameters of River Galma, Zaria, Kaduna State, Nigeria
 Abstract
 Reference
 Full-Text PDF
 Full-text HTML
Patrick Ozovehe Samuel1, John Ameh Adakole2, Bolanle Suleiman2
1Department of Biological Sciences, Federal University Of Technology, Minna, Nigeria
2Department of Biological Sciences, Ahmadu Bello University, Zaria, Nigeria
Correspondence to: Patrick Ozovehe Samuel, Department of Biological Sciences, Federal University Of Technology, Minna, Nigeria.
| Email: |  |
Copyright © 2015 Scientific & Academic Publishing. All Rights Reserved.
Fresh water bodies all over the world are constantly faced with pollution challenges most of which are anthropogenic in nature. Determination of physico-chemical parameters is one of the many routine practices of determining the health of the ecosystem and the survivability of the living biota within it. This research focuses on the temporal and spatial physico-chemical parameters of River Galma. Water samples were collected from five different locations along the river course from August, 2014 to January, 2015 for the determination of eleven physico-chemical parameters on monthly basis following standard methods. The results indicate high significance difference (P˂0.05) in biological oxygen demand, hardness, alkalinity, sulphate, nitrate, phosphate-phosphorus, total dissolved solids, electrical conductivity, and temperature of the sampling months with significance difference in dissolved oxygen. There were no significant differences amongst the sites. Electrical conductivity ranged from mean values of 69.20±3.12µs/cm (January) to 157.80±24.69µs/cm (December), the dissolved oxygen: 3.05±0.22mg/l (November) to 5.12±0.20mg/l (January). Biological Oxygen Demand: 2.83±0.27mg/l (December) to 6.37±0.24mg/l (September). Hardness of water: 23.20±4.45mg/l (December) to 177.60±19.71mg/l (September), Alkalinity: 23.00±2.12mg/l (August) to 48.80±1.66 mg/ml (January). The physico-chemical parameters varied widely during the months and locations of the samples and sampling sites. With the exception of the electrical conductivity the physico-chemical parameter were within the acceptable limits. The river is not fit for direct human consumption but it can be put to other uses. This research should serve as invaluable information to the relevant authority and the scientific world on the necessary steps to take to check-mate the effects of pollution on River Galma.
Keywords: River Galma, Physico-Chemical parameters, Xenobiotics, Anthropogenic activities, Acceptable limits
Cite this paper: Patrick Ozovehe Samuel, John Ameh Adakole, Bolanle Suleiman, Temporal and Spatial Physico-Chemical Parameters of River Galma, Zaria, Kaduna State, Nigeria, Resources and Environment, Vol. 5 No. 4, 2015, pp. 110-123. doi: 10.5923/j.re.20150504.02.
Article Outline
1. Introduction
- Water is a natural resource with limited and uneven distribution in time and space. All forms of life and all human activities are dependent on water. Water resources are of great importance to plants, animals, human life and economy and are the main source of meeting the demand for drinking water, for irrigation of lands and industries.The physico-chemical parameters of the river tell much about its quality and suitability for both humans and survival of the living biota within it. Bellingham (2012) stated that, in order to mitigate the impact human societies have on natural waters, it is becoming increasingly important to implement comprehensive monitoring regimes which will quantify water quality, identify impairments and help policy makers make land use decisions that will not only preserve natural areas, but improve the quality of life. Important physical and chemical parameters influencing the aquatic environment are temperature, rainfall, pH, dissolved oxygen and carbon dioxide. Others are total suspended and dissolved solids, total alkalinity and acidity and heavy metal contaminants. Rivers are waterways of strategic importance for domestic, industrial and agricultural purposes (Jain, 2009). As a result, untreated discharge of pollutants to a water resource system from domestic sewers, storm water discharges, industrial wastewater, agricultural runoff and other sources_ all can have short term and long term significant effects on the quality of a river system (Singh, 2007). The dissolved oxygen is important in the natural self-purification capacity of the river (Zeb et al., 2011). BOD (Biological Oxygen Demand) is often used as a measurement of pollutants in natural and waste waters and to assess the strength of waste, such as sewage and industrial effluent waters (Zeb et al., 2011). BOD is an important parameter of water indicating the health scenario of freshwater bodies (Bhatti and Latif, 2011). Maximum amount of oxygen in clean water is about 9 mg/dm3. Prolonged exposure to low dissolved oxygen levels (less than 5 to 6 mg/dm3 oxygen) may not directly kill an organism, but will increase its susceptibility to other environmental stresses. Exposure to less than 30% saturation (less than 2 mg/dm3 oxygen) for one to four days may kill most of the aquatic life in a system. Biochemical Oxygen Demand, or BOD, is a measure of the quantity of oxygen consumed by microorganisms during decomposition of organic matter. BOD is the most commonly used parameter for determining the oxygen demand on the receiving water of a municipal or industrial discharge. BOD can also be used for evaluation of the efficiency of treatment processes, and it is an indirect measure of biodegradable organic compounds in water. High BOD is an indication of poor water quality. The lower the BOD the less organic matter is present in water. A high BOD is often accompanied by a low DO level. Distribution of temperature is different for surface waters and groundwater. Temperature of surface waters depends mainly on water origin, climatic zone, season, altitude, degree of riparian coverage, inflow of industrial and municipal sewage (power plants, industrial cooling). Temperature increase decrease the amount of dissolved oxygen (DO), increase biochemical oxygen demand (BOD), acceleration of nitrification and oxidation of ammonia to nitrates (III) and (V) which eventually lead to oxygen deficit in water. Higher temperature also increases toxicity of many substances (pesticides, heavy metals) and susceptibility of organisms to toxicants. Alkalinity refers to the capability of water to neutralize acids. Generally, the basic species responsible for alkalinity in water are bicarbonate ion, carbonate ion and hydroxide ion, whereas pH is an intensity factor, alkalinity is a capacity (Manahan, 1993). For protection of aquatic life the buffering capacity should be at least 20 mg/dm3.Conductivity is a measure of the capacity of an aqueous solution to carry an electrical current. Conductivity depends on the presence of ions (cations and anions) in water, their total concentration, mobility and valence, and on temperature of water.The hardness of water is the concentration of ions that will react with a sodium soap to precipitate an insoluble residue. Water hardness is the result of dissolved minerals presence, usually total concentration of cations of calcium Ca2+, magnesium Mg2+, iron Fe3+ and manganese Mn2+.Sulphates are one of the least toxic anions and large quantities would have to be ingested in order for health disorders to occur (especially diarrhoea type symptoms). The presence of sulphate in drinking water can result in noticeable bitter taste.Nitrate occurs in water naturally in result of plant or animal material decomposition, but can also be introduced into water due to human activities, e.g. food production, where used as a preservative; use of agricultural fertilizers and manure; disposal of domestic and industrial sewage. Nitrates stimulate the growth of macrophytes and phytoplankton but simultaneously they make up for the nutrient load in water, leading to eutrophication. Some studies have shown there may be a relation between nitrates presence in water and gastric cancer and methemoglobinemia (which in infants is often referred to as blue baby syndrome).Phosphorous is an algal nutrient often contributing to excessive algal growth and eutrophication (Manahan, 1993). Acid rain, mining waste and industrial discharges are among some of the factors that can alter the pH of an aquatic environment.In developing areas and urban centres there are obvious pollution with high levels of faecal coliforms, heavy metals and organic wastes which constitute public health hazards (Arimoro et al., 2007; Ladipo et al., 2012). Aquatic resources are exceptionally valuable natural assets enjoyed by millions of people for domestic purposes, animals, transportation and fish production (Ladipo et al., 2012). The worldwide deterioration of surface water quality has become a growing threat to human ecosystems, therefore the need to understand the spatial and temporal variabilities of limnological parameters (Adeogun et al., 2012).The River Galma is currently loaded with run-offs from agricultural and municipal activities of the surrounding communities along its course at various adjoining tributaries (most of which are seasonal); and contain myriads of toxic pollutants (heavy metals inclusive). There may also be contribution of toxic pollutants from the few industrial activities in Chikaji and Dakace areas. River Galma receives variable levels of pollution from different sources of anthropogenic activities along its banks (Butu and Bichi, 2013). Monitoring of water quality will ensure protection of public health (WHO, 2011), since about 90% of water supply globally comes from large water bodies.
2. Materials and Methods
- Description of Study AreaRiver Galma is one of the main tributaries of River Kaduna. It has its headwaters near the north western edge of the Jos Plateau and falls near the Magami village into Kaduna plains. The main tributaries of Galma River are Shika River in the middle course and the Rivers Kinkiba and Likarbu in its lower course. The Galma reservoir which is popularly called Zaria dam was constructed across the Galma River in 1975. The major land use in the catchment areas is farming and animal rearing. There are also some industrial and municipal activities (in the surrounding towns and villages such as Chikaji, Dakace and Sabon Gari areas) that produce myriads of wastes that ultimately get to the river either in the short- or long-run through run-offs and seepages. The few industries are located in Chikaji and Dakace. The main tributaries of the river in the sampling areas are all located in the Sabon Gari Local Government Area of Kaduna State (Figure 1).
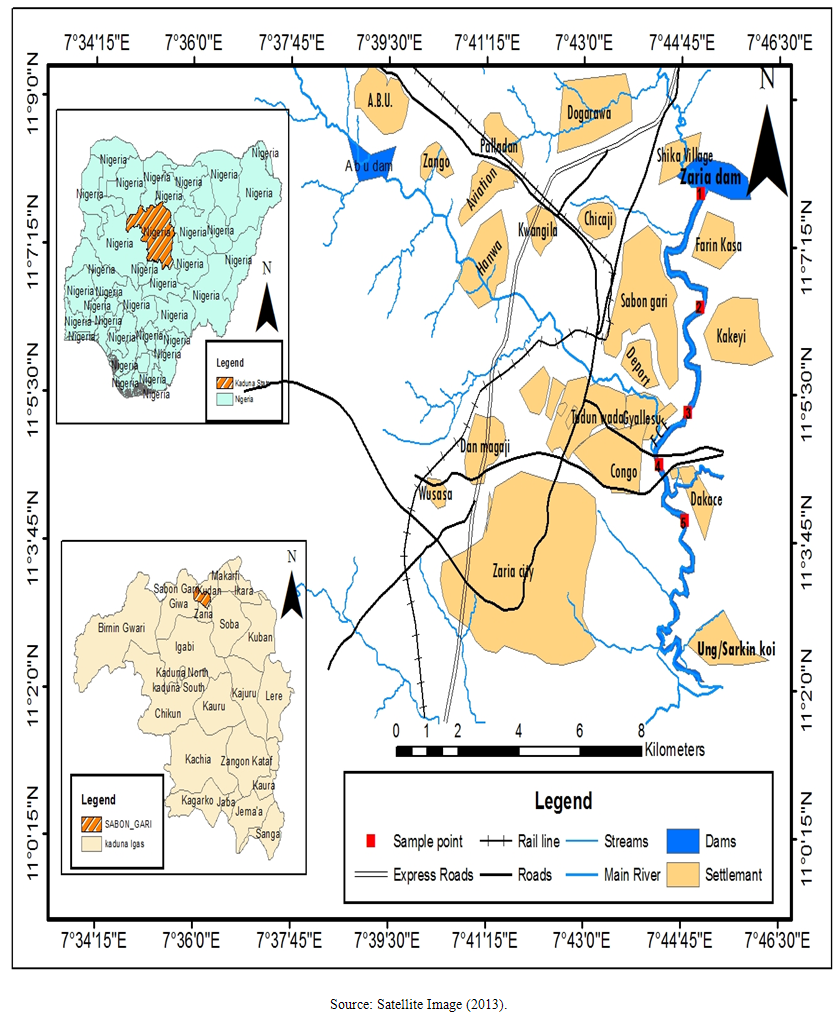 | Figure 1. Map of Zaria and its Environment Showing Study Areas |
3. Results and Discussions
- From ANOVA and DMRT analysis the results indicate no significant difference amongst the sampling locations. The dissolved oxygen ranged from 3.46±0.55mg/l (Kakeyi) to 4.74±0.35mg/l (Dakace).While the Biological Oxygen Demand ranged from 3.67±0.56mg/l (Kakeyi) to 4.28±0.27mg/l (Shika dam).The lowest mean value Total Hardness of water was recorded in FCEII with 72.67±21.27mg/l while the highest was found in Kakeyi with 115.67±29.35mg/l.Total Alkalinity mean values range from 30.75±2.94mg/l (Shika Dam) to 37.33±5.86mg/l (FCEII).The nitrate mean values ranged from 0.66±0.16mg/l (Dakace) to 0.74±0.19mg/l (Kakeyi).The sulphate values ranged from 0.12±0.03mg/l (FCEII) to 0.16±0.05mg/l (Shika dam). There was gradual decrease in sulphate levels from Shika dam to FCEII.The phosphate-phosphorus mean values ranged from 0.09±0.03mg/l (FCEI) to 0.15±0.05mg/l (Dakace).Total dissolved solid had the lowest value of 40.67±2.17ppm in Shika dam while the highest value of 67.33±11.35 ppm was obtained in Dakace.Electrical conductivity ranged from 82.33±4.5 µs/cm (Shika dam) to 134.17±23.08 µs/cm (Dakace).The pH values ranged from 7.94±0.26 (Kakeyi) to 8.63±0.47 (Shika dam).The temperature ranged from 22.00±1.90ºC (Dakace) to 22.67±1.98ºC (FCEII). (Table 1).
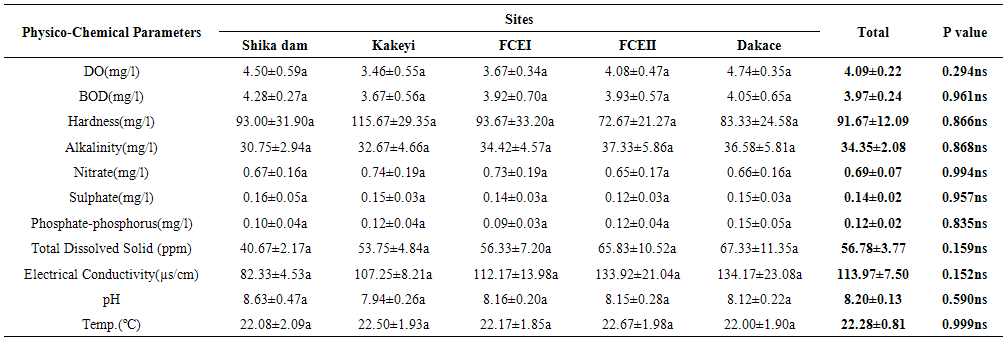 | Table 1. Comparison of the Physico-Chemical Parameters Sampling locations in River Galma |
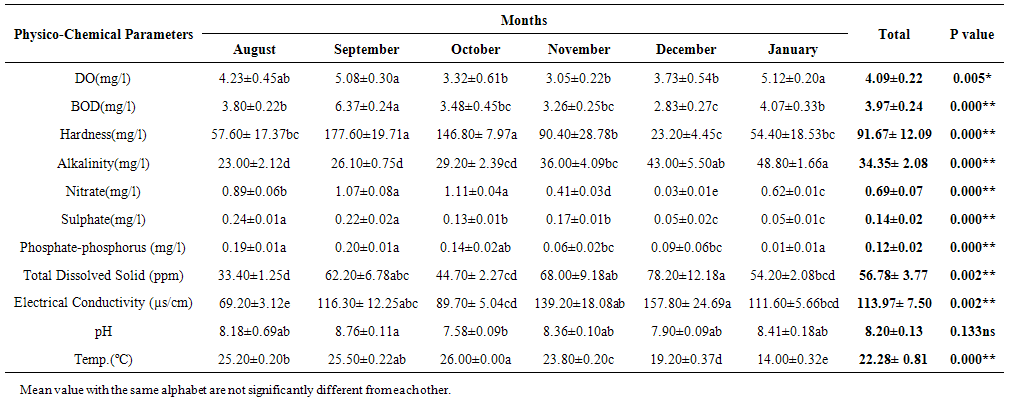 | Table 2. Comparison of the Physico-Chemical Parameters of Months of Sampling in River Galma |
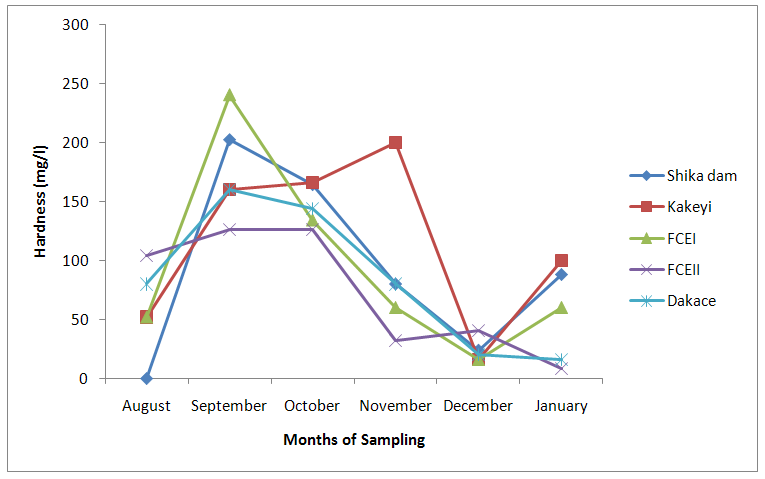 | Figure 2. Total Hardness values of water samples from River Galma amongst the sites and months of sampling |
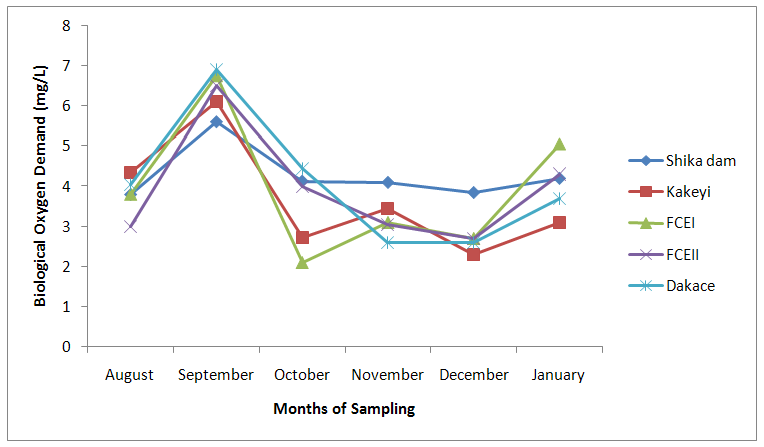 | Figure 3. Biological Oxygen Demand values of water samples from River Galma amongst the sites and months of sampling |
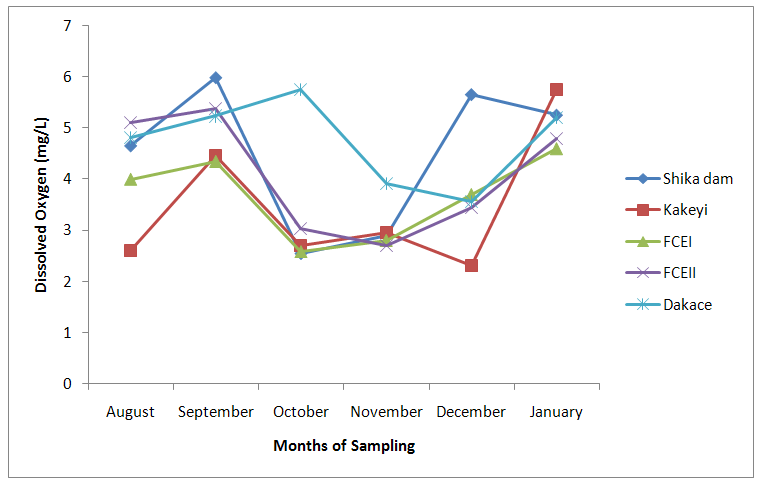 | Figure 4. Dissolved Oxygen values of water samples from River Galma amongst the sites and months of sampling |
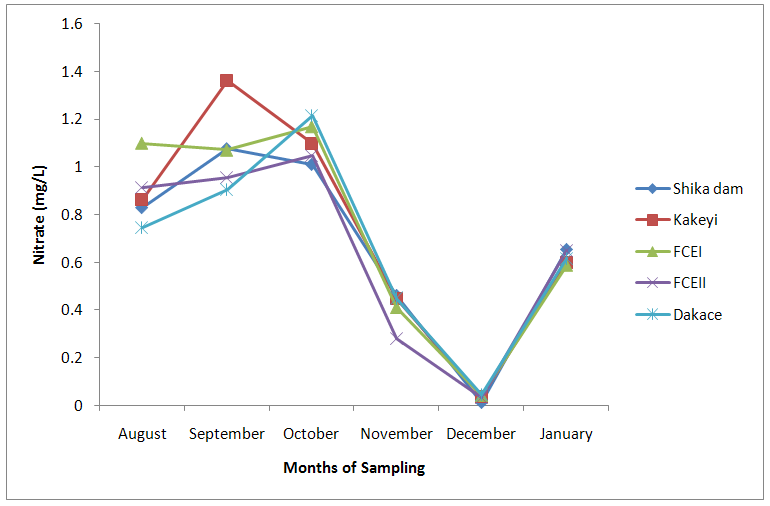 | Figure 5. Nitrate values of water samples from River Galma amongst the sites and months of sampling |
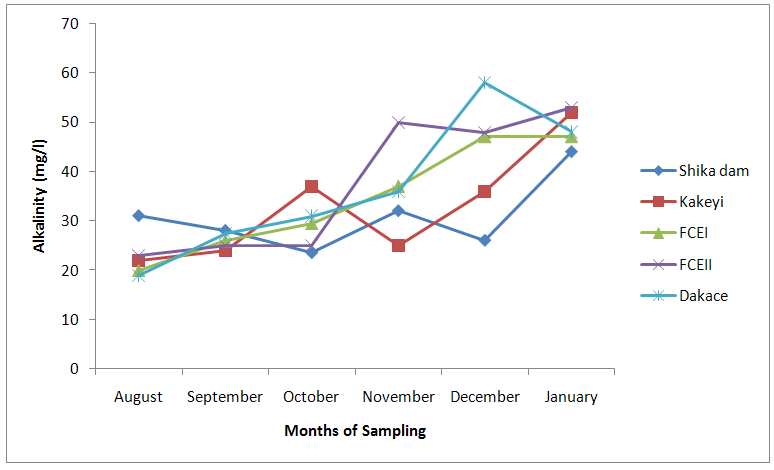 | Figure 6. Alkalinity values of water samples from River Galma amongst the sites and months of sampling |
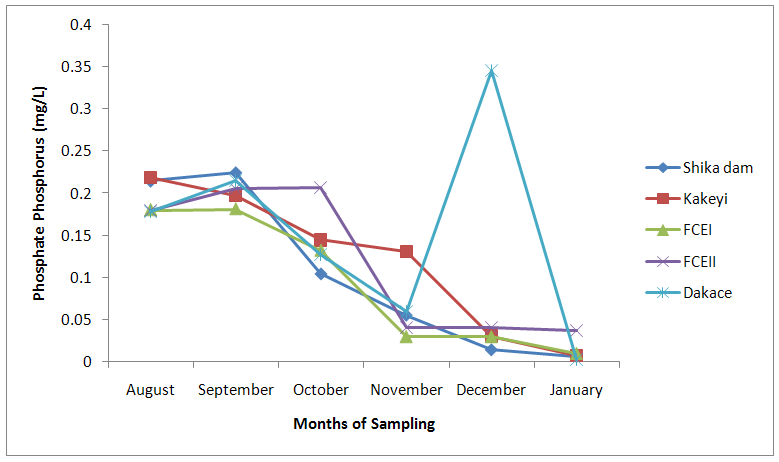 | Figure 7. Phosphate-phosphorus values of water samples from River Galma amongst the sites and months of sampling |
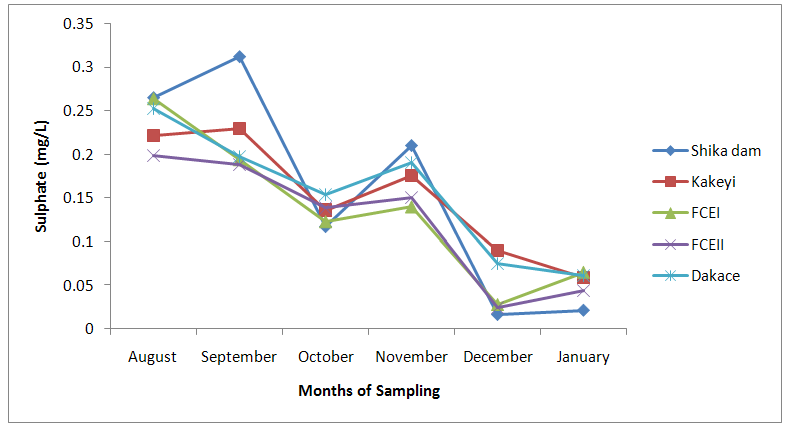 | Figure 8. Sulphate values of water samples from River Galma amongst the sites and months of sampling |
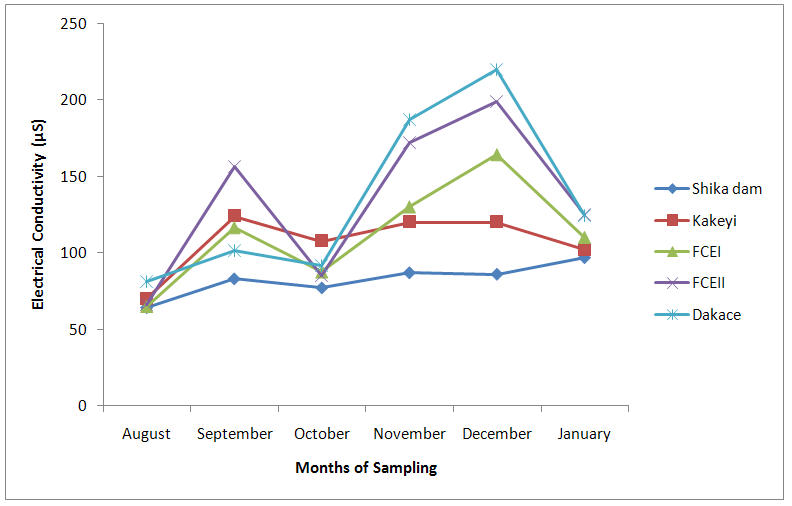 | Figure 9. Electrical Conductivity values of water samples from River Galma amongst the sites and months of sampling |
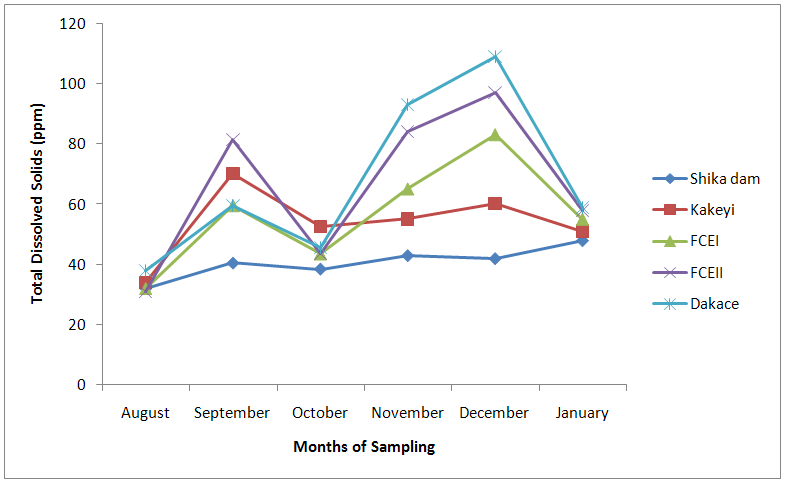 | Figure 10. Total Dissolved Solid values of water samples from River Galma amongst the sites and months of sampling |
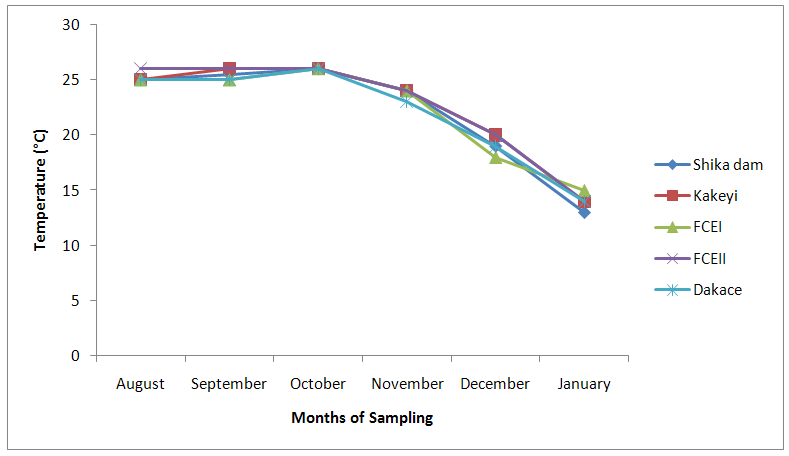 | Figure 11. Temperature values of water samples from River Galma amongst the sites and months of sampling |
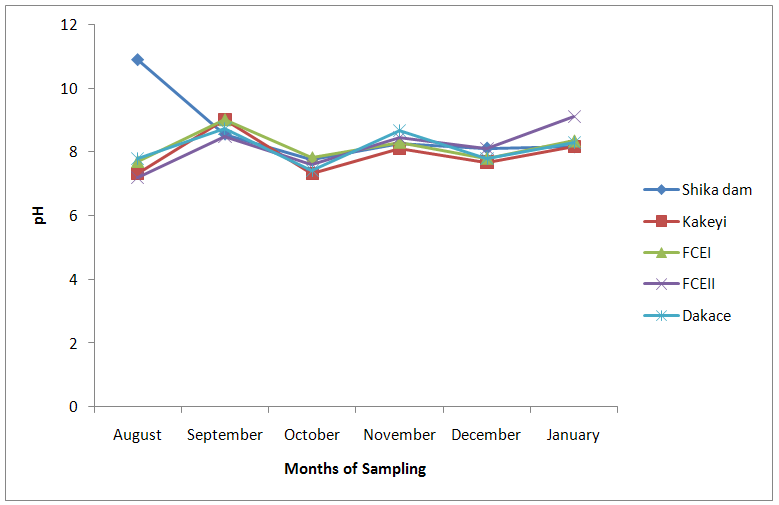 | Figure 12. pH values of water samples from River Galma amongst the sites and months of sampling |
4. Discussions
- The aquatic environment has undergone changes over the years due to discharge of pollutants into the environment which are either washed directly into the river body through run-off during rainfall or through seepages which get to the river body in the long-run. This constant loading of the river body can lead to serious changes in both physical and chemical constituents of the river and hence, pose a serious threat to the living biota within it. The high significance differences in biological oxygen demand, hardness, alkalinity, sulphate, nitrate, phosphate-phosphorus, total dissolved solids, electrical conductivity, temperature; and significance difference observed in dissolved oxygen with no significant difference in the pH of the sampling months may have been due to the presence of xenobiotics that have rendered the living organisms vulnerable. Slightly similar report was given by Adeyemi (2011) when he observed that the correlation matrix for physico-chemical parameters revealed that there was no significant difference between Temperature, pH and Conductivity with a significant difference between Temperature, TDS, pH and Conductivity in the three sampling points. Similar results were also obtained by Fadaeifard et al. (2012) when they observed significant differences in some water factors such as total hardness, total dissolved solid, total suspended solid, COD, BOD5, dissolved oxygen, phosphate, nitrite, nitrate and total ammonia between inlet and outlet water of fish farms where as there were no significant changes in pH, sodium chloride and water temperatures indicative of the effects of fish farm effluents on stream water quality. It is well known that these altered parameters of the river would have a toll on the aquatic biota of River Galma. For instance Imam and Balarabe (2012) showed how physicochemical fluctuations (in temperature, pH and TDS) had negative impact on the zooplankton species richness and abundance. Also, the water quality of rivers, streams and lakes changes with the seasons and this has profound influence on the population density of aquatic plants and animals (Lawson, 2011; Adeyemo et al., 2008).The lowest mean value of dissolved oxygen was obtained in Kakeyi (3.46±0.55). This may have been as a result of high municipal discharge from the neighbouring Sabon Gari town as various dump sites were observed during the period of the study. This site is probably the first major recipient of the anthropogenic influence and effect on the river body. The effect of waste discharge on a surface water source is largely determined by the oxygen balance of the system and its presence is essential in maintaining biological life within a system (DFID, 1999). Dissolved oxygen concentrations in unpolluted water normally range between 8 and 10 mg/L and concentrations below 5 mg/L adversely affect aquatic life (DFID, 1999; Rao, 2005). DO standard for drinking purpose is 6 mg/L whereas for sustaining fish and aquatic life is 4-5 mg/L (Rao, 2005). Judging from the results in comparison with these standards River Galma can be said to be polluted and therefore not fit for direct human consumption without treatment. However, the river may not pose serious threat to the survival of the aquatic biota and may be used for other domestic activities.The highest values of hardness of water obtained in Kakeyi, highest total alkalinity mean values in FCEII and highest nitrate values obtained in Kakeyi may amongst many other reasons (such as given above for Kakeyi site) as result of agricultural run-off from fertilizer and other agricultural applications which are washed off during rainfall into the river body. This may also explain why there were lower mean values of water hardness and nitrates in the month of December when the dry season has set in, in contrast to the highest mean values obtained in the months of October and September respectively because unpolluted natural waters usually contain only minute amounts of nitrate (Jaji et al., 2007). Also, while rainfall may dilute and weaken the effects of point source pollution, it also increases the contribution of non-point sources or diffuse pollution through land runoff from agricultural fields and leaches from refuse dumps (Jaji et al., 2007). Nitrate and phosphates normally give an indication of the nutrient level in the study area. Elevated concentration of phosphorus may result in fouling of natural water and production of toxic cyanobacteria (Omaka, 2007).While the gradual increase in the alkalinity mean values from August to January may be as a result of decrease in water level and increased concentration of chemicals (especially carbonates) within the water matrices. Alkalinity due to the presence of bicarbonate, carbonate and hydroxides of calcium, sodium and potassium (Murhekar, 2011; Lawson, 2011) is vital in neutralizing the acidity of water which increases with dissolved carbon dioxide (Lawson, 2011). Acceptable water hardness for drinking water - should not exceed 5 mmol/dm3 (500 mg CaCO3/dm3). Acceptable concentration of sulphates (VI) for drinking water is 200 mg/dm3. Acceptable limit for nitrogen concentration in surface and drinking water is 1.5 mg/dm3. Acceptable concentration of phosphates in surface waters is 0.2 mg/dm3. The values obtained in this study are within the acceptable limit. The mean values of electrical conductivity of the water were high during the dry season. This may have been as a result of increased water concentration due to low water level. Conductivity value obtained during the months of August, September, October could be attributed to dilution factor as a result of increased water volume from their main tributary channels and the main water stream. Ovie and Adeniji (1993) as well as Kolo and Oladimeji (2004) observed a similar trend for Shiroro lake. The FEPA acceptable limit for conductivity in domestic water supply is 70 μs/cm (DWAF, 1996a). The values obtained in this research are higher and above this limit which ranged from 82.33±4.5 µs/cm to 134.17±23.08 µs/cm. The pH value from this research is not significantly different and are within the accepted limits. According to WHO (2011), there is no health-based guideline value for pH, although 6.5 – 8.5 is proposed for drinking water. The pH of River Galma would not pose any negative effects on the inhabitant biota because most aquatic animals prefer a pH range of 6.5 - 8.0 which is slightly acidic and slightly alkaline. For instance, Lawson (2011) reported that aquatic shrimps and crabs require optimum pH range of 6.8 - 8.7 for maximum growth and reproduction. The water temperature obtained within the sampling period were from 14.00±0.32ºC (January) to 26.00±0.00°C (December). This may not pose any danger to the aquatic organisms. The cool harmattan wind experienced in January may have led to the low temperature which increased wave action. Temperature of the water is probably the most important environmental variable since it affects metabolic activities, growth, feeding, reproduction, distribution and migratory behaviours of aquatic organisms (Suski et al., 2006). Oniye et al. (2002) made similar observation for Zaria dam. Also, similar report was obtained by Ahamefula et al. (2014) when they observed that the air temperature ranged between 26.3 and 28.0°C while water temperature was between 28.3 and 31.0°C; and Conductivity, pH and salinity had values ranging from 23.4 to 31.7 mScm-1, 8.0 to 8.3, and 14.6‰ to 20.1‰ respectively.
5. Conclusions
- The physico -chemical parameters of River Galma varied widely with no significant differences in the sampling locations. However, there were high significance differences in biological oxygen demand, hardness, alkalinity, sulphate, nitrate, phosphate-phosphorus, total dissolved solids, electrical conductivity, and temperature of the sampling months with significance difference in dissolved oxygen. There was no significant difference in the pH value of the sampling months.With the exception of electrical conductivity the mean values of the physico-chemical parameters are within the acceptable limits. It can be used for domestic and other sundry uses; and good for aquatic survival and adaptability. River Galma is however, not fit for direct human consumption without treatment.
6. Recommendations
- The out-come of this research would serve as invaluable information to the relevant authority in mitigating the effects of xenobiotic on River Galma and avoid direct discharge of pollutants into the river.Routine monitoring of the river is required to ensure that these parameters are within the acceptable limits as the river is constantly put to different usages due to the ever growing anthropogenic influences.