-
Paper Information
- Paper Submission
-
Journal Information
- About This Journal
- Editorial Board
- Current Issue
- Archive
- Author Guidelines
- Contact Us
Resources and Environment
p-ISSN: 2163-2618 e-ISSN: 2163-2634
2015; 5(3): 73-89
doi:10.5923/j.re.20150503.01
Piosphere Syndrome and Rangeland Degradation in Karamoja Sub-region, Uganda
 Abstract
 Reference
 Full-Text PDF
 Full-text HTML
Egeru Anthony1, 2, Barasa Bernard3, Makuma-Massa Henry1, Nampala Paul1
1Regional Universities Forum for Capacity Building in Agriculture, Wandegeya, Kampala, Uganda
2Department of Environmental Management, Makerere University, Kampala, Uganda
3Makerere University, Geography Information Systems Center, Kampala, Uganda
Correspondence to: Egeru Anthony, Regional Universities Forum for Capacity Building in Agriculture, Wandegeya, Kampala, Uganda.
| Email: |  |
Copyright © 2015 Scientific & Academic Publishing. All Rights Reserved.
Uganda like most African countries is a vast mosaic of diverse and contrasting landscapes. Much of the country is characterized by an equatorial vegetation but with significant dryland areas mostly pronounced in northeastern sub-region of Karamoja. In this sub-region, the pastoral and agro-pastoral population is dependent artificial waterholes. In the locale of these waterholes, the livestock generate areas of altered soils and vegetation known as piospheres. However, since the introduction of these artificial waterholes, limited research has been undertaken to investigate their impact on rangeland degradation in the sub-region. In this study, soil chemical and physical properties were sampled at 0-15 cm and 15-30 cm depth, herbaceous and woody species were assessed and a series (1986, 2000, 2013 and 2015) of Landsat imagery were utilized. Standard laboratory procedures were utilized to analyze soil samples while herbaceous and woody species were summarized based on relative abundance. Dark Object Subtraction 1 atmospheric correction method was performed on all the imagery prior to classification. The Soil-Adjusted Vegetation Index (SAVI) was used to determine vegetation sensitivity to rangeland degradation. The extent of rangeland degradation from the waterholes was assessed by proximity analysis basing on distance intervals (0.1 km-15 km) from the waterhole. A high soil pH was observed closer to the waterholes, while nitrogen and phosphorus were lower. There was variation in abundance of herbaceous and woody species between the wet and dry seasons with a predominance of perennial hardy herbaceous species closer to the waterholes. Results also revealed that a pronounced inflection point has become established around the piospheres and is expanding outward to 1.5-2 km distance from the piosphere centre; indicating a development of clearer degradation pattern. The piospheric gradient (up to 15 km) has demonstrated pronounced landscape heterogeneity with the existence of potential interaction area between 6.5 and 9 km an area we have called a convergence zone of new higher impact. It is therefore imperative that strategic management of the waterholes is undertaken to stay the inflection zone from further expanding outward. This information generated is relevant to range and water managers in separating the impacts of localized degradation from landscape based rangeland health in Karamoja sub-region.
Keywords: Landscape, Heterogeneity, Pastoral, SAVI Karamoja-Uganda
Cite this paper: Egeru Anthony, Barasa Bernard, Makuma-Massa Henry, Nampala Paul, Piosphere Syndrome and Rangeland Degradation in Karamoja Sub-region, Uganda, Resources and Environment, Vol. 5 No. 3, 2015, pp. 73-89. doi: 10.5923/j.re.20150503.01.
Article Outline
1. Introduction
- Grazing pressure in arid and semi-arid rangelands is resource focus controlled with a radiating zone of attenuation of animal impact away from the concentrator such as water, mineral licks, and bedding grounds (Washington-Allen et al., 2004; Wesuls et al., 2012). This gradual attenuation in grazing pressure from the concentrator leads to a gradual change in vegetation cover, species composition, soil properties, and soil compaction away from the concentrator-resource focal point (Brooks et al., 2006). These systematic changes have been called piospheres; essentially indicative of disturbance gradients (Brooks et al., 2006; Rajabov, 2013). Differentiated impacts of piospheres have been observed on the grazing system with consequences on animals via detrimental modifications of their resource base including: a reduction in the density and production of forage, changes in the species composition of forage vegetation, bush encroachment and reduction in the nutrient content of their diet (Tolsma et al., 1987). In rangeland management, piospheres represent important rangeland health monitoring locations because they provide a locus for differentiating the medium to long-term effects of livestock activity on the rangeland from other environmental patterns (Todd, 2006). One of the eco-systems services that is under intense threat with regard to depletion is water; and as indicated in Nampala et al. (2015) climate change induced water vulnerabilities present the biggest challenge to farming and livelihood in dryland areas. The provision of water in many arid and semi-arid areas is a critical issue as water limits the survival and growth of livestock as well as the spatial and temporal dimensions of livestock movement and distribution (Shahriary et al., 2012). In Karamoja, piospheres are primarily of four types, mineral licks, the waterholes, bedding areas (kraals) and protected kraals (bedding areas intentionally created for provision of security to herders and their livestock). Introduced livestock waterholes in form of constructed dams and protected kraals are two key piosphere types that have ignited considerable influence on the rangelands in the region especially localized degradation (Mugerwa et al., 2014). Waterholes in Karamoja were introduced to address covariant risk of drought (both meso-shocks and macro-shocks that affect a specific group of households and shocks that affect all the households in the region, respectively), that intermittently dealt a blow to pastoralist livestock herds. Meanwhile, the protected kraals were introduced to address insecurity stemming from livestock rustling that from time to time was escalated by drought. Piosphere development in Karamoja was generally haphazard and driven by other interests and not based on the available evidence-base (Avery, 2014). It is the haphazard and rapid construction of the waterholes and protected kraals in the sub-region that in this article has been referred as piosphere syndrome. Since their construction was hastily undertaken with minimum consideration to other ecological resources such as forage resources and the traditional grazing calendar; their ecological impacts on the rangeland conditions remain scanty. According to Mugerwa et al. (2014) and Egeru et al. (2014a) there is evidence of localized degradation around the piospheres in the sub-region but, how far this degradation goes beyond the ‘sacrifice zone’ (an area of maximum impact); and the rate and magnitude of this degradation through the utilisation gradient remains unclear. Fostering management and re-evaluation of water resources development particularly the siting of waterholes as well as designs of the waterholes requires evidence based information. Consequently, rangeland health monitoring becomes handy because it fosters evaluation of the effectiveness of the management decisions and approaches in use at the landscape level. Further, it allows land users to detect early signs of rangeland degradation before the land becomes more degraded and also shows stakeholders (development partners, community members, etc.) that rangeland health is changing (Riginos and Herrick, 2010). In heterogeneous landscapes such as Karamoja (Egeru et al., 2014a; b), relying principally on the understanding of the piosphere grid to arrive at management may be contentious because heterogeneity often disrupts the piosphere patterns. A composite understanding of both water supplementation and heterogeneity, the influence of a range of environmental and management variables on degradation and species composition is required to form a basis for appropriate management practices (Owen-Smith, 1996). In many occasions, the discussion on piosphere impacts on rangeland degradation has been based on a homogeneity understanding (e.g. Andrew, 1988; James et al., 1999; Thrash and Derry, 1999). However, there has been an increased appreciation that semi-arid rangelands are heterogeneous (Pickett et al., 2003). Thus, a suit of indicators are now being considered when piosphere analysis is being undertaken including among others: soil chemical gradients (Whitford, et al., 1998); invader and exotic plant species (Shahriary et al., 2012); perennial vegetation patches and fetch lengths (Ludwig et al., 2000); and ecological index (Teka et al., 2013) among others. Vegetation indices that are remotely sensed (Van Niel, 2000) and landscape metrics (Washington-Allen, 2003; Sasaki et al., 2008) are some of the additional indicators increasingly being explored. Vegetation indices represent piospheric response as a sigmoidal response function that is accompanied by four diagnostic characteristics (i.e. development of permanent grazing gradient in the area directly surrounding the resource patch, a decrease of wet period response toward dry period, a decrease of dry period response toward plant extinction, and an increase in distance either at the inflection point or asymptote away from the resource patch) for which a persistency in their trend indicates a degradation (Washington-Allen et al., 2004). This study utilized three categories of indicators; soil parameters, plant species composition and vegetation indices and landscape metrics (algorithms that quantify specific spatial characteristic of patches) to achieve two objectives namely: to assess the rate and magnitude of rangeland degradation from the sacrifice zone through the utilization gradient and quantify the composition and spatial configuration of landscapes around the piospheres of Karamoja sub-region.
2. Materials and Methods
2.1. Description of Study Area
- Karamoja sub-region is located in northeastern part of Uganda covering a land area of 27, 200 Km2 approximately 11.3% of Uganda’s land surface (Figure 1). It is as semi-arid region with high temperatures, evapotranspiration and variable rainfall (Avery, 2014; Egeru et al., 2014a). Rainfall in the region ranges between 500-1000 mm with some highland areas such as Mt. Moroto, Mt. Kadam and Mt. Iriiri receiving above 1000 mm of rainfall per annum (Mubiru, 2010; Anderson and Robinson, 2009). Geologically, the sub-region is underlained by a pre-Cambrian complex system with isolated residual hills such as Toror in Kotido district, Morungole in Napaka among others. The sub-region generally rises from the east to the west (Figure 1) with most of the rivers such as Dopeth, Okere, and Lomanimana flowing west wards. Karamoja is dominated by a savanna vegetation system characterised by acacia tree species with a mix of combretum (Obua et al., 2006; Aleper et al., 2008; Egeru et al., 2014b). The sub-region has three livelihood zones that have mainly developed along the rainfall gradient in the sub-region; these include the pastoral zone found in the drier eastern part of the region, agro-pastoral zone in the moderately wet areas in the central to southern plains and the cropping systems zone mainly in the western parts of the sub-region. Thus, pastoralism and agro-pastoralism form the mainstay of livelihood in the region. Livestock water sources are generally disproportionately distributed in the sub-region with Moroto district presenting a concentration of dams close to one another (Mugerwa et al., 2014; also see Figure 1).
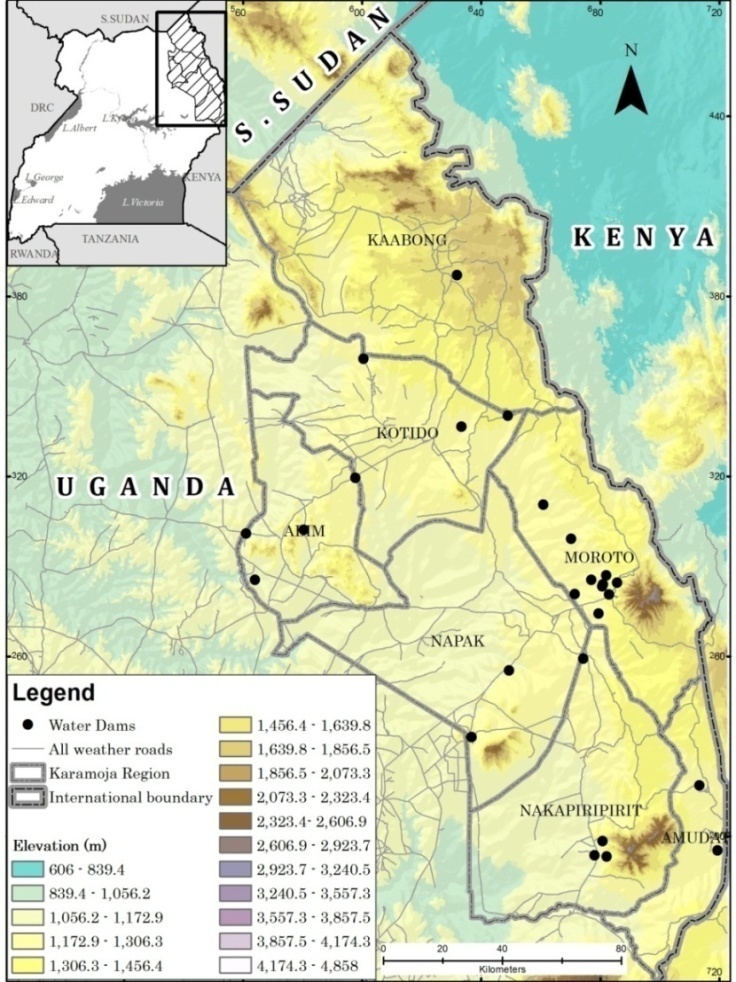 | Figure 1. Location of Karamoja sub-region. The major piospheres have been indicated with the back dots as water dams |
2.2. Soil Sampling and Plant Species Identification
- Composite soil samples for chemical properties analysis were obtained at two depths 0-15 cm and 15-30 cm. Nine piospheres (waterholes and water dams synonymously used in this study) were sampled in the three districts of Kotido, Moroto and Napak for a period of three seasons from 2013 to 2014. These three seasons represented the dry, wet and transitionary season. The transitionary season was identified as that period between the wet season and dry season; it is indicative of a period (September-November) when the pastoralist herders begin preparations to move their livestock from the wet season grazing areas to dry season grazing areas. In addition, using a 5 cm soil core, intact soil core samples were obtained at 0-30 cm for soil physical properties analysis. Further, in each piosphere, plant species identification was similarly conducted using a transect approach to the north, east, west and south direction for a distance of 200 meters. Counts of herbaceous and woody cover species were recorded from 1x1 m and 5 x 5 quadrats, respectively after every 50 meters.
2.3. Rangeland Health Assessment
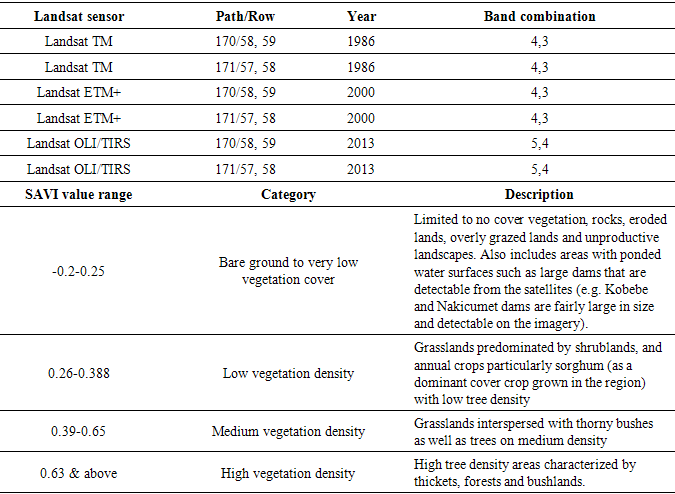
- The study utilized a series of Landsat imagery (30m spatial resolution) for 1986, 2000, 2013 and 2015 (Table 1) to quantitatively characterize the multi-temporal and spatial vegetation patterns in the study region. The single date images were atmospherically corrected using the Dark Object Subtraction 1 atmospheric correction method prior to classification. In order to determine vegetation sensitivity to rangeland degradation, the Soil-Adjusted Vegetation Index (SAVI) was adopted. The SAVI was developed in order to minimize the soil brightness from the spectral vegetation indices associated with semi-arid areas (Huete, 1988). The Near-infrared and Red bands were used in the computation of the SAVI index described as described by Huete (1988). The SAVI rangeland vegetation categories were specified as in Table 1. Proximate analysis based on distance intervals from 100 meters to 15000 meters (15 km) from the water dams was used to determine the extent of rangeland degradation. An ArcGIS based multiple ring buffer tool was used to determine the distances. A zonal statistical tool was used to extract the mean SAVI values for each buffer ring across the landscape. Distance intervals were specified basing on field experience observations and secondary data.
|
2.4. Data Analysis
- Soil samples were analyzed for soil chemical and physical properties (N, P, K, Mg, Na, Ca, and pH), soil organic matter and physical properties (saturated hydraulic conductivity and bulk density). The structure of soil was assessed using the dry sieving technique and the results expressed as Mean Weight Diameter (MWD) of the aggregates. The samples were passed through a 10 mm sieve, thereafter passed through a nest of concentric rings of progressively declining sieve sizes; 6.36, 4.75, 2.36, 1.18, 0.425 and 0.212 mm. A vibratory sieve shaker-FRITSCH analyzette 3E was set at amplitude 5 for 30 minutes during the processing of soil aggregates. The constant head approach was utilised to analyse saturated hydraulic conductivity. In this approach, a constant head of water is maintained a top a soil core. Records of amount of water flowing through the soil core were taken after every 5 minutes for 15 minutes and the depth of the ponded water in the reservoir was thereafter computed. Using the Walkley-Black method as described by Okalebo et al. (2002) soil organic matter (SOM) was determined. In addition, all the chemical soil properties were processed following the procedures described by Okalebo et al. (2002). Soil chemical and physical properties data was thereafter descriptively analyzed and compared with predetermined thresholds specified by Okalebo et al. (1993).Rangeland degradation assessment at the piospheres was determined using a series of Landsat imagery. As already indicated above, the Dark Object Subtraction 1 atmospheric correction method was performed on all the images prior to classification. The SAVI was adopted to determine vegetation sensitivity to rangeland degradation. The extent of rangeland degradation from the waterholes (water dams and waterholes are synonymously used in this study) was assessed by proximity analysis basing on distance intervals (0.1 km-15 km) from the waterhole (Figure 2). An ArcGIS based multiple ring buffer tool was used to determine the distances with extraction based on concentric rings radiating outward from the waterhole up to a maximum distance of 15 km (Figure 2). A zonal statistical tool was used to extract the mean SAVI values for each buffer ring across the landscape. The distance intervals were selected basing on field work observations and secondary data. The SAVI rangeland vegetation categories were as reflected in Table 1.
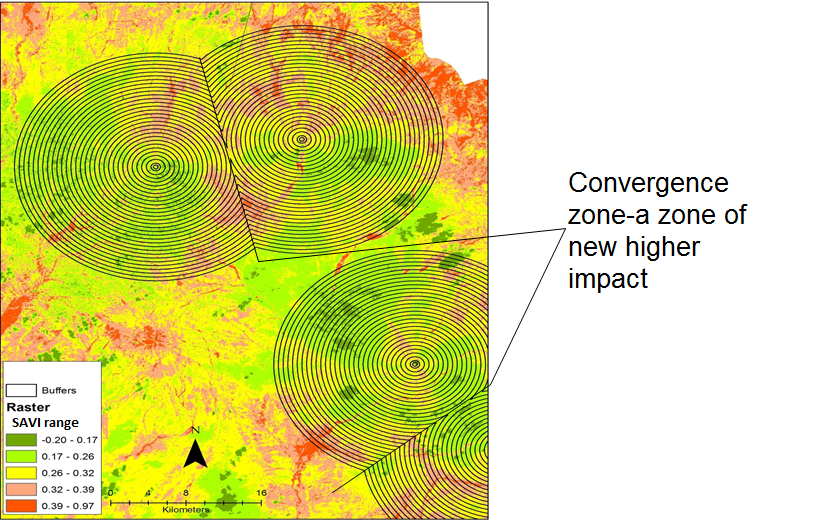 | Figure 2. SAVI composite Landsat image with extraction buffers |
3. Results
3.1. Piosphere Soil Characteristics
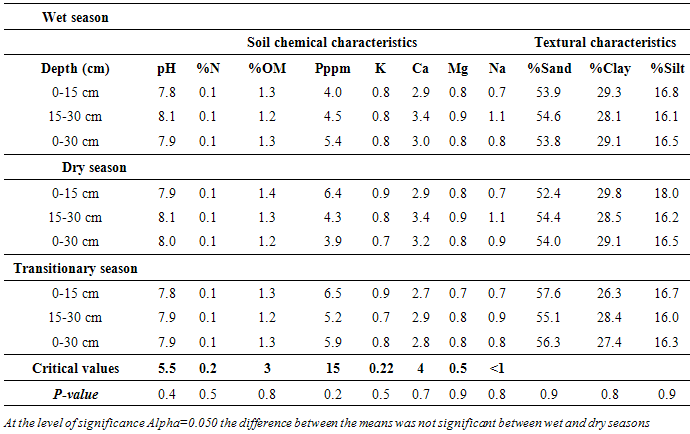
- In both seasons and depths, soil pH was generally high (7.8-8.1). On average, at both depths and seasons, Phosphorus (P) was lower than the critical value. This similarly applied to Calcium (Ca), Magenssium (Mg), percent nitrogen (% N), soil organic matter (% OM). However, Potassium (K) and Sodium (Na) were higher than the critical values at both depths and seasons (Table 2). The hydraulic conductivity (Ksat) at the piospheres was within the slow classification class in both seasons. On average, bulk density was 1.3 g/cm3; this falls within the classification class of surface mineral soils, not recently cultivated, but not compacted. In terms of field capacity, the wet season had a slightly higher field capacity volume percent of 32.1±3.4 compared to the dry season at 27.9±0.3 percent. Meanwhile, wilting point percent was observed at 16.5±3.9 and 17.5±0.0 during the wet and dry seasons, respectively.
|
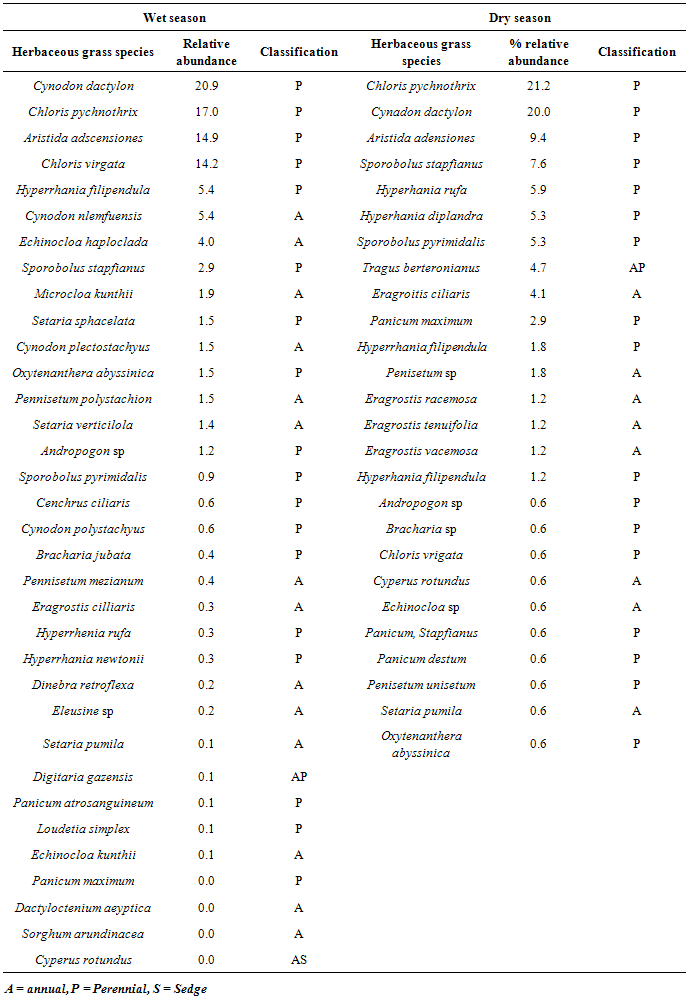
3.2. Herbaceous and Woody Species Patterns
- Thirty four grass species were observed during the wet season compared to twenty six recorded in the dry season. In both seasons hardy perennial grasses including among others; Cynodon dactylon, Chloris pychnothrix, Aristida adsceniones, Hyperrhania filipendula, Hyperrhania rufa, Hyperrhania diplandra and Sporobolus pyrimidalis dominated (Table 3). Annual grasses were more pronounced during the wet season compared to the dry season but with generally low relative abundance within the piospheres area. All the herbaceous grasses recorded at the piospheres provided forage to livestock (cattle, sheep, goats, and donkeys) On the other hand, annual plants were observed with a high relative abundance in the woody, herbs and forbs category during the wet season (Table 4). Four of the five plant species with under the woody, herbs and forbs category were not useable as forage for livestock during the wet season and they were annuals. However, during the dry season all the five plants with a higher relative abundance around the piospheres could be browsed on by livestock. These plants included among others: Acacia kirkii, Maerua pseudopetalosa, Ocimum canum, Solanum incanum, and Acacia drepanolobium (Table 5).
|
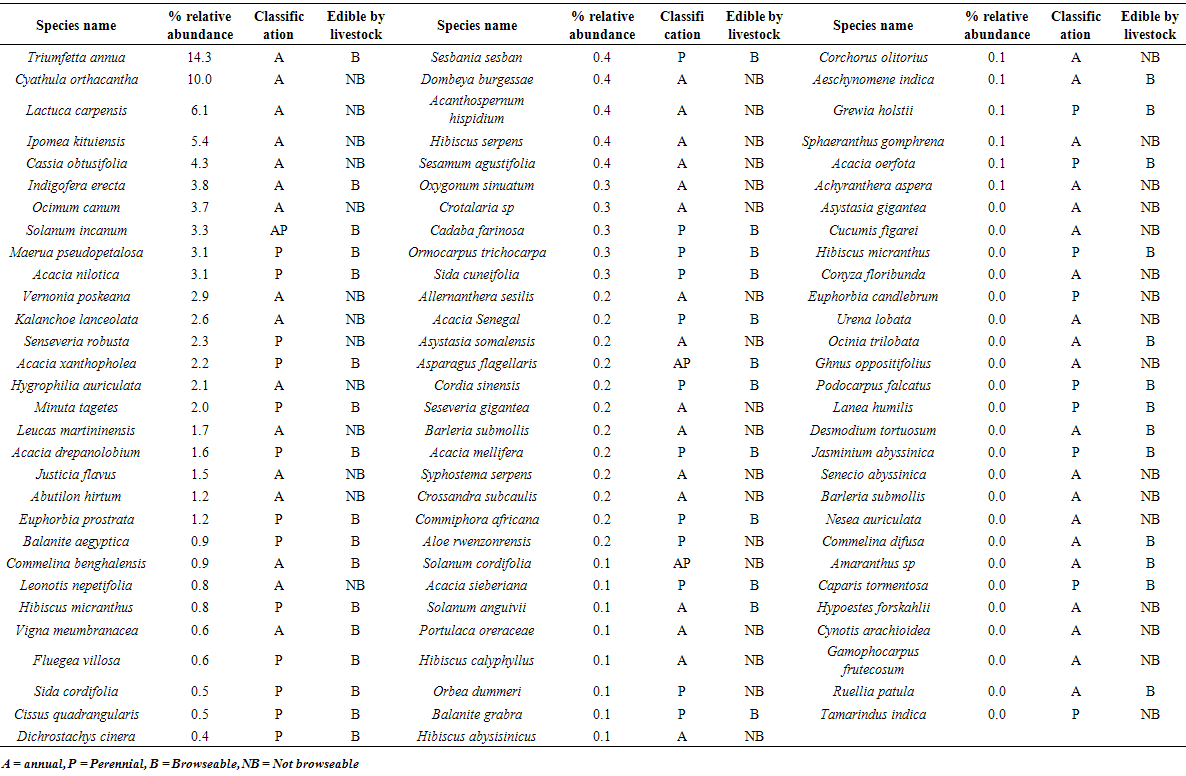 | Table 4. Woody, herbs and forbs species at the waterholes piospheres during the wet season in Karamoja |
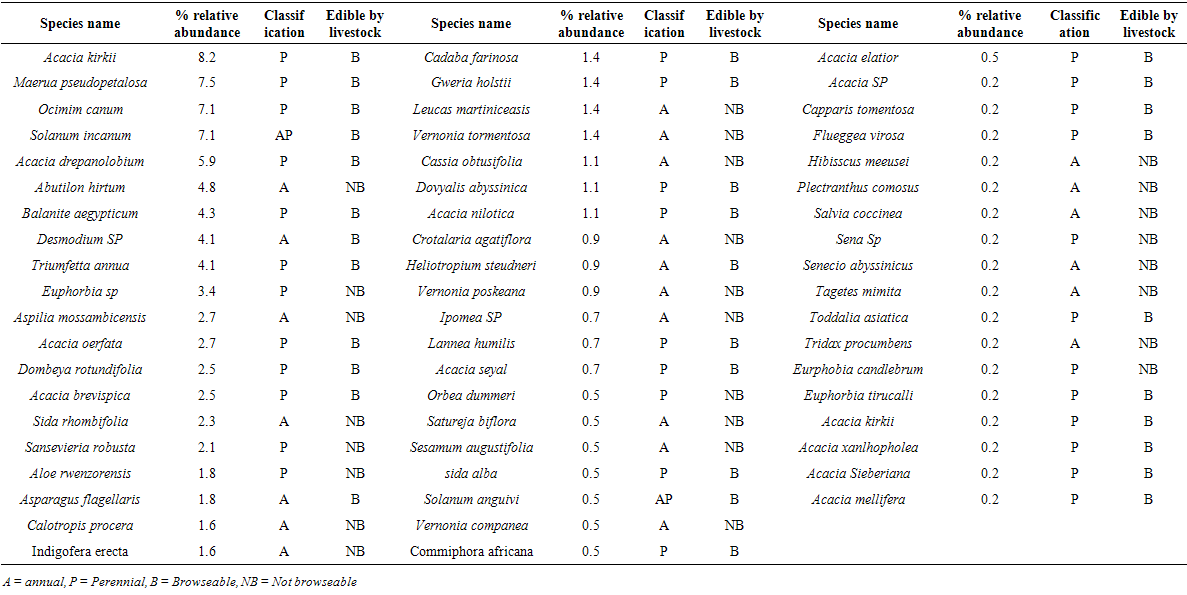 | Table 5. Woody, herbs and forbs species at the waterholes piospheres during the dry season in Karamoja |
3.3. Rangel and Health along the Grazing Gradient
- Rangeland health along the piosphere gradient showed variation across space and time from the waterhole (piosphere) through the 15 km distance of analysis. During the dry season in 1986 vegetation index depicted a complex gradient with two major patterns observed. Firstly, higher vegetation index (indicative of better health) from 1-6 km distance and, secondly, a decline in vegetation index from around 6.5-10 km before gradually rising. A fit using the polynomial line indicated this complex gradient pattern was significant, R2 = 0.7 (Figure 3a). In 2000, the wet season vegetation index depicted a composite gradient while the dry season vegetation index depicted a complex gradient with a significant polynomial trend (R2 = 0.6525; 0.652 Figure 3b and 3c, respectively). Further, the pattern depicted (after the introduction of most of the waterhole piospheres) that there was relatively low vegetation health closer to the waterhole, picking slightly before gradually declining from 1-5.5 km. From 6 km distance, the vegetation health rapidly improved peaking at 7.5 km and later gradually declining up to 11.5 km distance (Figure 3c). The wet season vegetation health of 2000 presented converse perspective to that of the dry season. There was a relatively better health from 0.5 km rising with a declining pattern to a lower level at 6.5 km but picking up gradually outward with improving health towards the 15 km radius from the waterhole piosphere (Figure 3b). The 2013 vegetation index presented complex piosphere gradient with sudden rise in vegetation index immediately around the piosphere during the wet season and a slight extension of vegetation index increase to after 1 km during the dry season. This indicates the role play by annual vegetation flush around the piospheres (R2 = 0.525; 0.771 Figures 3d and 3e, respectively). Meanwhile, in the dry season of 2015, a composite vegetation index was observed with a significant polynomial fit. However, the pattern of vegetation performance showed variability along the gradient with peak performance observed around 4-5.5 km from the waterhole. There was a decrease shortly thereafter with a fluctuating rise below the peak level (Figure 3f). In terms of the sub-regional perspective, the vegetation health in the sub-region has gradually been improving since the baseline period (1986) (see Figures 4a-4f).
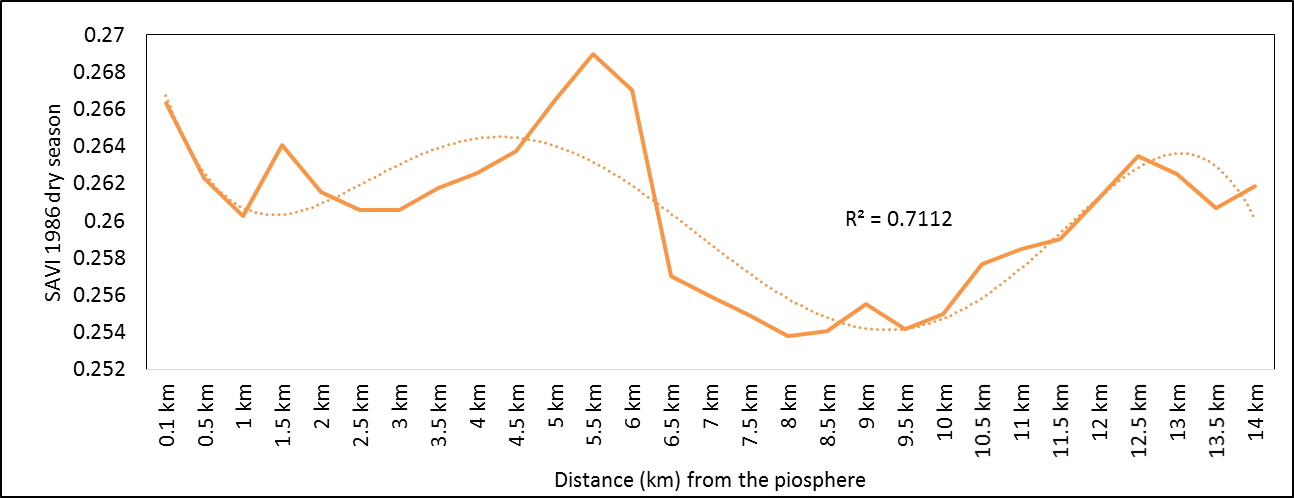 | Figure 3a. 1986 dry season vegetation health along piosphere gradient |
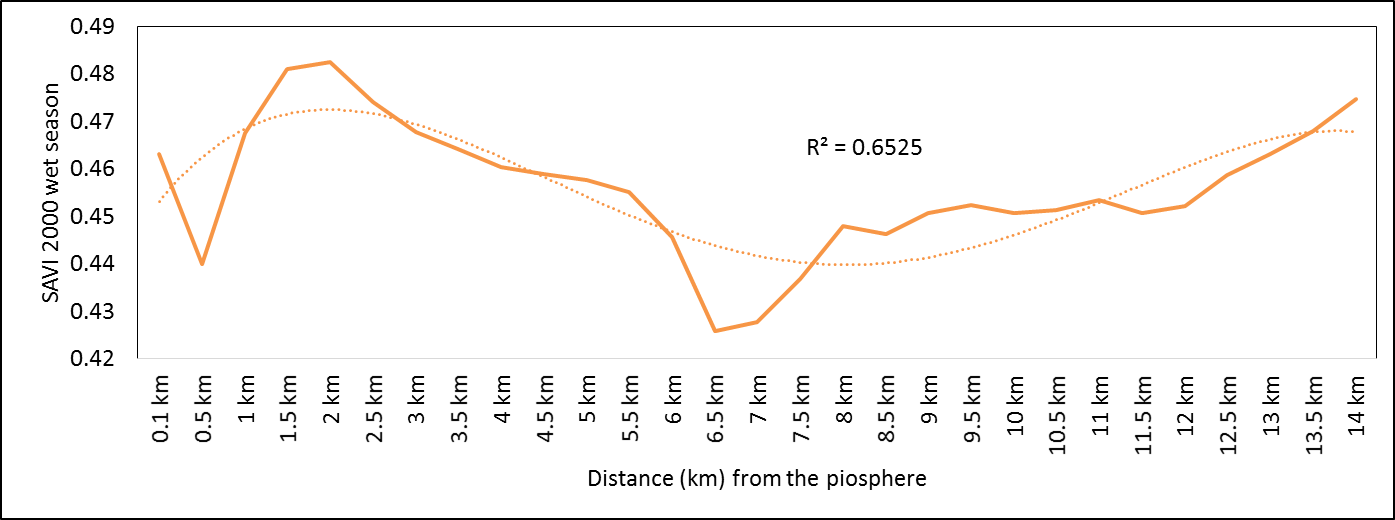 | Figure 3b. 2000 wet season vegetation health along a piosphere gradient |
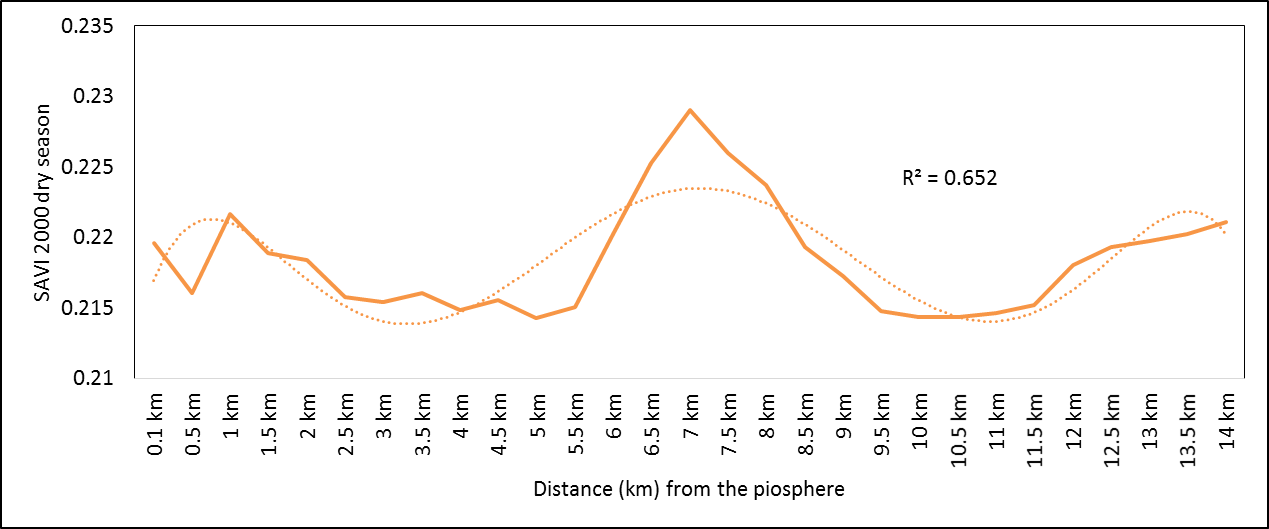 | Figure 3c. 2000 dry season vegetation health along piosphere gradient |
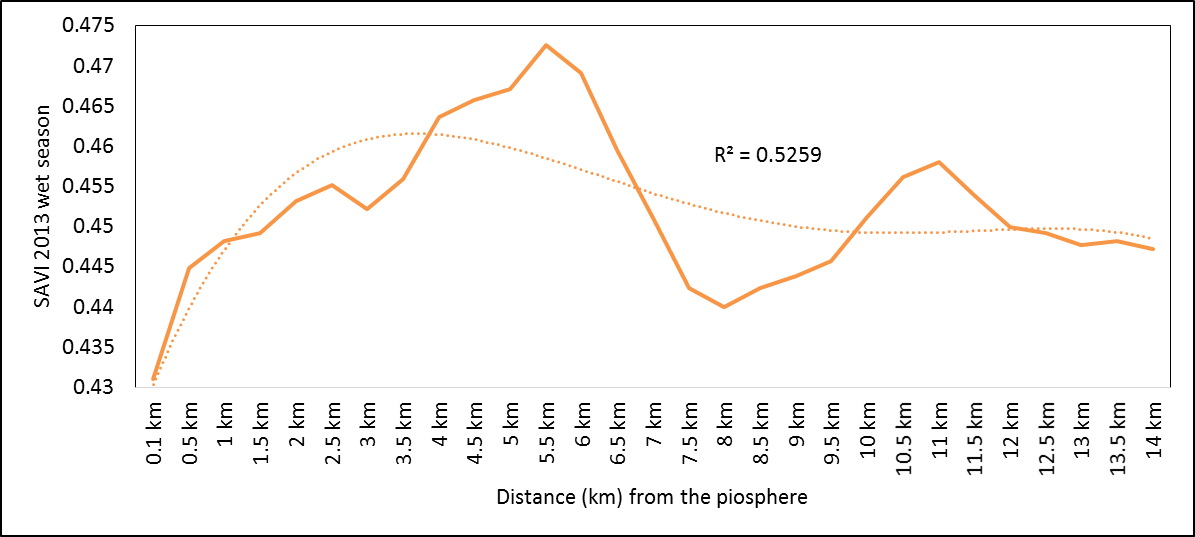 | Figure 3d. 2013 wet season vegetation health along the piosphere gradient |
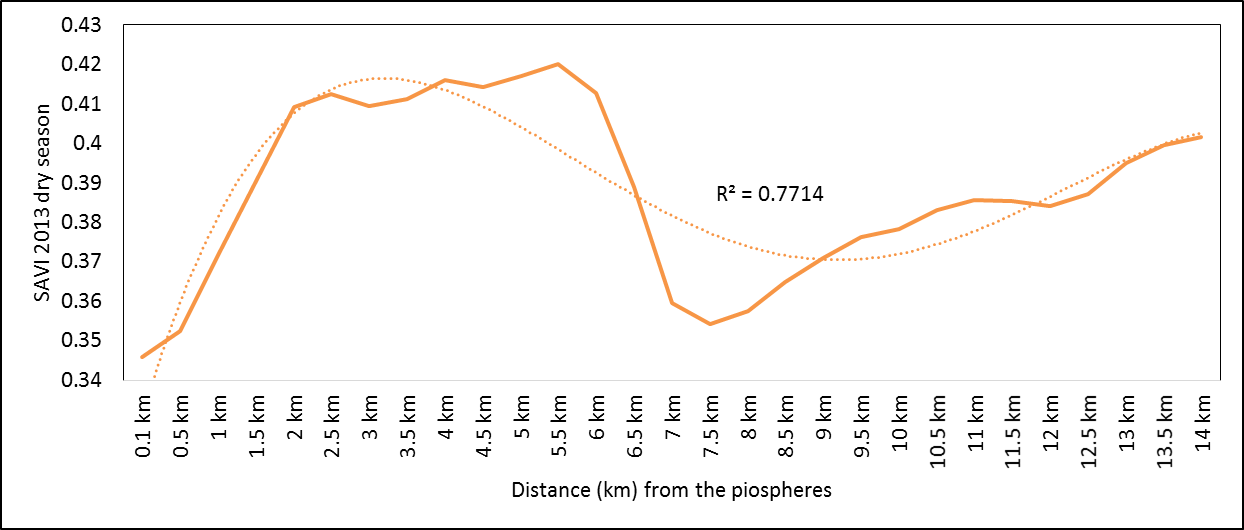 | Figure 3e. 2013 dry season vegetation health along the piosphere gradient |
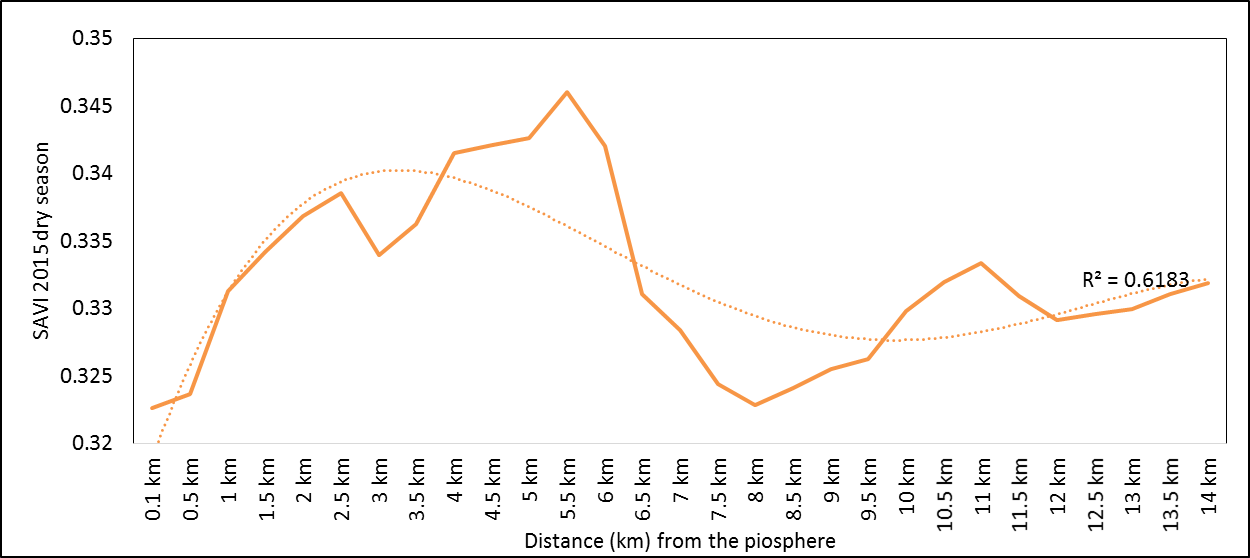 | Figure 3f. 2015 dry season vegetation health along the piosphere gradient |
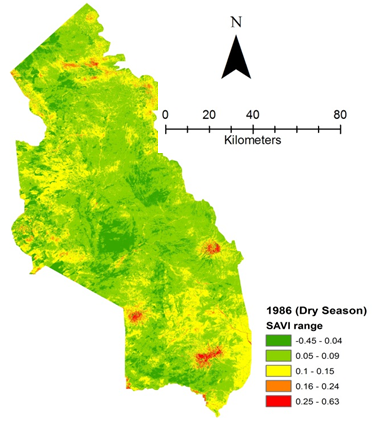 | Figure 4a. Vegetation health 1986 dry season |
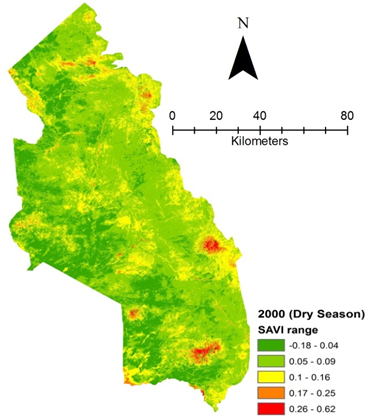 | Figure 4b. Vegetation health 2000 dry season |
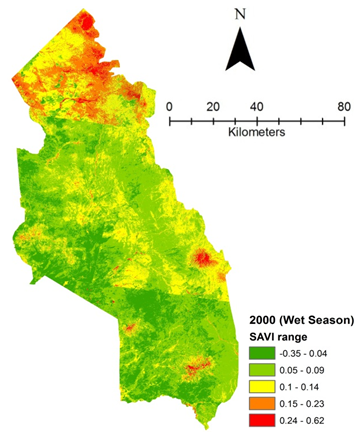 | Figure 4c. Vegetation health 2000 wet season |
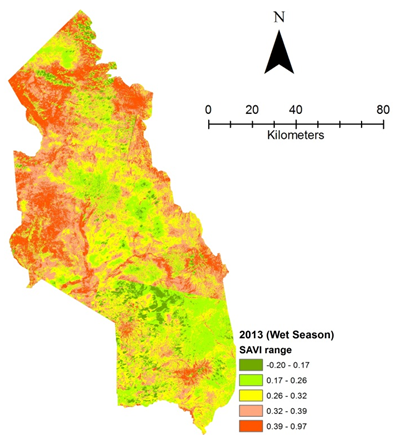 | Figure 4d. Vegetation health 2013 wet season |
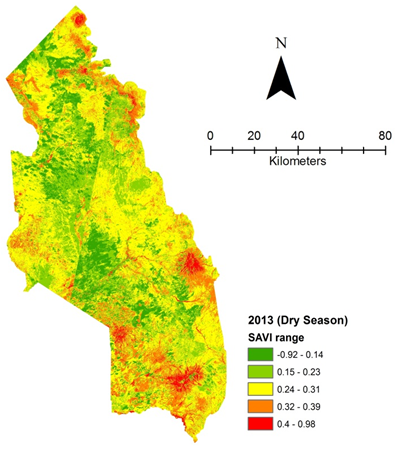 | Figure 4e. Vegetation health 2013 dry season |
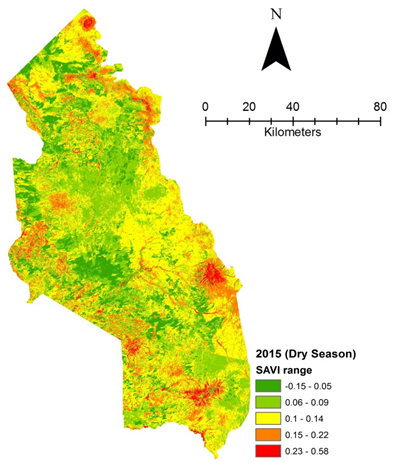 | Figure 4f. Vegetation health 2015 dry season |
3.4. Composition and Spatial Configuration of Piospheres
- Landscape metrics depicting composition and spatial configuration of landscapes around the piospheres were analyzed. Shannon’s Diversity Index (SDI) revealed an increasing trend in diversity indices indicating that the landscape around the piospheres was increasingly becoming heterogeneous (Figure 5a). The area-weighted mean patch fractal dimension (AWMPFD) showed that high disturbance in the landscape in 1986. Between 1986 and 2000, there had been adjustment in disturbance. However, between 2000 (following the introduction of the piospheres in the landscape) and 2013 to the present (2015); there has been a return in disturbance in the landscape around the piospheres leading to a declining AWMPFD index (Figure 5b).
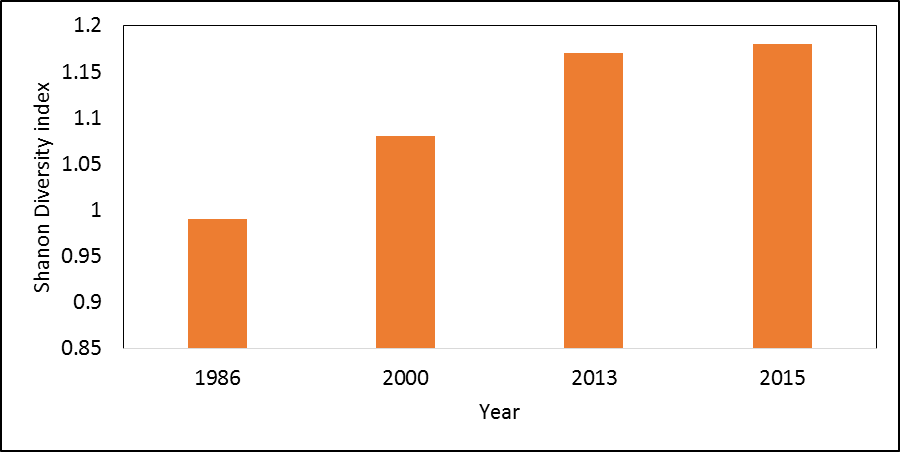 | Figure 5a. Shanon’s Diversity Index around the piospheres (15 km distance) 1986-2015 |
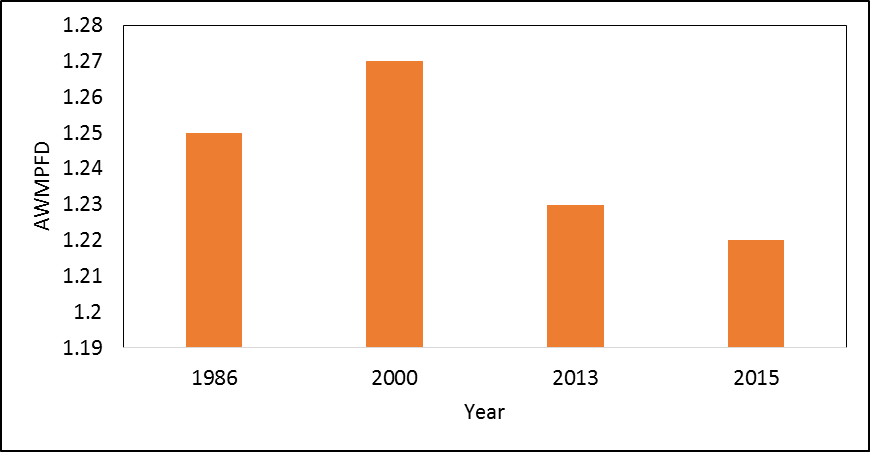 | Figure 5b. AWMPFD around the piospheres (up to 15 km) 1986-2015 |
4. Discussion
4.1. Status of Soil at the Piospheres
- Soil chemical and physical properties are important indicators of rangeland health. Compared to the critical values identified by Okalebo et al. [31] soil chemical and physical properties at the piospheres reveal a less than and above than patterns. This study has observed high soil pH closer to the watering points. This high soil pH could be attributed to continuous grazing. According to Beukes and Ellis [35] continuously grazed soils tend to have a higher pH than moderately/ungrazed areas. This arising from decreased infiltration caused by compaction closer to the watering points that limits loss of nutrients through leaching; leading to the accumulation of ions of mineral nutrients such as calcium and sodium near the surface layers. This study has also shown that hydraulic conductivity in the slow infiltration category; this could be attributed to the trampling effect leading to compaction of the soil surface layers. This is because treading by livestock often tends to reduce soil porosity and increasing bulk density whilst reducing the proportion of larger pores that play an important role in water movement, nutrient availability and aeration [36, 37]. Compared to other studies [38] that found a concentration of nitrogen, potassium and phosphorus closer to the watering piospheres, this study’s results were to the contrary with the exception of potassium. This could be attributed to the limited residence time spent by the animals at the watering points, as watering is managed through alternation to minimise conflicts. Secondly, it could be a result of the fact that most of the waterholes have not been in existence for a long time as such the accumulative effect of nutrient deposition by animals is not yet realizable. The relatively high potassium could be attributed to seasonal burning that is implemented for bush clearance and from wild fires that often ravage the sub-region depositing ash content. This regular burning is however, responsible for limited availability of soil organic matter around the piospheres as it makes the area devoid of decomposable material.
4.2. Herbaceous and Woody Vegetation Composition and Abundance at the Piospheres
- Relative shifts in herbaceous grass species between the dry and wet seasons were observed in this study. Alternating states in herbaceous cover between the dry and wet seasons in semi-arid areas is not an unusual experience; these have been observed in semi-arid areas of Namibia as well as within Karamoja sub-region [39-41]. Further, hardy perennial herbaceous species were observed to predominate at the piospheres during both the wet and dry seasons. This pattern presents two scenarios; firstly; it is indicative of the presence of forage across the season; and secondly, it is indicative of high grazing pressure around the piosphere zones. The predominance of perennial grasses around the piospheres in the region could be attributed to their self-seeding ability, drought tolerance, as well as their potential to establish and spread quickly to forming good cover [42]. This study like in other studies elsewhere [43-45] has shown Chloris, Hyperrhania, Aristida and Sporobolus as some of the dominant perennial grasses in semi-arid areas of East Africa. The presence of perennial grasses in the grazing landscape around the piospheres assures livestock of forage. However their palatability and nutritive value is generally higher compared to that of many annual grasses. Further, some of the species such as Sporobolus observed around the piosphere gradient fall under the increaser II grass ecological category; indicating that such landscapes have experienced heavy grazing effect[46].
4.3. Rate and Magnitude of Degradation from the Sacrifice Zone through the Utilisation Gradient
- Using both the concentrator (waterholes/water dams) and response index (remotely sensed vegetation index) this study has been able to reveal varied rangeland health along the piospheric gradient in Karamoja sub-region. We have been able to detect the development of the piospheric effect from the sacrifice zone outward when the series of vegetation indices from1986 (base year) to 2015 are compared; particularly a gradual expansion of the inflection point. In 1986, the vegetation response index close to the 0.1 km start point revealed a high index before slight a drop; this is proof that during this time, the current piospheres were not in existence as such there was non-interference arising from the concentrator. Later on (2000 onwards), this pattern changed after the introduction of the piospheres such that a distinct pattern began with a lower vegetation health (index) observed nearest to the concentrator. This finding corroborates the findings of Washington-Allen et al. [23] in which a persistent degradation was found closest to the water sources. It is also within the expected result outcome in which the stocking and grazing pressure are anticipated to build closest to the centre and least at the furthest distance from the concentrator (waterhole) [47]. Whereas between 2000 and 2015, there has been a persistence of low vegetation index response closet to the centre leading to a more identifiable inflection point between 0.1 to 1.5 km); potentially indicating degradation, much of the concentric zone of 15 km revealed variability in vegetation health. According to Washington-Allen et al. [23] vegetation indices represent piospheric response as a sigmoidal response function that is a accompanied by four characteristics for which a persistency in their trend indicates a degradation. In this case, two states exist; firstly, a persistence of low indices from 2000-2015 (between 0.1 to 1.5 km), and secondly, variability of indices along the grazing gradient. Thus, indicating localized degradation closest to the concentrator (waterhole) and heterogeneity of the landscape of Karamoja. With the exception of 2000 dry season indices, all the other years and seasons revealed a decline in vegetation health between 5.5 and 8 km before gradually and progressively rising with increasing distance away from the concentrator. This represents an interaction area where potentially the livestock grazing away from different piospheres converge in the range; we have called this interaction area “a convergence zone of new higher impact”. The development of this convergence zone of new higher impact challenges the continuous sigmoidal perspective of a gradient of stocking pressure, which is greatest nearest the watering point and continuously decreases as a function of distance, [15, 23, 47] but confirms the existence of a composite gradient that reveals both a normal and an inverse gradient. Such patterns have previously been illustrated by Pickup et al. [48] It also shows that piospheric impact dissipates after some distance from the concentrator as new forms interactions emerge in the landscape. This convergence zone also represents a potential grazing conflict hotspot zone as livestock from different kraals converge in search of pasture. It thus represents an area that requires close continuous monitoring for peaceful grazing and grazing management in the region.
4.4. Composition and Spatial Configuration of Landscapes in Karamoja
- Results of landscape composition and spatial configuration quantified through landscape metrics revealed two important rangeland dynamics; landscape heterogeneity and landscape fragmentation. Increasing landscape heterogeneity was revealed by the increasing pattern of Shannon Diversity Index while landscape fragmentation was revealed by the variable area-weighted mean patch fractal dimension index. An increasingly pronounced heterogeneous landscape observed around the piospheres could be a result of livestock disturbance through grazing impact. According to De Beer and Van Aarde [32] where landscape heterogeneity exists, livestock (including elephants) are in better position to locate their home ranges. Meanwhile, Peng et al. [33] argued that an increase in landscape diversity and landscape fragmentation is suggestive of intensification of the edge effects, the decrease of landscape stability, and the associated degradation of ecological quality in the landscape. Further, Riginos et al. [49] have shown that semi-permanent piospheres such as boma (kraals) sites can be a cause of landscape degradation. This pattern has been observed around the waterhole piospheres with the reduction of vegetation index expanding to about 2 km from the piosphere centre thereby expanding the inflection point. The expansion of inflection point, is an indicator of the expansion of a permanent gradient from a concentration feature (waterholes/water dams in this case) is indicative of degradation expansion in the landscape [23]. On a more positive note in other dryland areas of East Africa, researchers found that more diverse and spatially heterogeneous landscapes support a diversity of livestock, wildlife inclusive [49-52]. This is because livestock species with different feed and habitat demands/ requirements are in position to utilize the varied landscape resources. In this case, the Karamojong stand to benefit from the varied landscape by rearing different livestock species including sheep, goats, cattle and camels.
5. Conclusions
- This study was set out to provide evidence for and/or against rangeland degradation arising from the rapid introduction of the waterhole/water dams piospheres in Karamoja sub-region. From the results of this study it has been observed that piospheres have influence on soil physical and chemical properties with a slowing effect in hydraulic conductivity probably arising from compaction effect from livestock hooves. This effect is however, not yet very dramatic; this could be due to the fact that most of the piospheres are still fairly young in age. This study has established the persistence of hardy perennial herbaceous species around the piospheres during both the dry and wet seasons; this is indicative of a degradation as alternating effect of annuals flush particularly during the wet season is being eliminated closer to the piospheres. It is also indicative of the increased grazing intensity around the piosphere that is often an expected phenomenon; this helps to explain the expansion of the inflection point observed in the vegetation indices in the landscape. Through the vegetation indices, this study has also revealed existence of an interaction zone in the rangelands; a possible pastoralist livestock grazing meeting point that occurs between 6.5-9 kilometers. We have called this possible interaction area “a convergence zone new higher impact”. Piosphere influence on the degradation at landscape level is however mixed; observably there is a growing localized degradation around the piospheres but is slowly expanding outward as the inflection zone has now expanded to 1.5 to 2 km distance. In another perspective, the impact has produced an invariably composite, complex and highly diverse heterogeneous landscape that can be to the benefit of the pastoralist livestock herders in Karamoja sub-region; this heterogeneity will however be threatened if the inflection zone continues to expand outward unabated as the permanency of the waterholes/water dams gets more established in the region.
ACKNOWLEDGEMENTS
- This study benefited from the Regional Capacity Building for Sustainable Natural Resource Management and Agricultural Productivity under Changing Climate (CAPSNAC) project of Makerere University. Additional funding was provided by the Uganda Governance Platform Project of Uganda Christian University. We are also grateful to Mr. Paul Mugaya our Technical Assistant for sparing time in image processing.