-
Paper Information
- Paper Submission
-
Journal Information
- About This Journal
- Editorial Board
- Current Issue
- Archive
- Author Guidelines
- Contact Us
Resources and Environment
p-ISSN: 2163-2618 e-ISSN: 2163-2634
2015; 5(2): 59-65
doi:10.5923/j.re.20150502.02
Diurnal and Monthly Variations in Atmospheric CO2 Level in Qena, Upper Egypt
Abdel Galeil A. Hassan
Physics Department, Faculty of Science, South Valley University, Qena, Egypt
Correspondence to: Abdel Galeil A. Hassan, Physics Department, Faculty of Science, South Valley University, Qena, Egypt.
| Email: |  |
Copyright © 2015 Scientific & Academic Publishing. All Rights Reserved.
The diurnal and monthly variations of carbon dioxide (CO2) concentrations levels have been studied in Qena, Upper Egypt during the period Jan.2013-Dec.2014. The variations in CO2 are characterized by highest values in winter months (405 ppm) and lowest values in summer months (397 ppm) reflecting fluctuations in motor traffic and humans activities. A weekly cycle with highest values of CO2 during the weekdays and lowest ones during weekends has been identified. The hourly CO2 concentrations showed two peaks – one corresponding to the morning traffic peak; and another corresponding to evening traffic peak. The lower values of CO2 levels were considerably between 12:00 to 4:00 pm. The effect of meteorological variables such ambient air temperature, relative humidity and wind speed on the CO2 level is examined. The results show that the wind speed and the ambient air temperature have negative correlations on the CO2 levels with coefficient -0.38 and - 0.5, respectively. On the other hand, the relative humidity has a positive effect with a correlation coefficient equals 0.51. A data set of PM10, O3 and NO2 corresponding to the same period was used to examine its relation with CO2. The analysis shows that the relationships between CO2 levels and O3, NO2 and PM10 are not good where coefficient of determination, R2, equals 0.017, 0.061 and 0.015, respectively. This finding may be attributed to the low values of CO2 autocorrelation, may be portions of CO2 have been transported to the sampling site.
Keywords: Carbon dioxide, Qena, Regression analysis, Autocorrelation
Cite this paper: Abdel Galeil A. Hassan, Diurnal and Monthly Variations in Atmospheric CO2 Level in Qena, Upper Egypt, Resources and Environment, Vol. 5 No. 2, 2015, pp. 59-65. doi: 10.5923/j.re.20150502.02.
Article Outline
1. Introduction
- The study of atmospheric CO2 emissions is important for its potential effects on climate. The atmospheric CO2 concentrations are increasing due to human and automobile activities such as burning of fossil fuels [1] Human and automobile activities produce more than 80% of the CO2 in an urban environment [2]. Despite its relatively low concentration in the atmosphere, the CO2 is a greenhouse gas and plays a vital role in regulating the earth's surface temperature through the greenhouse effect. Moreover, CO2 is site and time dependent [3] and it is related to weather conditions.In the last few years, much attention has been focused on the increase of the CO2 concentrations [ for example 4-11] These studies focused on the role of sources of atmospheric CO2 and the partition of the anthropogenic CO2 into various components. Also, these studies were interested in the diurnal and seasonal variations of CO2 and its relation with metrological factors and human activities. Most of these studies reported that the CO2 concentrations in winter are greater than the summer ones and are correlated with traffic density. Also, its weekly trend had the lowest values during the weekends when the traffic density reduced. The daily trend had a peak in the early morning when traffic was highest and the atmosphere was more stable. Most of the previous studies for the CO2 levels in the atmosphere were conducted in city centre. The present work was undertaken outside the city (in a desert area) to increase our understanding. The present study is concerned with the following: 1. Diurnal and monthly variations in atmospheric CO2 concentration levels.2. Analysis of the main factors affecting CO2 concentration. 3. Relation the CO2 concentrations to other pollutants such as PM10, NO2 and O3.4. Analysis of the autocorrelation functions of the hourly CO2 values to investigate the proportion of the transported of CO2 into the measured values.
2. Data Collection
- Hourly atmospheric CO2, PM10 and NO2 concentrations as well as air temperature, wind speed, and wind direction measurements have been monitored at the South Valley University (SVU)-meteorological research station, during the period Jan. 2013 to December 2014. The station is located about 6 km northeast of Qena city in a desert area. Also, the station is located about 0.5 km from the University Campus and 1 km from red sea road (Qena – El Hurghada high way). Little vegetation is found around the station. Qena City (26°17' N, 32°43' E, 97 m asl) is located in Upper Egypt, about 600 Km south of Cairo and 60 Km north of Luxor (Figure 1). It is located mainly within the narrow Nile valley which separates Egypt in two unequal dessert parts, the western and the eastern deserts.
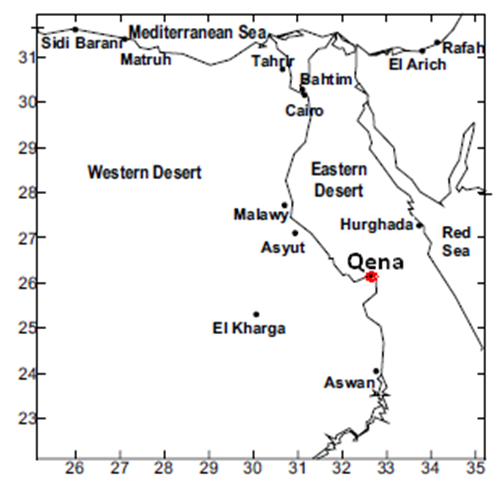 | Figure 1. The studied area, Qena, Egypt |
3. Results and Discussions
3.1. Diurnal Variations of CO2 Concentrations
- Figure 2 provides the diurnal variations of CO2 concentrations at the study site. In the diurnal cycle, the CO2 concentration shows two peaks – one corresponding to the morning traffic peak between 6:00 am and 8:00 am; and another corresponding to the evening traffic peak between 6:00 pm and 8:00 pm. The CO2 levels are considerably lower between 12:00 and 4:00 pm for all the study period because of low traffic densities (and consequently low emission rates) and favourable dispersion conditions (increase in the mixing height).
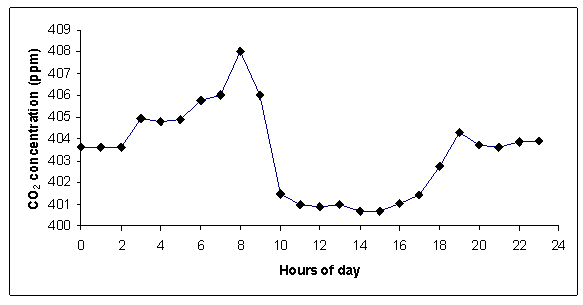 | Figure 2. Diurnal variations of CO2 concentrations at the study site |
3.2. Monthly Variations of CO2 Concentrations
- The monthly variations of CO2, Figure 3, are characterized by highest value (405 ppm) in the cold months (November - February) and lowest value (397 ppm) in summer months (May - August). Some of the previous studies report the similar findings. For example, Gratan and, Varone [4] report that the winter carbon dioxide concentration in Rome was 18% greater than the summer one. The difference between winter and summer CO2 concentrations, in our location, may be attributed to the following facts:
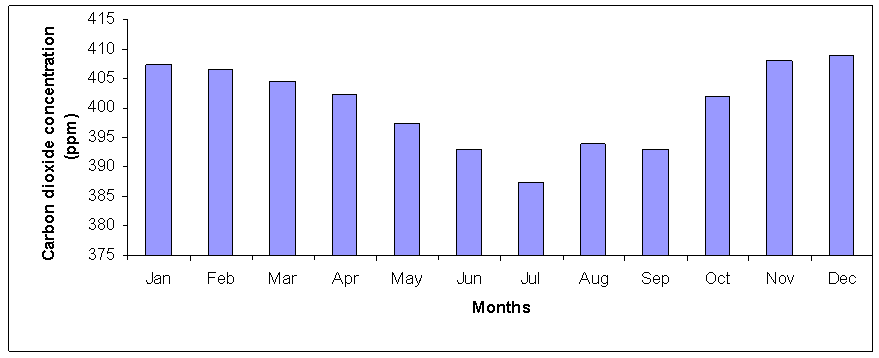 | Figure 3. Mean monthly atmospheric CO2 concentrations at study site during the period Jan.2013-Dec.2014 |
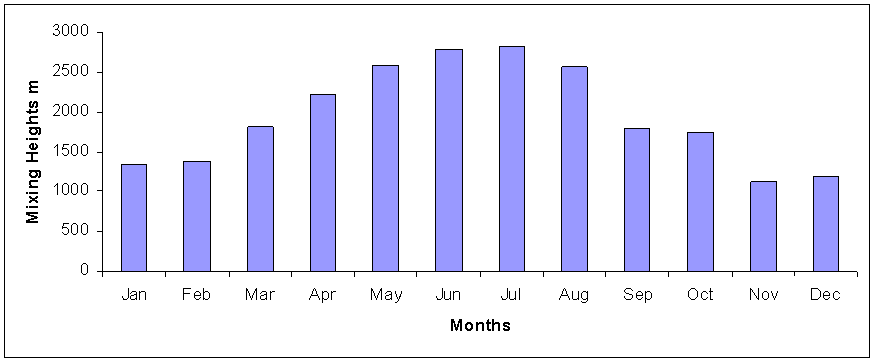 | Figure 4. Mean monthly mixing height at study site during the period Jan.2013-Dec.2014 |
3.3. Impact of Meteorological Factor on CO2 Concentrations
- Meteorological parameters are having great importance in transportation, dispersion and natural cleansing of the air pollutants in the atmosphere. Thus, meteorological information is very essential in locating the industry and planning the control measures for air pollution. Based on this principle the present study has been conducted for studying the effects of meteorological variables on carbon dioxide levels. The meteorological variables are air temperature, relative humidity and wind speed.
3.3.1. Effect of Air Temperature and Relative Humidity
- Figure 5 shows a negative relationship between the ambient temperature and the CO2 concentration where the correlation coefficient (R) is -0.5. The increasing ambient temperature, in summer, is associated with a decrease in the human's activities and reducing of fuels consumption. Also, during the hot summer days, the air near the surface can be much warmer than the air above. Sometimes large volumes of this warm air rise to great heights. This results in vigorous mixing. On the other hand the relative humidity has a positive relationship with carbon dioxide concentration as shown in Figure 6. The positive correlation R is 0.51. This positive correlation may be due to the formation of inversion layer because an increase in humidity reduces the amount of solar radiation reaching the earth’s surface. The heat from the solar radiation is absorbed by the air, resulting in minimizing atmospheric temperature nearer to the surface of the earth. The air layer nearer to the surface of the earth becomes colder than the upper layers, thus reducing the up going air currents and leading to the increase in CO2 and other pollutants concentrations.
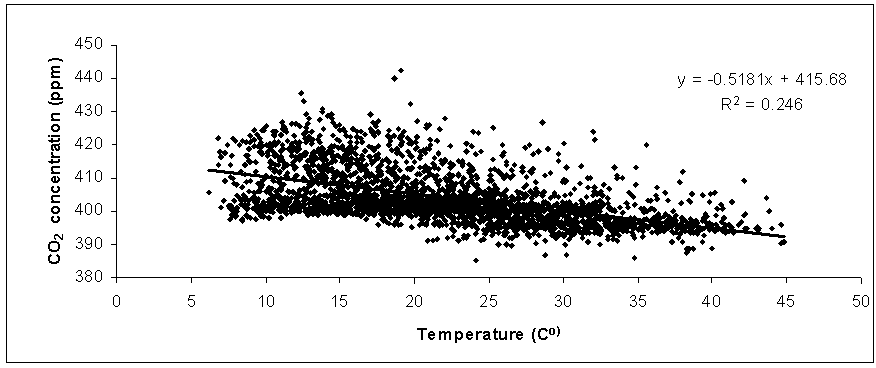 | Figure 5. The relationship between hourly values of CO2 and air temperature at study site during the period Jan.2013-Dec.2014 |
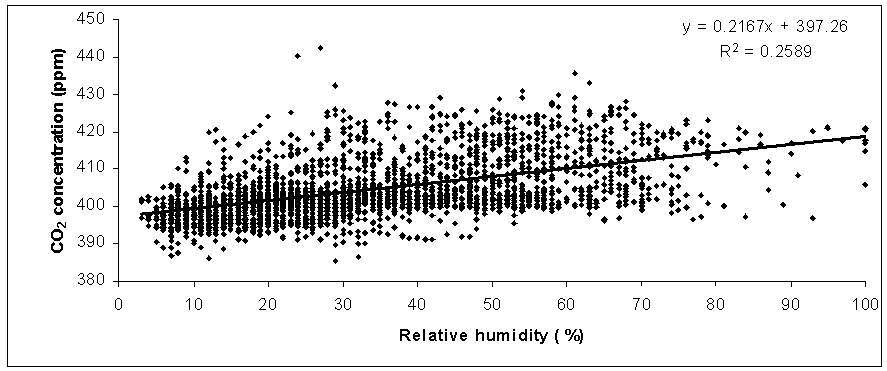 | Figure 6. The relationship between hourly values of CO2 and relative humidity at study site during the period (Jan.2013-Dec.2014) |
3.3.2. Effect of Wind Speed
- The Surface wind plays an important role in the transport and dispersion of pollutants. Figure 7 shows the relationship between the wind speed and CO2 concentration during the study period. It is obvious that the relation is negative with correlation R equals -0.38. The figure shows that the maximum CO2 concentration has occurred at calms. The effect of wind can be explained as follows: increasing of wind will increase the rate of transport of air pollutants. Also, a further increase in wind may be affecting the mixing height through the fractional force of air movement over the ground, which supports the creation of mechanical turbulence. Consequently, increasing wind speed leads to decreasing CO2 concentrations and vice versa.
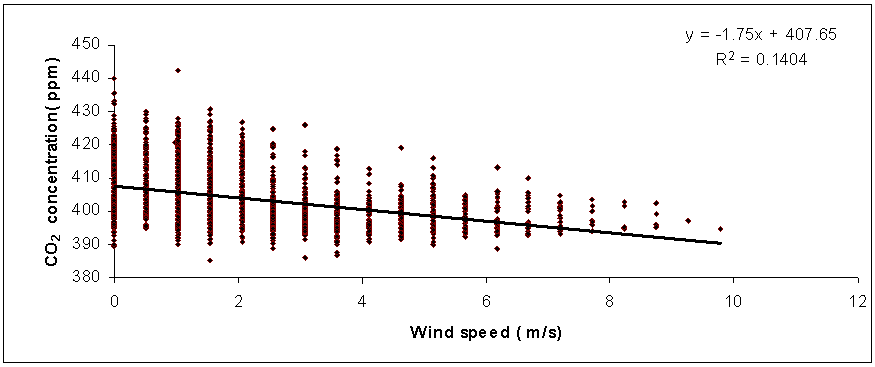 | Figure 7. The relationship between hourly values of CO2 and wind speed at study site during the period Jan.2013-Dec.2014 |
3.4. Analysis of Autocorrelation Function
- Figure 8 illustrates the autocorrelation function for hourly CO2 values in Qena during winter and summer seasons in the period Jan. 2013 to December 2014. The following can be deduced:● There is no complete periodicity in the autocorrelation function within 24 hours, where the autocorrelation function decreased after 24 hour becomes 0.331and 0.371 in winter and summer, respectively● This result leads us to suggest that there may be portions of CO2 to have been transported to the sampling site. The transported CO2 may be from Qena city centre. For more understanding this point, air mass trajectory analysis of CO2 should be undertaken.
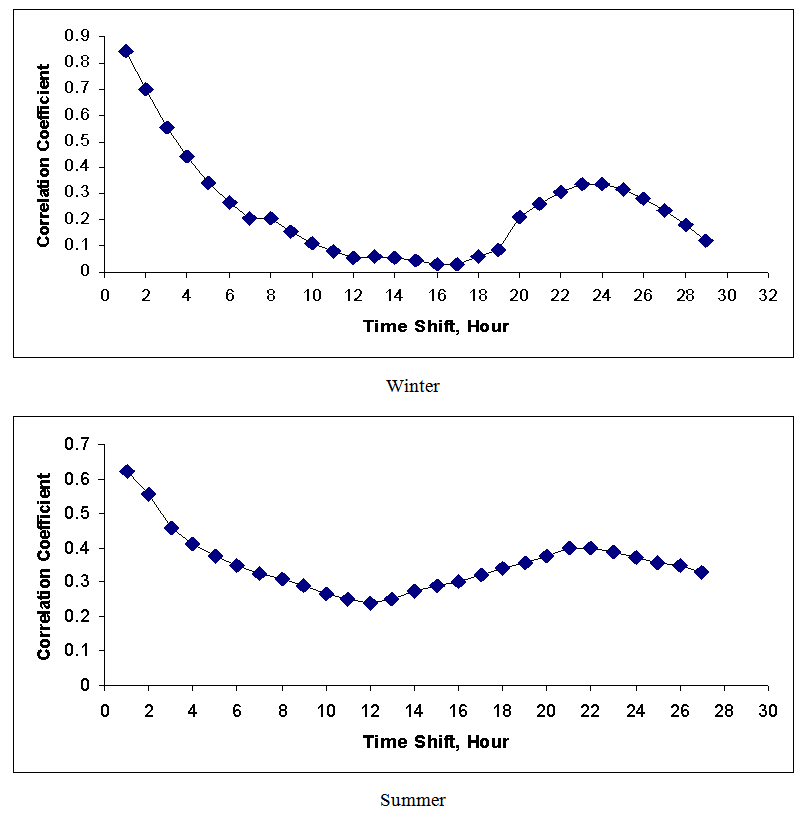 | Figure 8. Autocorrelation function of CO2 in Qena during summer and winter seasons of the period Jan.2013-Dec 2014 |
3.5. Relation between CO2 and Other Pollutants
- Air pollution is made up of a mixture of gases and particles that have been released into the atmosphere by man-made processes. Such emissions are typically from the combustion of fossil fuels such as coal, oil, petrol or diesel. The available measured gases data in study site during the same period, Jan.2013 - Dec.2014, are NO2 and O3. Particulate matter with diameter less or equals to 10µm was measured as well. The present section studies the relation between the hourly CO2 concentration and hourly concentrations of NO2, O3 and PM10. Figures 9(a-b-c) show the relationships of hourly concentrations of CO2 to those of PM10, NO2 and O3. The following findings are deduced:Atmospheric CO2 concentrations correlate quite well with PM10 concentrations, The regression analysis showed positive relationship between CO2 and PM10 which is characterized by a regression slope of 0.033 and intercept of 401.9 with correlation coefficient R equals 0. 38. This may be due to human activates.The regression analysis between CO2 and O3, as shown in Figure 9b, shows a negative relation with slope of 0.21 and intercept of 411.2 and weakly correlation coefficient of -0. 13. The weakly and negative correlation between CO2 and O3 may be due to the ozone gas as secondary pollutant.Figure 9c shows that the CO2 concentration is positively correlated with NO2 concentration with slope 0.30 and intercepts equals 403.7. The positively correlation coefficient is 0.25.
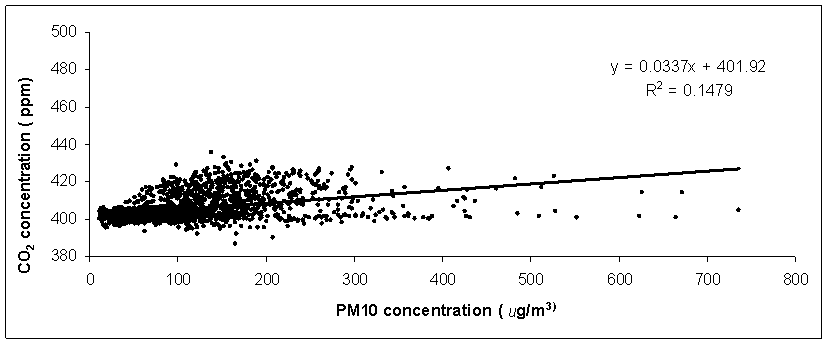 | Figure 9a. The relation between CO2 and PM10 hourly concentration |
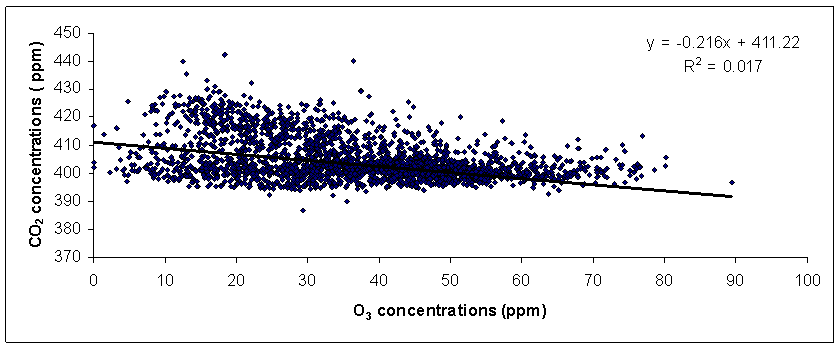 | Figure 9b. The relation between CO2 and O3 hourly concentration |
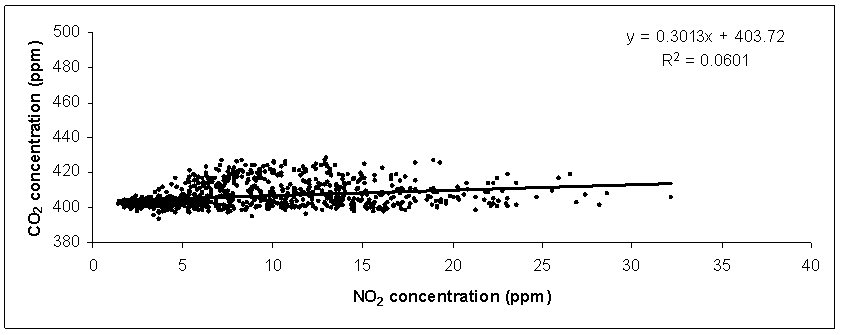 | Figure 9c. The relation between CO2 and NO2 hourly concentration |
4. Conclusions
- From January 2013 to December 2014, the atmospheric CO2 concentration was measured above the ground on the campus of SVU meteorological research station, which is located outside Qena city, Upper Egypt (26°17' N, 32°43' E, 97 m asl). During the same period, both of meotrogical factors and concentrations of atmospheric PM10, O3 and NO2 were also measured. The analysis of these data leads to the following:1. During the diurnal variation, the maximum CO2 concentration occurred in the morning (6-8 am) and the broad minimum in the daytime (12-4 pm)2. The monthly variations of CO2 is characterized by February) and lowest value (397 ppm) in summer months (May - August).3. The atmospheric CO2 measurements in Qena reveal a significant weekly cycle with highest levels during the work-week (Saturday–Thursday) and lowest levels during the weekend (Friday). 4. The atmospheric CO2 has a negative relation with both ambient temperature and wind speed while it has a positive relation with relative humidity.5. The relations between other measured pollutants such as PM10, O3 and NO2 with CO2 were examined. The examination showed that the relationships were not good, may be a portion is transferred from other location
 Abstract
 Reference
 Full-Text PDF
 Full-text HTML