-
Paper Information
- Paper Submission
-
Journal Information
- About This Journal
- Editorial Board
- Current Issue
- Archive
- Author Guidelines
- Contact Us
Resources and Environment
p-ISSN: 2163-2618 e-ISSN: 2163-2634
2015; 5(1): 15-44
doi:10.5923/j.re.20150501.03
A Review on Textile Wastewater Characterization in Bangladesh
 Abstract
 Reference
 Full-Text PDF
 Full-text HTML
Shuchismita Dey , Ashraful Islam
Department of Textile Engineering, Southeast University, Dhaka, Bangladesh
Correspondence to: Shuchismita Dey , Department of Textile Engineering, Southeast University, Dhaka, Bangladesh.
| Email: |  |
Copyright © 2015 Scientific & Academic Publishing. All Rights Reserved.
The textile and apparel industries in Bangladesh are playing an utmost important role offering tremendous opportunities for the economy of Bangladesh. But, hasty and unplanned clustered growth of industries leads to adverse environmental consequence in an alarming way. This work is aimed at giving emphasis on the present pollution scenario in Bangladesh due to textile effluent. The liquid effluents from industries are causing major havoc to the environment, ecology, agriculture, aquaculture and public health since the development of textile industries in the country. In this paper, effluent characterization results of last ten years (2005-2014) are focused. We found physicochemical parameters of Textile effluents in Bangladesh as, Temperature (25-65°C), pH (3.9-14), TDS (90.7 – 5980 mg/L), DO (0-7 mg/L), COD (41-2430 mg/L), BOD (10 – 786 mg/L), TSS (24.9 – 3950 mg/L) and EC (250-63750μS/cm) from 2005 to 2014. From the available data originated from the study depicts the present pollution scenario in Bangladesh with tremendous violation of laws to meet requirement of waste discharge quality standards. Now it has become a prerequisite to set up ETP in each industrial establishment, particularly at dyeing industries that were discharging huge amount of liquid waste to the rivers every day.
Keywords: Textile Wastewater, pH, TDS, COD, BOD
Cite this paper: Shuchismita Dey , Ashraful Islam , A Review on Textile Wastewater Characterization in Bangladesh, Resources and Environment, Vol. 5 No. 1, 2015, pp. 15-44. doi: 10.5923/j.re.20150501.03.
Article Outline
1. Introduction
- The textile industry is a significant contributor to many national economies, encompassing both small and large-scale operations worldwide. In terms of its output or production and employment, the textile industry is one of the largest industries in the world [1a].Bangladesh Textile industries have been the backbone of her economy for years. The industry is providing 45% of industrial manpower with employment. More than 4 million people of the country’s total population of which more are the women, are attached to these industries. The textile industries of Bangladesh are a combination of small and large scale public and private companies. Bangladesh Textile Industries can be divided into three sectors, the Government sector, the hand loom sector and the organized private sector. The role of the hand loom sector is significant because of employment opportunity of a large number of people of our country. Bangladesh is exporting her about 750 Textile Products in China’s market under Asia Pacific Trade Agreement with nominal duty. The textile products of Bangladesh have also, developed its demand in Japan too. Besides, Bangladesh is exporting readymade garments to USA and Europe also.Bangladesh garment industries are exporting significant number of cloths to the global market. Its exporting incomes were US $ 17.9 billion in the year 2010-11, US $ 19.0 billion in the year 2011-12 and US $ 21.5 billion in the year 2012-13 [1b], the share of textile sector is almost 80%. Bangladesh has achieved 2nd position in case of exporting global readymade garment products.According to the Organization of Garments Manufacturers and Exports of Bangladesh, the need of textile sector is 3 billion yard fabric, which nearly from 85-90% is imported from neighboring countries such as China, India, Taiwan, Thailand and Singapore and its demand of this raw material is increasing 20% annually.Although, the textile sector is the largest and the flourishing sector of Bangladesh but the most important problem is the non-availability of the raw material to the needs of these industries. In spite of it, these industries are gaining its place at global level. Owing to the easy and cheaper manpower, this industry is fully availing itself of the relative advantage [2].Bangladesh has earned “Brand Bangladesh” in readymade garment products exporting in the world, gratitude goes to the Multi-Fiber Agreement (MFA), and the Generalized System of Preferences (GSP) of the European Union, that conferred significant quota benefits to the country. The garment sector now contributes about 77% of the country’s foreign exchange earnings, and 50% of its industrial work force [3].
1.1. Use of Natural Resources and Its Discharge Condition
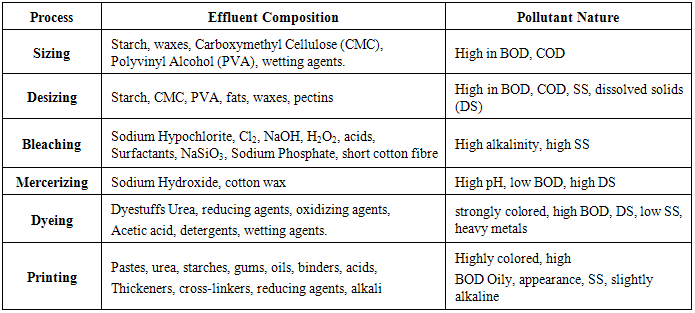
- The textile manufacturing process is characterized by the high consumption of resources like water, fuel and a variety of chemicals in a long process sequence that generates a significant amount of waste. The common practices of low process efficiency result in substantial wastage of resources and a severe damage to the environment. The main environmental problems associated with textile industry are typically those associated with water body pollution caused by the discharge of untreated effluents. Other environmental issues of equal importance are air emission, notably Volatile Organic Compounds (VOC)’s and excessive noise or odor as well as workspace safety [1].In the age of industrialization, environmental pollution is a matter of great concern. Surface water pollution is one of the elements of this pollution. Surface water is the water we find in the river, canals, cultivation field and other water bodies on the earth. Severe pollution of this water is causing serious health hazard in the neighborhood, damaging fertility of the land, killing fishes and aquatic lives. Being land of rivers Bangladesh is largely dependent on this surface water. We must keep this water safe for better environment and good health of the people. Many issues are responsible for surface water pollution. Chemical processing industries especially textile processing industries are claimed to produce huge effluent to discharge in our river and other water bodies [4].Rapid growth in the industrial sector is playing a vital role in the economy of Bangladesh. Mainly the growth has been concentrated in garments which are export oriented industries. To support garments a large number of other textile industries have been established & more are growing to be set up shortly. These rapid growth of textile industries create environmental pollution, mainly pollution in water bodies. The reason of water pollution is lack of appropriate environmental management in textiles in Bangladesh. There are several environmental management options in textiles. Among various options most popular and effective option is establishment of perfect wastewater treatment plant which is conventionally known as effluent treatment plant (ETP) & appropriate treatment of waste water regularly [5].The textile industries are distinguished by the use of raw materials which determines the volume of water required for the process as well as wastewater generated. The major industries in Bangladesh are mainly raw cotton-based. In this type of production, slashing, bleaching, mercerizing, and dyeing are the major water consumption activities as well as wastewater generation processes.During each stage different type of chemicals are used such as strong acids, strong alkalis, inorganic chlorinated compounds, hypochlorite of sodium, organic compound such as dye stuff, bleaching agent, finishing chemicals, starch, thickening agent, surface active chemicals, wetting and dispensing agents and salts of metals. Various dyes are used during dyeing stage for coloring purposes; multi color are used to improve best of products. The processing steps involved and associated pollutants parameter are shown in figure 1 [6].
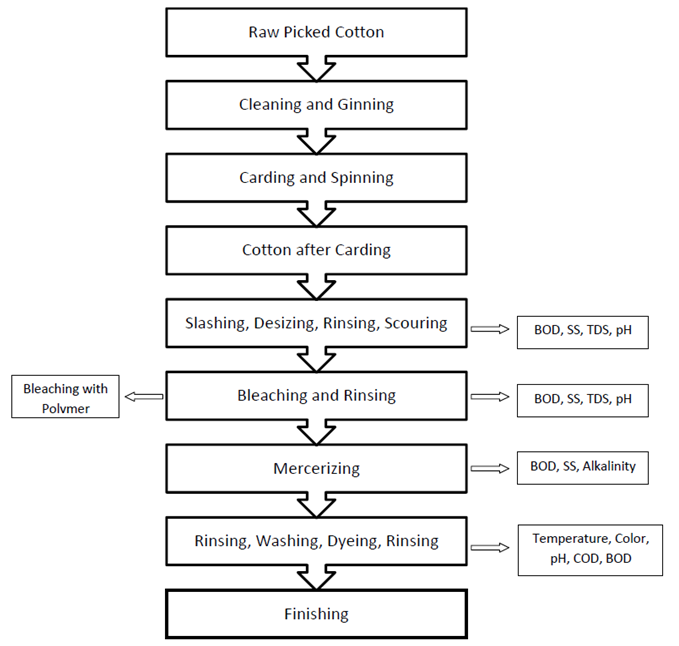 | Figure 1. Cotton Fabric Production and Associated Parameters |
|
1.2. Comparative Study with Neighboring Countries
1.2.1. Textile Industry in China [8, 9b]
- China holds an impassive place in Textile Industry and is leading global production without any impediment. On an intensive study at the end of 2009 which tells that in spite of the negative impacts of global financial crises, China still holds an attractive position in the World Textile Industry (China’s competitiveness index for this industry was evaluated at 102.8 in 2009). China retains 1st position in US market with 36% share of US total textile imports and again at the top table in European market with a share of 29% of European Union total textile imports in the world. In the first 10 months of 2010, China’s exports had been more than US $ 62 billion which were higher than the same period during 2009. However China Textile is changing rapidly. For the past few decades foreign investment and the modern technology have linked themselves to this sector. As a result of this, China has stepped forward in world’s production of more civilized and value added products. Huge amount of foreign investment, low cost labor force, advanced technology and depreciated exchange rates are the most important factors of China’s towering status in Textile Industry.
1.2.2. Textile Industry in India
- India Textile Industry is the oldest and biggest industry of India. Rather it is the biggest industry after China in the world. The industry contributes 14% of industrial production in the country. This industry earns 17% of her total exports also. Textile Industry of India provides employment opportunities to 35 million people of the country.India is the biggest country of the world in Jute production, 2nd in Silk production, 3rd in cotton production while 5th big country in Synthetic fiber production [2].
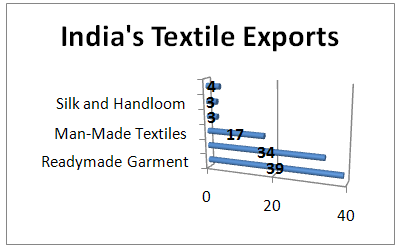 | Figure 2. India’s Textile Exports [19] |
1.2.3. Textile Industry in Pakistan
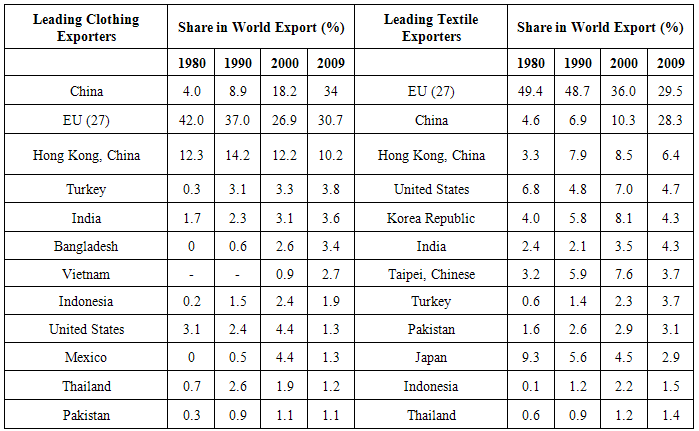
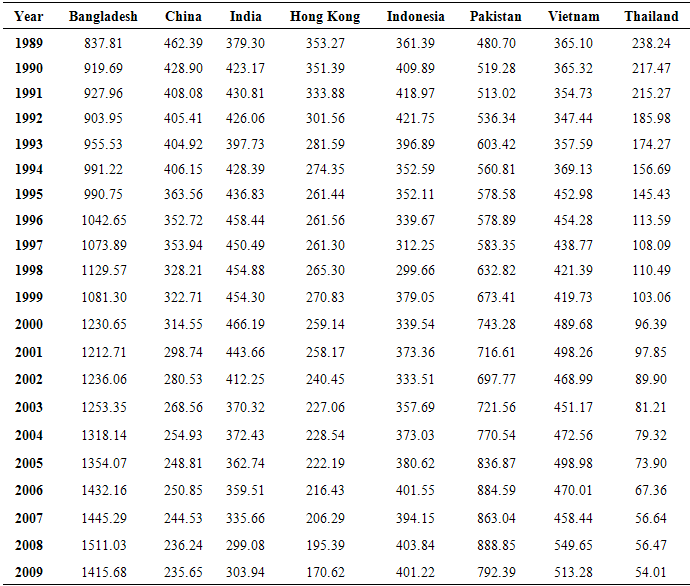
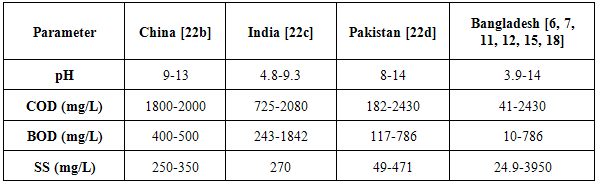
- The role of Textile Industry of Pakistan in the gross economic activities has been very positive and distinctive. More than 40% of manpower of industrial sector link to this sector whereas the contribution of the textile industry towards the total export of Pakistan is approximately 63%. Pakistan is the 8th large country in Asia in terms of textile production. But its contribution towards World Textile Trade is even less than 1%. Pakistan is the 4th big country in the world in cotton production. Pakistan is in the 3rd position after China and India in the capacity of spinning and provides 5% of spinning capacity in the world. The total share of this sector in GDP of Pakistan is nearly 9.5% during the fiscal year 2010. The growth of Pakistan Textile Industry is marred by gas and electricity crises, an increase in yarn prices, increase in the minimum wages of industrial laborers, political instability, mal-transportation system and tariff and trade contracts are incessant obstruction [2].Changes in factor endowment along with changes in trade policies may have provided necessary stimulation to boost up Bangladesh’s clothing industry. Despite the global recession, demand for Bangladeshi cheap clothing did not fall. Bangladesh is obviously in a better position regarding the price competitiveness of clothing sector compared to other major Asian clothing exporters. The RCA (Revealed Comparative Advantage) of Bangladesh’s clothing [Table 2] maintains its increasing trend even though there were global economic downturns in years 1999, 2008-9 etc. and even after the removal of quota restrictions in 2005. However, countries like China and India show a decreasing trend in their respective RCA indices, specially, in the later years probably due to the global economic recession. Comparing RCAs among the top Asian clothing exporters, it can be clearly indicated that export based RCA of Bangladesh is continuously increasing compared to the other Asian competitors [Figure 3].
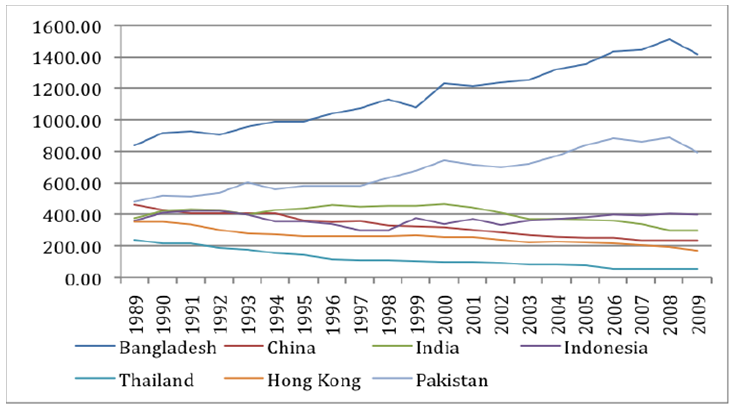 | Figure 3. Comparisons of RCA among Asian CT exporters |
|
|
1.3. Objective
- This review article has been prepared to compile all present data on Textile wastewater characterization of Bangladesh. This paper includes a comprehensive discussion on wastewater characterization of Bangladesh as well as a comparative study of Textile growth and pollution level by this sector between Textile dominating countries.
2. Characterization of Textile Wastes in Bangladesh
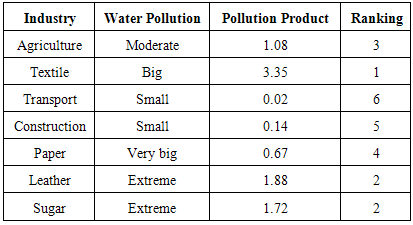
- Until the middle of the 19th century, all colorants applied were from natural origin. Inorganic pigments such as soot, manganese oxide, hematite and ochre have been utilized within living memory. Organic natural colorants have also a timeless history of application, especially as textile dyes. These dyes are all aromatic compounds, originating usually from plants (e.g. the red dye alizarin from madder and indigo). Synthetic dye manufacturing was started commercially in 1856, when the English chemist W.H. Perkin, in an attempt to synthesize quinine, obtained it, instead of a bluish substance with excellent dyeing properties that later on became known as aniline purple, Tyrant purple or mauveine. Perkin, an 18-year old boy, patented his invention and set up a production line for mass production. Consequently, in the beginning of 20th century, synthetic dyestuffs almost completely supplanted the natural dyes. Key environmental issues associated with textile manufacture are use of water, its treatment and disposal of effluent. The risk factors are primarily associated with the wet processes, such as, desizing, scouring, bleaching, mercerizing, dyeing and finishing. Desizing, scouring and bleaching processes produce large quantity of wastewater. Treatment for color removal can increase the risk of pollution. For instance, treating azo-dyes results in production of amines which could be a greater environmental risk than the dye itself. It is reported that textile effluent is very low in terms of LC50 and exhibit very high toxicity with acute toxicity unit (ATU) levels between 22 and 960. Dyes are contributing to overall toxicity at all processing stages. Also, dye baths could have high level of BOD, COD, color, toxicity, surfactants, fibers, turbidity, and contain heavy metals [8c]. They generally constitute a small fraction of total liquid effluent, but may contribute a high proportion of total contaminants. It is to be note that textile effluents are highly colored and saline that contain non-biodegradable compounds, and are high in Biochemical and Chemical Oxygen Demand (BOD and COD). It is reported that the presence of metals and other dye compounds inhibit microbial activity and some cases may cause failure of biological treatment system. USEPA reported that the pollution parameters in textile effluents are suspended solids, BOD, COD, nitrogen, phosphate, temperature, toxic chemicals (phenol), chromium and other heavy metals, pH-value, alkalinity and acidity, oils and grease, sulphide, and coliform bacteria. The Department of Environment of Bangladesh has supported these and demands for their proper monitoring in the textile effluents in the country. Textile effluents are high in BOD due to fiber residues and suspended solids [8c]. They can contaminate water with oil & grease, and waxes, while some may contain heavy metals, such as, chromium, lead, copper, zinc and mercury. Dyeing process usually contributes chromium, lead, zinc and copper to wastewater. Copper is toxic to aquatic plants at concentrations below 1.0 mg/L while concentrations near this level can be toxic to some fishes [8d]. There are a lot of different kinds of industries in Bangladesh. All these industries have different waste problems. A grading of index of the level of pollution is made and given in Table 4 [6].
|
3. Textile Wastewater Characterization in Bangladesh (2005-2014)
- Physicochemical parameters of Textile wastewater of Bangladesh have been summarized. The review has been done based on literature of last ten years (2005-2014).
3.1. Measurement and Method
- A significant number of experiment and research have done on Textile wastewater Characterization of different textile industrial zones in Bangladesh. The samples were analyzed for various physicochemical parameters like, TDS, pH, EC, Temperature, BOD, COD and TSS according to standardized method. In those experiments, the researchers used a standard method for sampling (ISO5667-02:1996 E).
4. Results and Discussion
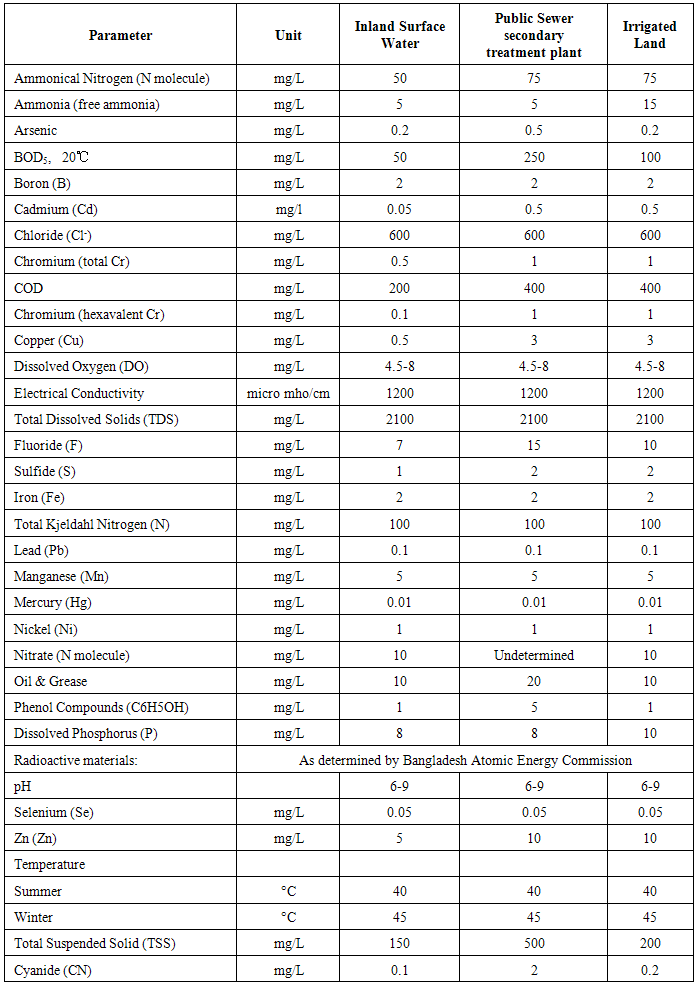
- Color, odor, temperature, pH, Total dissolved solids (TDS), Dissolved oxygen (DO), Chemical oxygen demand (COD), Biochemical oxygen demand (COD) and Electrical conductance (EC) are major characterizing physicochemical parameters of Textile effluents. There are different textile industrial zones in Bangladesh. These are Savar, Ashulia, Dhamrai, Gazipur, Narayangonj and Chittagong. The textile wastewater characterization results have been summarized with respect to area and year based on available literature in local and international journals in Table 8. As per the results in Table 7, we can state that wastewater samples were collected from various sources, such as drain, open areas, raw wastewater, treated wastewater etc. to get actual picture of pollution level of Bangladesh. Various colors such as blue, green, yellow, pink, gray, black etc. reported in the Table. Pungent and foul odorwere found in most of the wastewater samples. We can summarize results as temperature (25-65 °C), pH (3.9-14), TDS (90.7-5980 mg/L), DO (0-7 mg/L), COD (41-2430 mg/L), BOD (10-620 mg/L), TSS (24.9-3950 mg/L) and EC (250-63750)μS/cm [Table 7]. Most of these values are above the standards [Table 5].
|
|
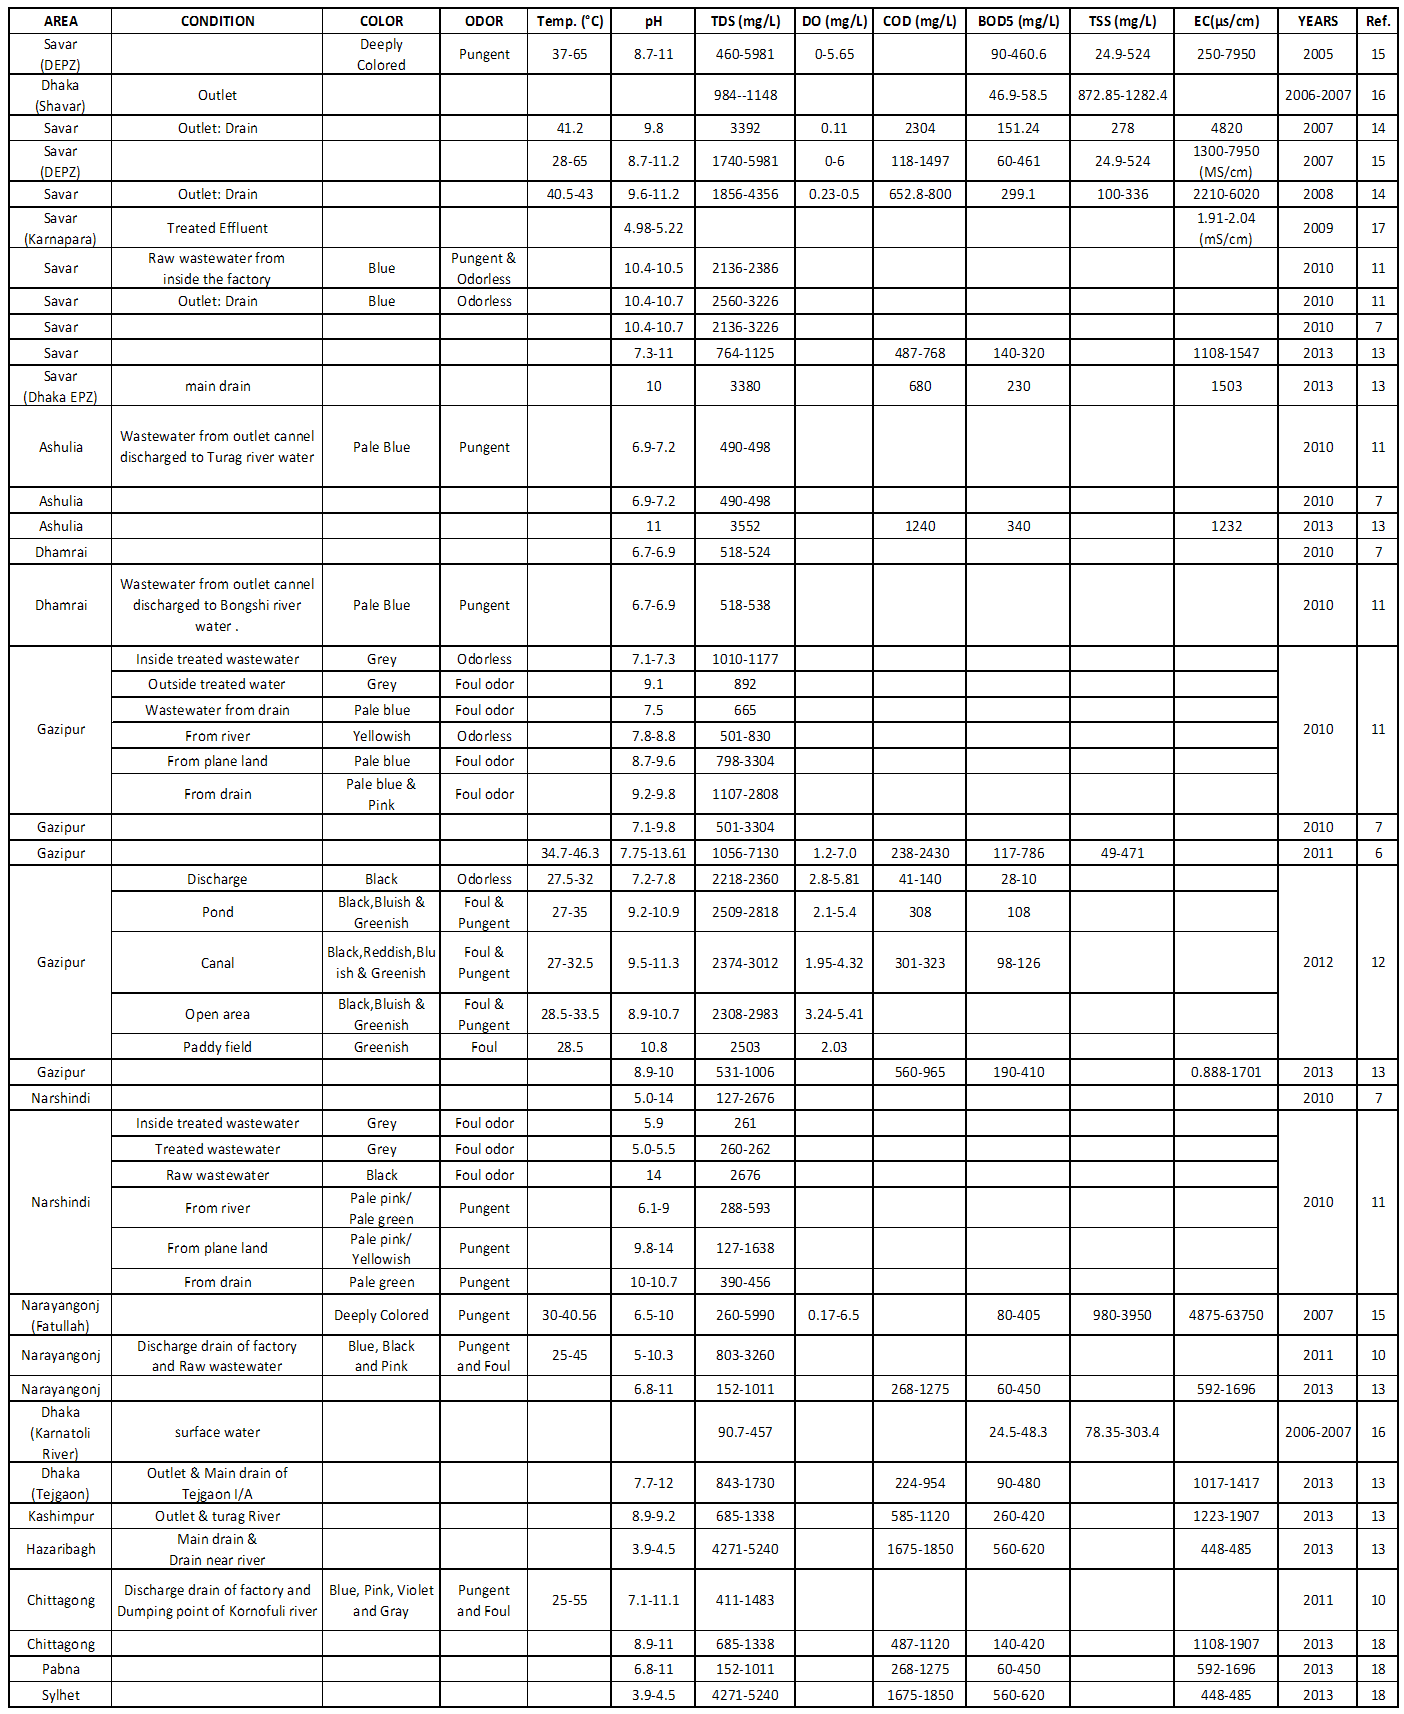 | Table 7. Physicochemical Parameters of Textile Effluent Collected From Different Areas of Bangladesh |
|
4.1. Year Wise Variation
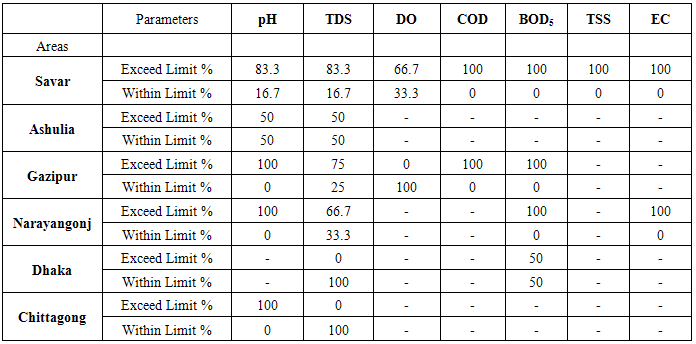
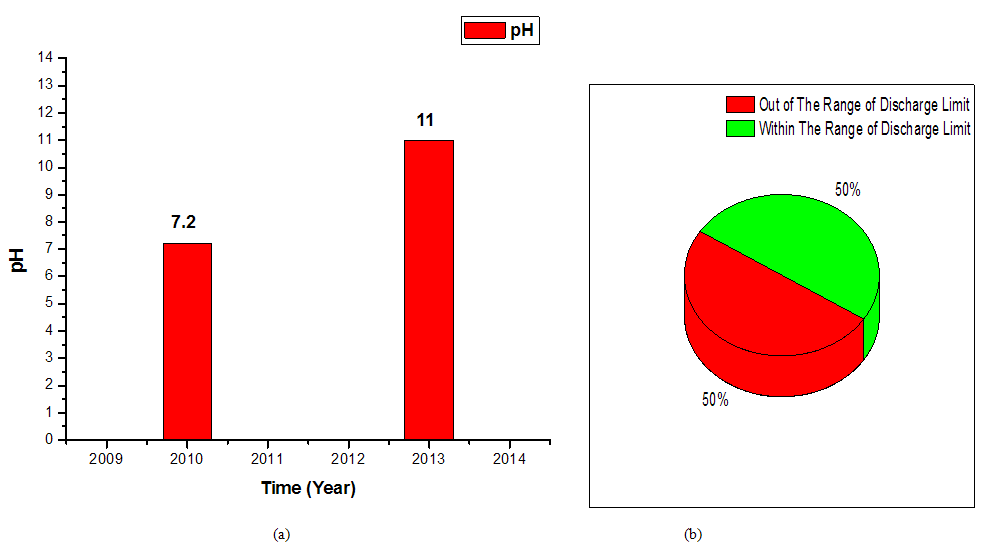
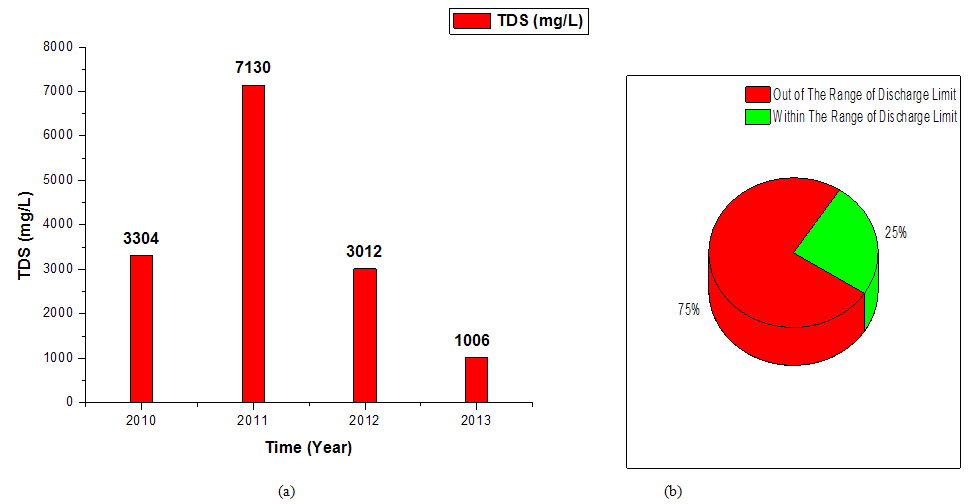
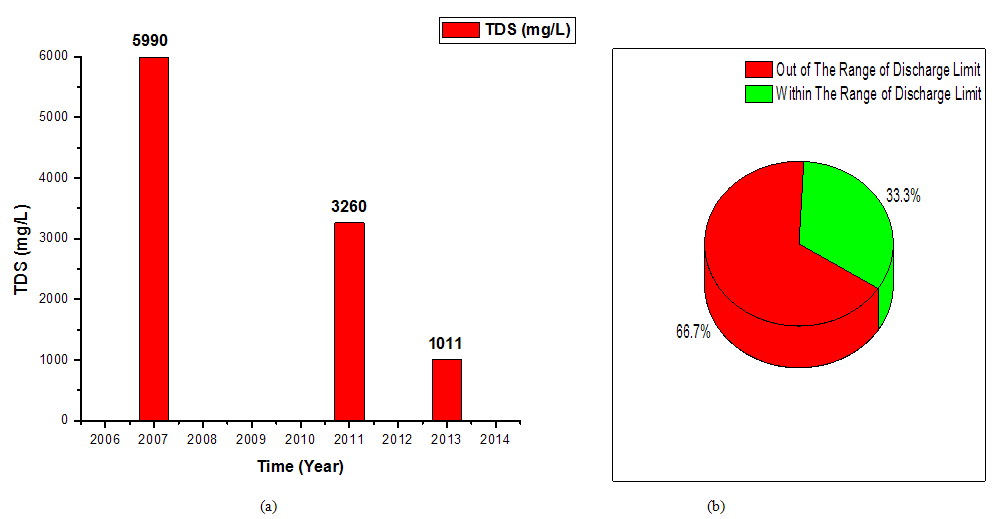
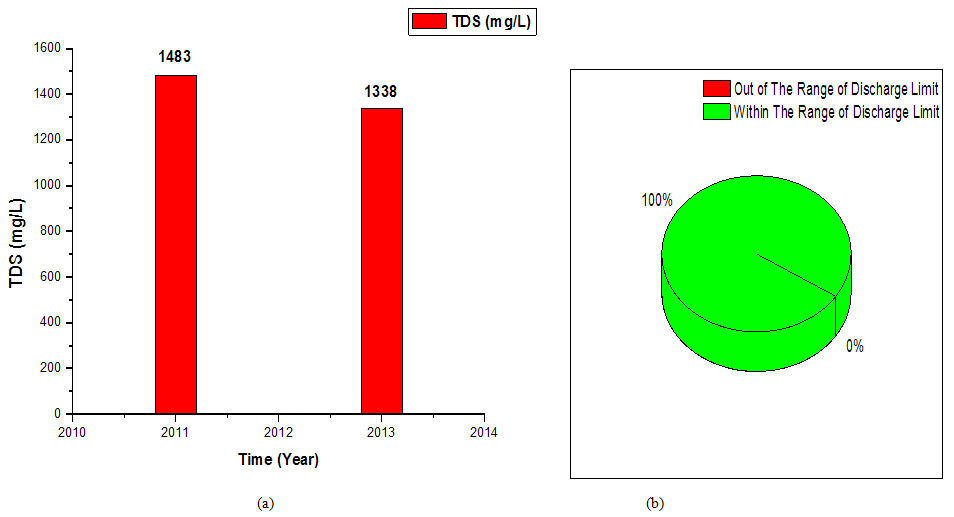
- The available data in Table 7 have been treated to get bar and pie charts for easy and clear understanding of readers.I. SAVARThe bar chart for pHvs. year of Savar area has been shown in Figure 4 (a). The bar chart shows pH values of Textile wastewater at different years. For example pH is 11 in 2005 and remained same in 2013. The corresponding pie chart (Figure 4 b) indicates that 83.3 % wastewater samples were out of the range of discharge limit (6-9). Similarly the bar chart TDS (mg/L) vs. year (Figure 5a) indicates corresponding TDS values of Textile wastewater samples at different years. The corresponding pie chart (Figure 5b) has been generated based on national discharge limit of TDS (2100 mg/L) [Table 5]. The other parameters, DO, COD, BOD, TSS and EC are shown in bar & pie charts in Figures 6a-10b.
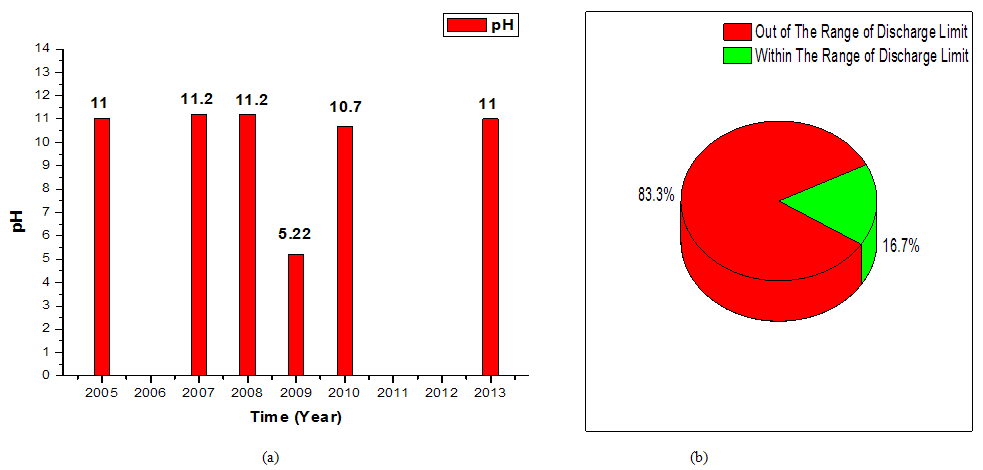 | Figure 4. (a) A bar chart of year wise variation in pH at Savar. (b) Apie chart of pH discharging condition with reference to the discharge limit |
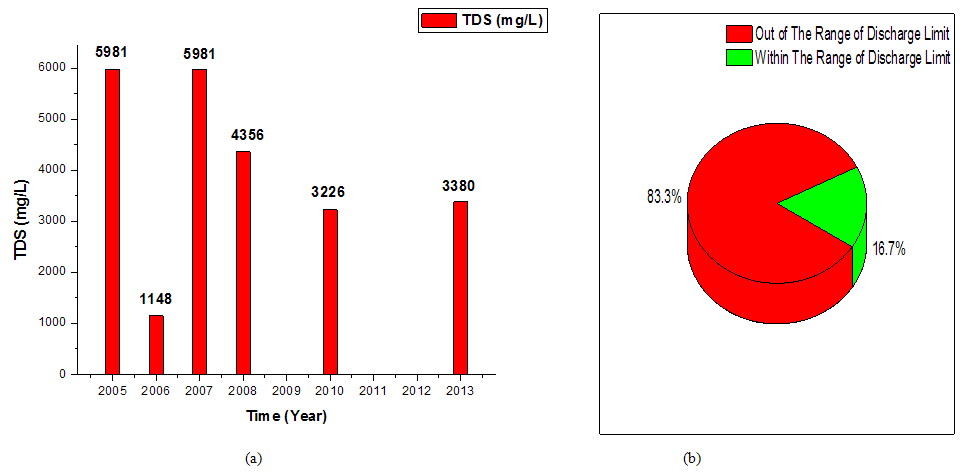 | Figure 5. (a) A bar chart of year wise variation in TDS at Savar. (b) A pie chart of TDS discharging condition with reference to the discharge limit |
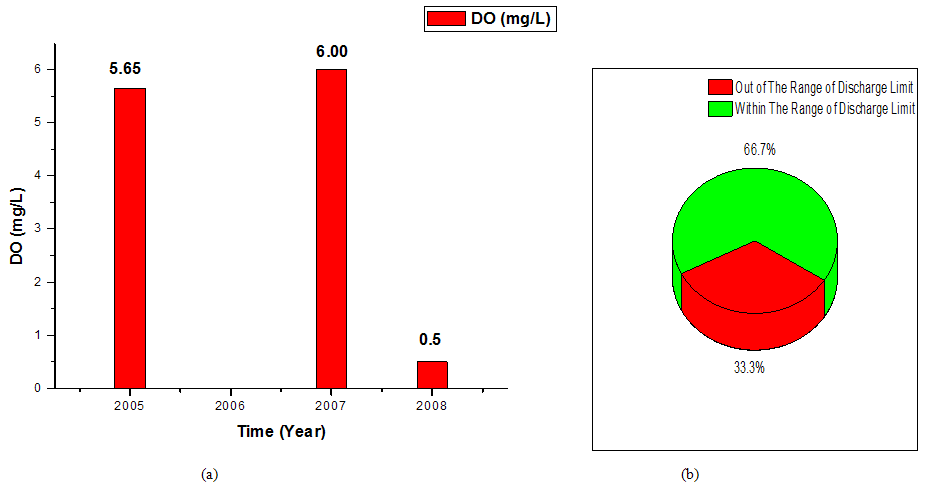 | Figure 6. (a) A bar chart of year wise variation in DO at Savar. (b) A pie chart of DO discharging condition with reference to the discharge limit |
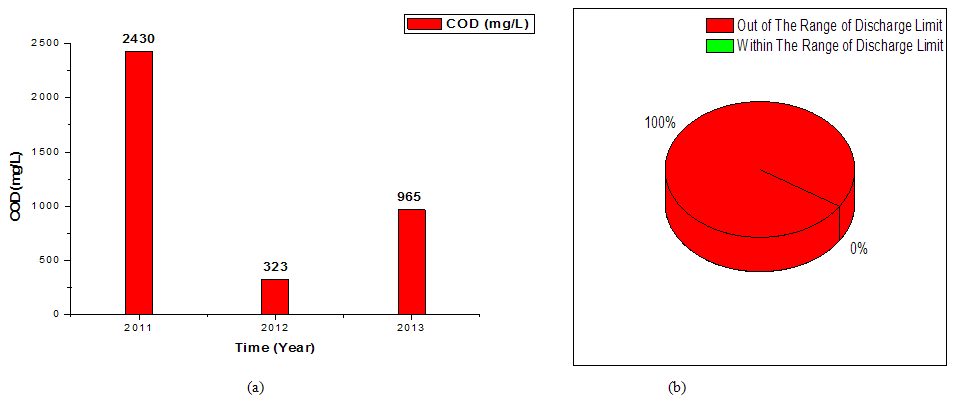
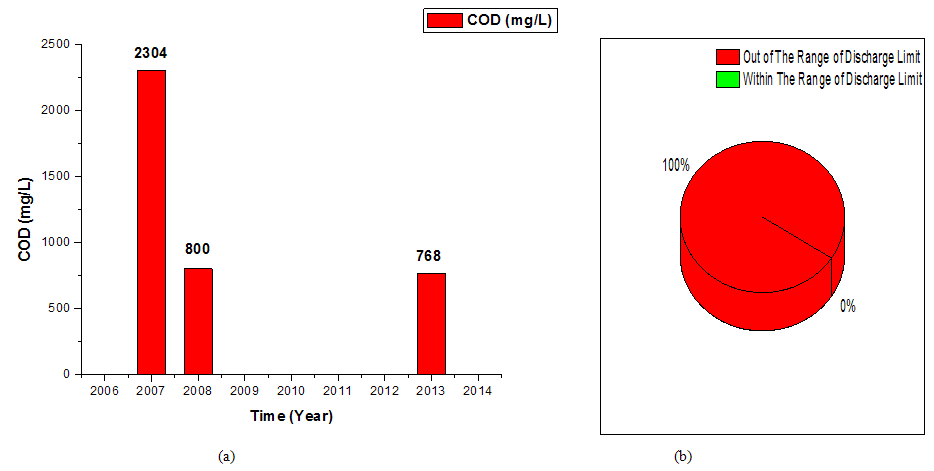 | Figure 7. (a) A bar chart of year wise variation in COD at Savar. (b) A pie chart of COD discharging condition with reference to the discharge limit |
 | Figure 8. (a) A bar chart of year wise variation in BOD at Savar. (b) A pie chart of BOD discharging condition with reference to the discharge limit |
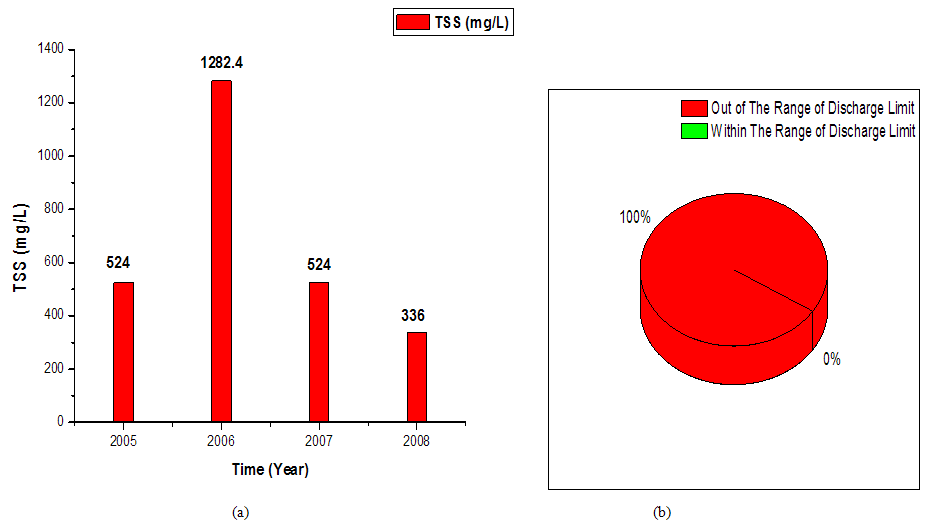 | Figure 9. (a) A bar chart of year wise variation in TSS at Savar. (b) A pie chart of TSS discharging condition with reference to the discharge limit |
 | Figure 10. (a) A bar chart of year wise variation in EC at Savar. (b) A pie chart of EC discharging condition with reference to the discharge limit |
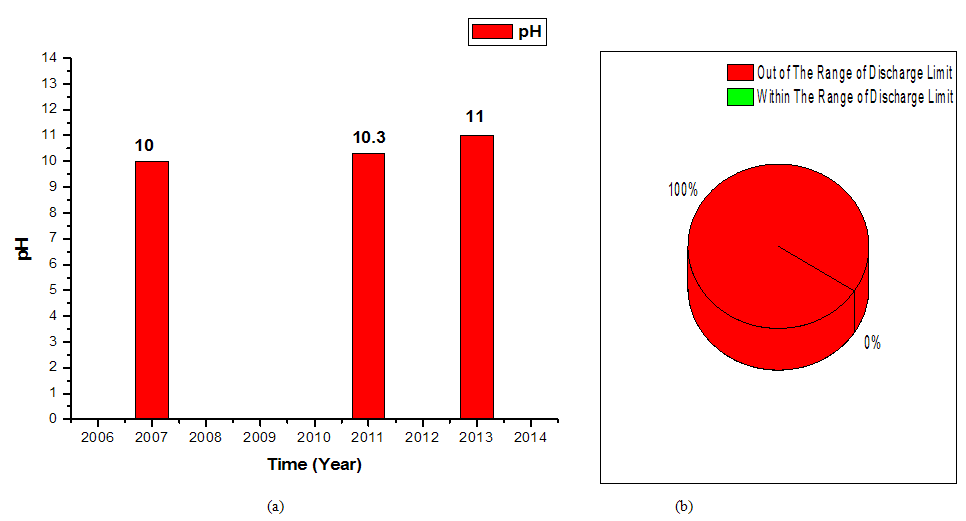
 | Figure 11. (a) A bar chart of year wise variation in pH at Ashulia. (b) A pie chart of pH discharging condition with reference to the discharge limit |
 | Figure 12. (a) A bar chart of year wise variation in TDS at Ashulia. (b) A Pie chart of TDS discharging condition referring to the discharge limit |
 | Figure 13. (a) A bar chart of year wise variation in pHat Gazipur. (b) A pie chart of pH discharging condition with reference to the discharge limit |
 | Figure 14. (a) A bar chart of year wise variation in TDS with time to time at Gazipur. (b) A pie chart of TDS discharging condition with reference to the discharge limit |
 | Figure 15. (a) A bar chart of year wise variation in DO at Gazipur. (b) A pie chart of DO discharging condition with reference to the discharge limit |
 | Figure 16. (a) A bar chart of year wise variation in COD at Gazipur. (b) A pie chart of COD discharging condition with reference to the discharge limit |
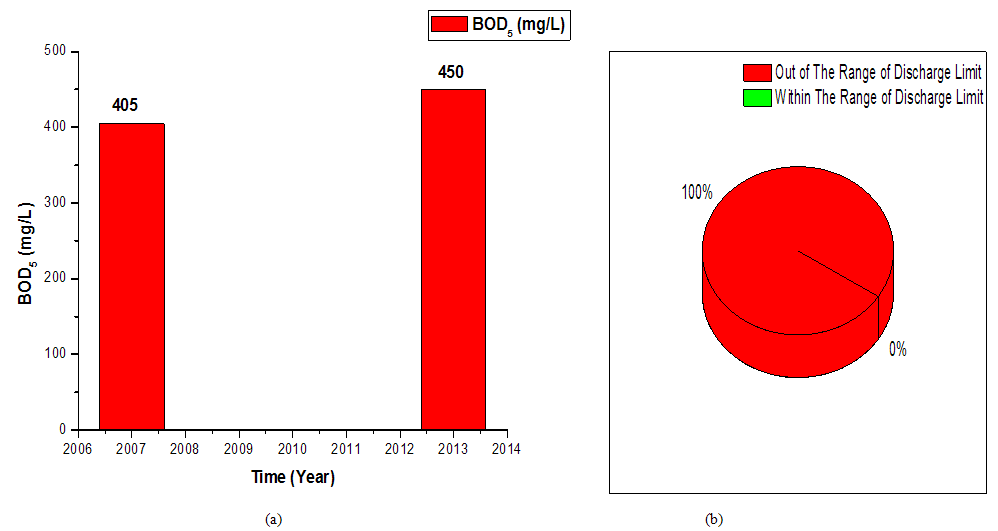
 | Figure 17. (a) A bar chart of year wise variation in BOD5 at Gazipur. (b) A pie chart of BOD5 discharging condition with reference to the discharge limit |
 | Figure 18. (a) A bar chart of year wise variation in pH at Narayangonj. (b) A pie chart of pH discharging condition with reference to the discharge limit |
 | Figure 19. (a) A bar chart of variation in TDS with time to time at Narayangonj. (b) A pie chart of TDS discharging condition with reference to the discharge limit |
 | Figure 20. (a) A bar chart of year wise variation in BOD5at Narayangonj. (b) A pie chart of BOD5 discharging condition with reference to the discharge limit |
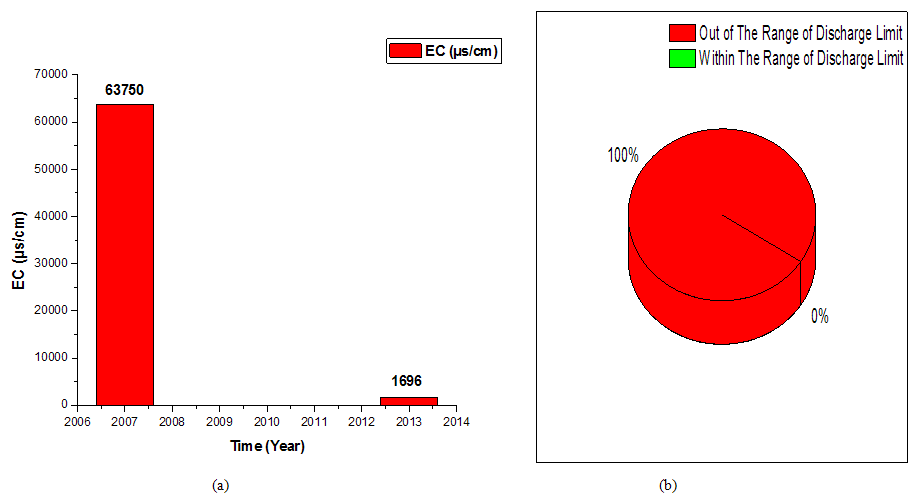 | Figure 21. (a) A bar chart of year wise variation in EC at Narayangonj. (b) A pie chart of EC discharging condition with reference to the discharge limit |
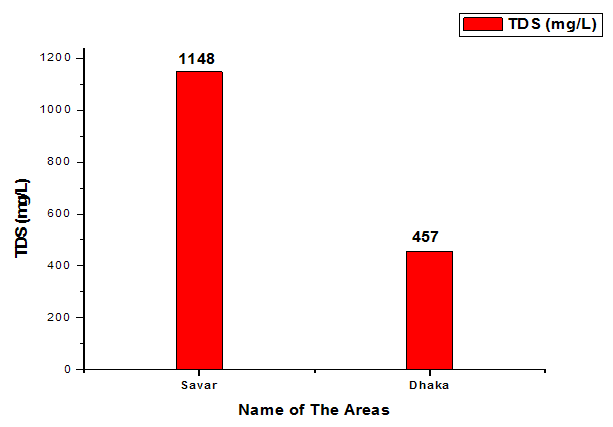
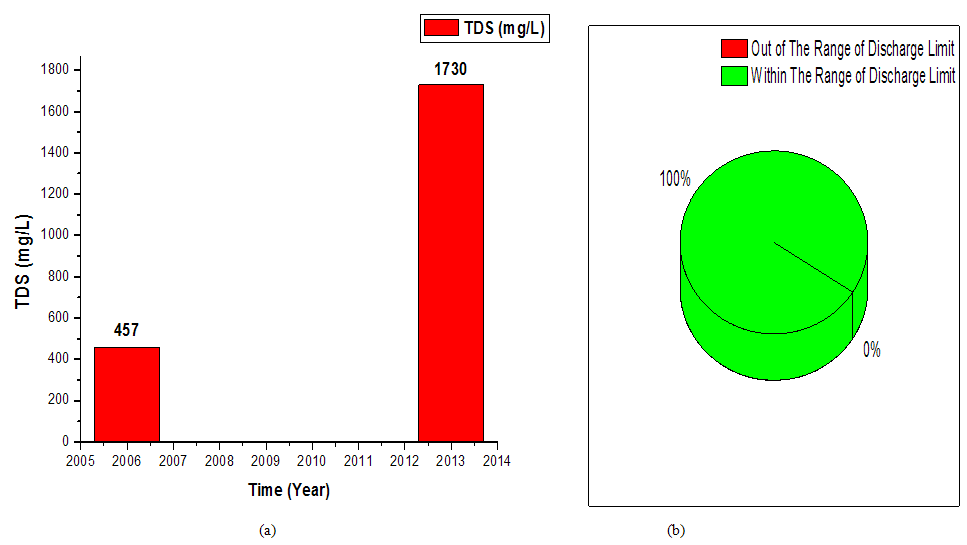 | Figure 22. (a) A bar chart of year wise variation in TDS at Dhaka. (b) A pie chart of TDS discharging condition with reference to the discharge limit |
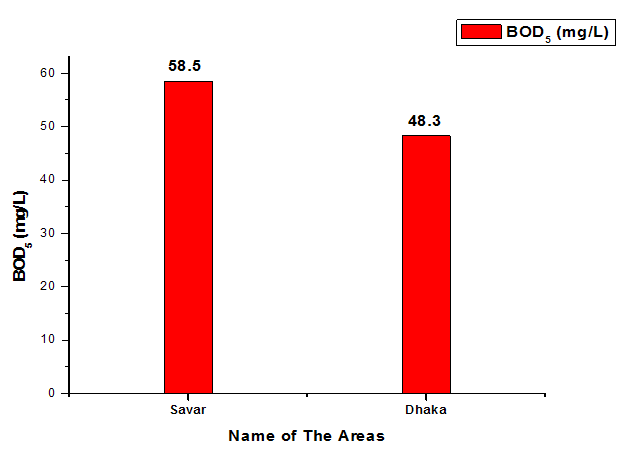
 | Figure 23. (a) A bar chart of variation in BOD5 at Dhaka. (b) Apie chart of BOD5 discharging condition referring to the discharge limit |
 | Figure 24. (a) A bar chart of year wise variation in pH at Chittagong. (b) A pie chart of pH discharging condition with reference to the discharge limit |
 | Figure 25. (a) A bar chart of year wise variation in TDS at Chittagong. (b) A pie chart of TDS discharging condition with reference to the discharge limit |
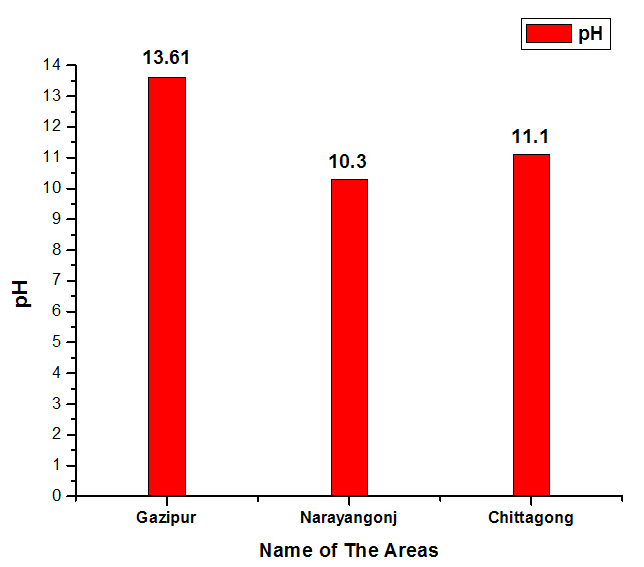
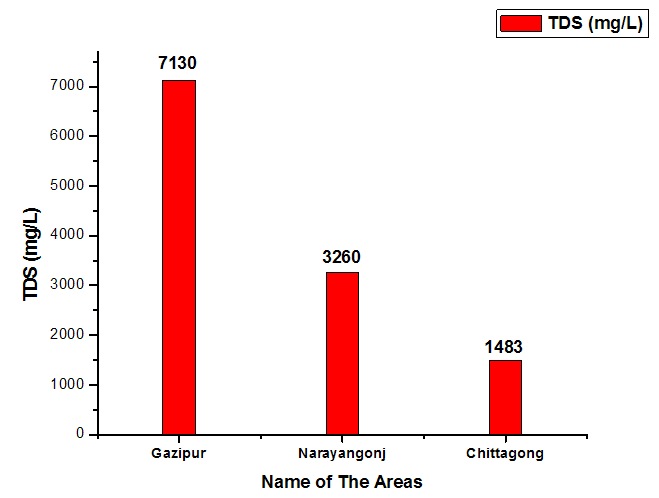
4.2. Area Wise Variation
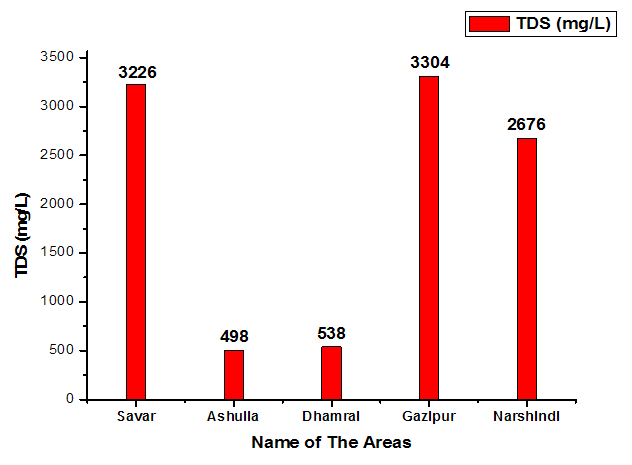
- The bar charts (Figures 26-43) explain year wise Textile wastewater characterization of different areas of Bangladesh. The maximum pH (14) was found in 2010 in Narshindi area. The maximum TDS (5990 mg/L) was found in 2007. On the other hand, the maximum BOD (620 mg/L) was recorded in 2013. I. 2013
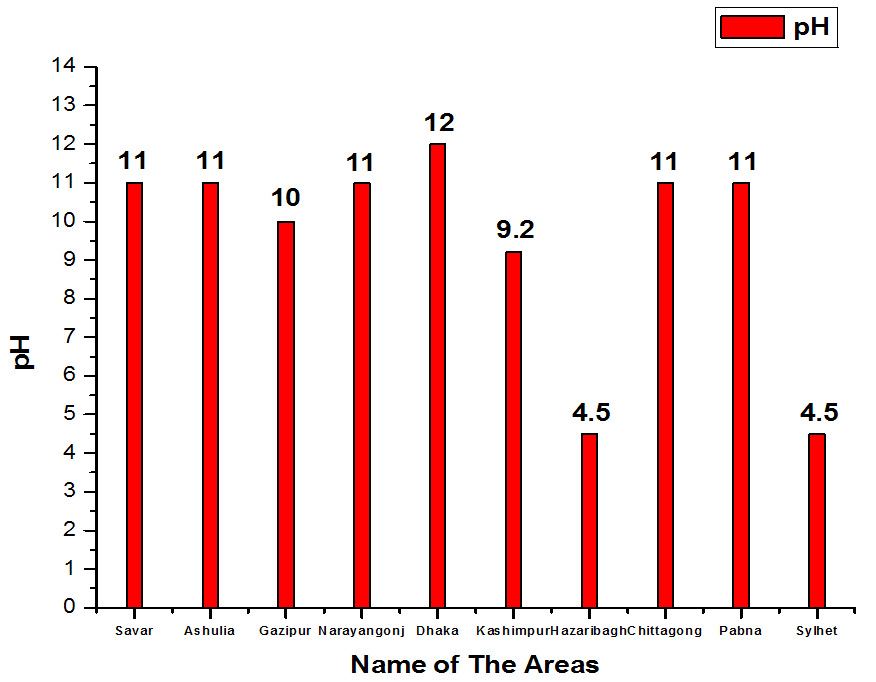 | Figure 26. A bar chart of variation in pH among different areas in 2013 |
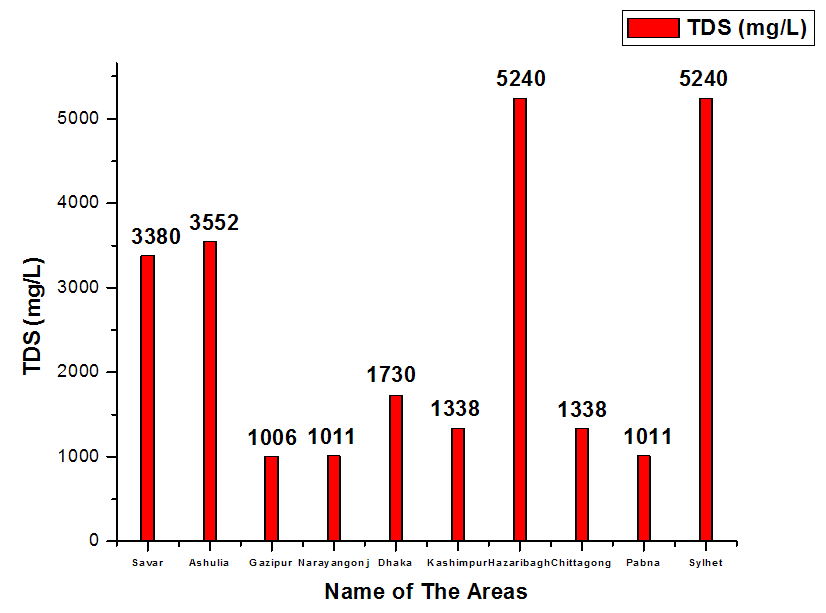 | Figure 27. A bar chart of variation in TDS among different areas in 2013 |
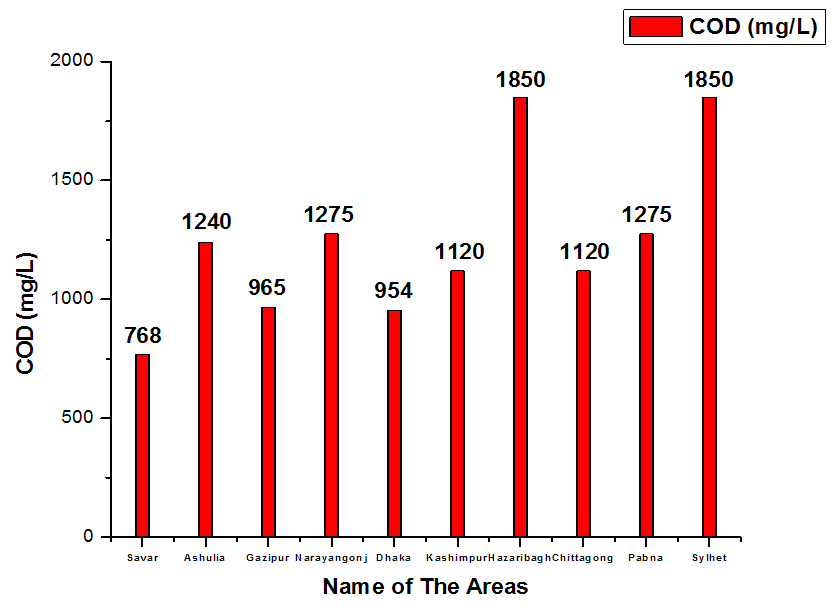 | Figure 28. A bar chart of variation in COD among different areas in 2013 |
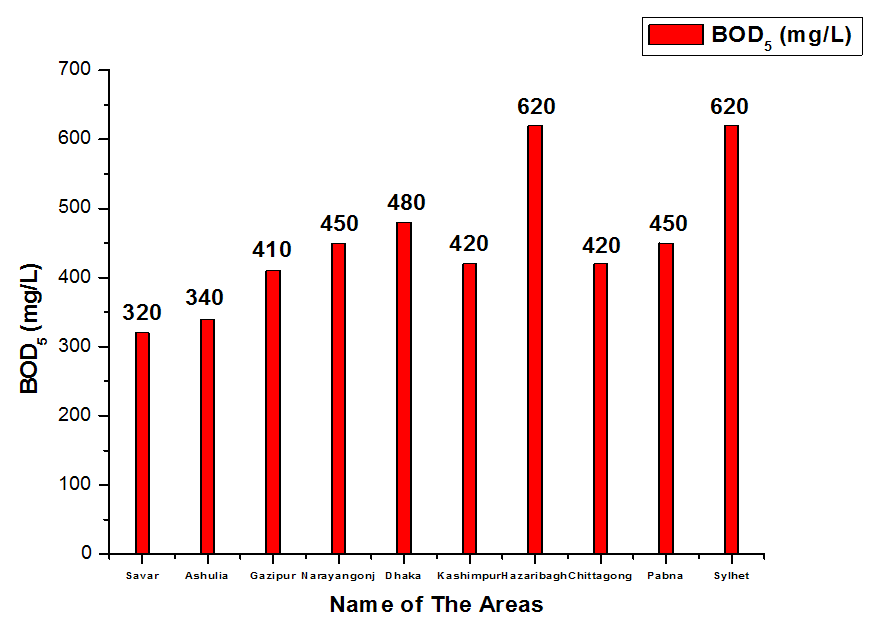 | Figure 29. A bar chart of variation in BOD5 among different areas in 2013 |
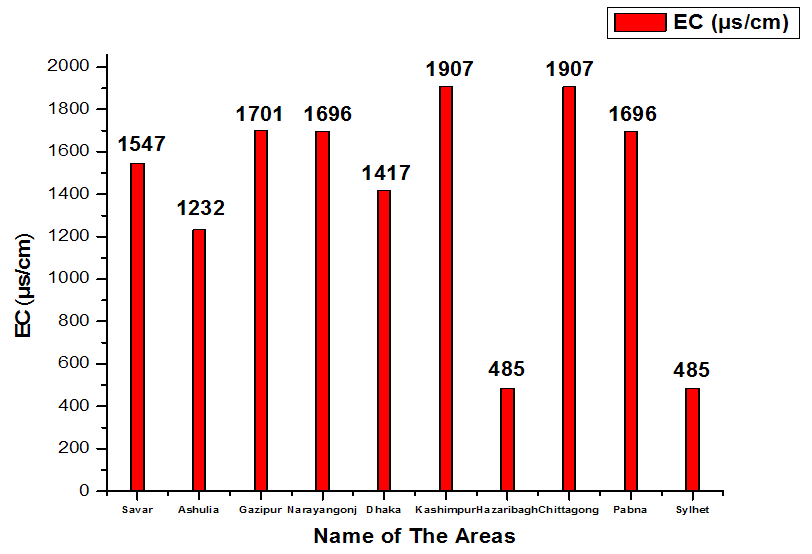 | Figure 30. A column diagram of variation in EC among different areas at the year of 2013 |
 | Figure 31. A bar chart of variation in pH among different areas in 2011 |
 | Figure 32. A bar chart of variation in TDS among different areas in 2011 |
 | Figure 33. A bar chart of variation in pH among different areas in 2010 |
 | Figure 34. A bar chart of variation in TDS among different areas in 2010 |
 | Figure 35. A bar chart of variation in pH among different areas in 2007 |
 | Figure 36. A bar chart of variation in TDS among different areas in 2007 |
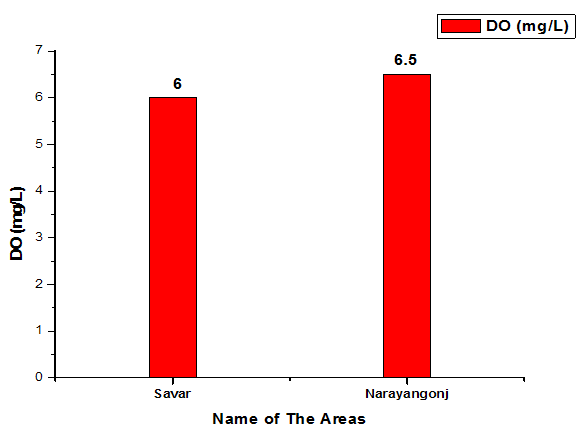 | Figure 37. A bar chart of variation in DO among different areas in 2007 |
 | Figure 38. A bar chart of variation in BOD5 among different areas in 2007 |
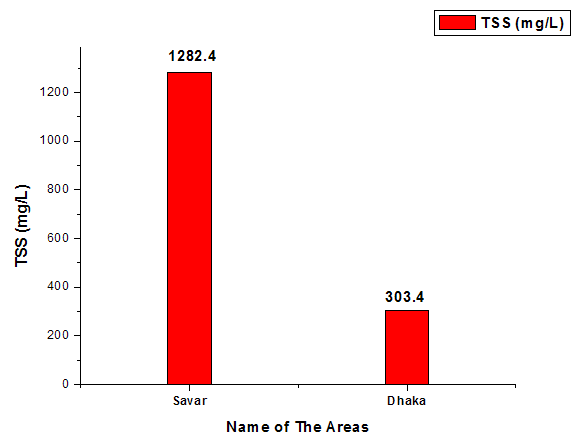
 | Figure 39. A bar chart of variation in TSS among different areas in 2007 |
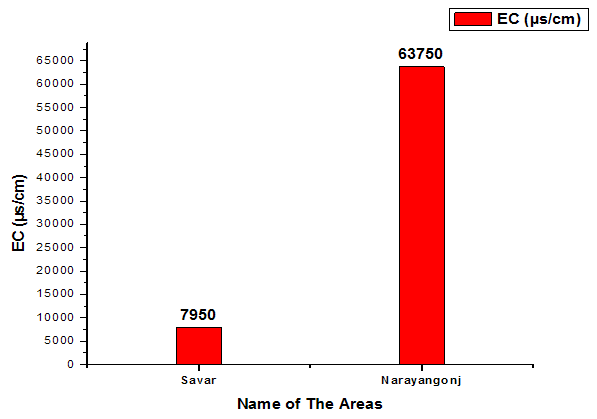 | Figure 40. A bar chart of variation in EC among different areas in 2007 |
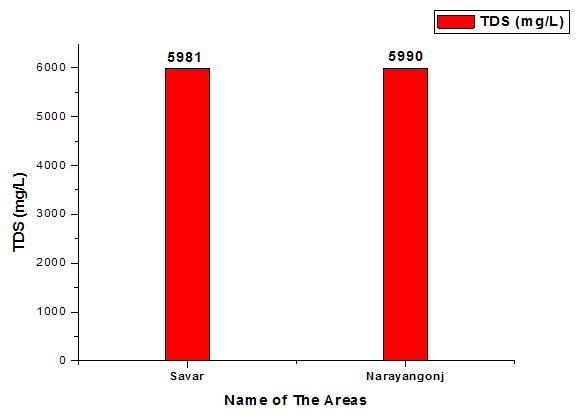
 | Figure 41. A bar chart of variation in TDS among different areas in 2006-2007 |
 | Figure 42. A bar chart of variation in BOD5 among different areas in 2006-2007 |
 | Figure 43. A bar chart of variation in TSS among different areas in 2006-2007 |
|
|
5. Impacts on Environment
- When the effluents are discharged into the river, the heavy metals present are absorbed in the river’s soil and sediments during the dry season, and water evaporation could expose them to the environment. High TSS and TDS detected could be attributed to the high color (from the various dyestuffs being used in the textile mills) and they are the major sources of heavy metals. Increased heavy metal concentrations in river sediments increases suspended solids concentrations. During the dry season, the occasional dust re-suspension introduces these metals into the atmosphere along with the particulates.The products of reactions between some of the chemicals present in the effluents [23] that may be toxic to the environment. Removal of the pollutants from these effluents is the only sure way of safer environment and this can be achieved by proper treatment of effluents to the required level.The most important measure of water quality is the dissolved oxygen (DO) [24]. The low level of DO recorded could result in the non-maintenance of conditions favorable to the aerobic organisms. This could lead to anaerobic organisms taking over with the resultant creation of conditions making the water body uninhabitable to gill-breathing aquatic organisms. Hydrogen sulphide is formed under conditions of deficient oxygen in the presence of organic materials and sulphate. This could be a possible reason for the high sulphide measured in the effluents analyzed. Hydrogen sulphide is formed under conditions of deficient oxygen in the presence of organic materials and sulphate [25]. This is the reason for high sulphide measured in the effluents under analysis. High alkalinity increases with wastewater strength. It shows the capacity of waste waters to neutralize acids, but it is undesirable. Heavy metals in the wastewaters could be of negative impact to the environment, trace heavy metal contamination of an area to industrial effluent. The negative impacts from textile mills effluents could be felt as far as all the regions covered by the River basin, the main receptor of these effluents. High heavy metal concentration has been found in these rivers attributed this to industries. The textile industry generally faces difficulty in meeting wastewater discharge limits, particularly, with regard to dissolved solids, pH, BOD, COD, sometimes, heavy metals and color of effluent [9b]. Effluents from textile industries contain different types of dyes, which because of high molecular weight and complex chemical structures, that show low level of biodegradability.Direct deposition of effluents into sewage networks, produce disturbances in biological treatment processes. Industrial emission and waste effluent generated from factories are associated with heavy disease burden and this could be part of the reasons for the current shorter life expectancy, 61.4 years both for male and female in the country [25] when compared to the developed nations. Some heavy metals contained in these effluents (either in free form in the effluents or adsorbed in the suspended solids) from the industries have been found to be carcinogenic [26] while other chemicals equally present are poisonous depending on the dose and exposure duration.These chemicals are not only poisonous to humans but also found toxic to aquatic life and potential sources of food contamination.Ammonia is harmful to fish or other aquatic organisms at free (un-ionized) concentration of 10- 50 μg/L or higher pH value and the sulphide in the effluent are of environmental concern because they can lead to poor air quality of an area if not properly taken care of thus becoming threat to humans, vegetation, and materials. The same is applicable to pH that has been identified to raise health issues if water available for due to the nature of their operations which requires high volume of water that eventually results in high wastewater generation. They are one of the largest water users and polluters [6].
6. Conclusions
- Textile industry is one of the major industries in the world that provide employment with no required special skills and play a major role in the economy of many countries like Bangladesh. The Textile industry utilizes various chemicals and large amount of water during the production process. The water is mainly used for application of chemicals onto fibers and rinsing of the final products. The waste water produced during this process contains large amount of dyes and chemicals containing traces of metals such as Cr, Cu and Zn which are capable of harming the environment and human health. The textile waste water can cause hemorrhage, ulceration of skin, nausea, skin irritation and dermatitis. The chemicals present in the water block the sunlight and increase the biological oxygen demand thereby inhibiting photosynthesis and reoxygenation.