-
Paper Information
- Next Paper
- Paper Submission
-
Journal Information
- About This Journal
- Editorial Board
- Current Issue
- Archive
- Author Guidelines
- Contact Us
Resources and Environment
p-ISSN: 2163-2618 e-ISSN: 2163-2634
2014; 4(5): 220-233
doi:10.5923/j.re.20140405.03
Assessment of Water Availability in the Sokoto Rima River Basin
 Abstract
 Reference
 Full-Text PDF
 Full-text HTML
Abdullahi S. A.1, Muhammad M. M.1, Adeogun B. K.1, I. U. Mohammed2
1Department of Water Resources and Environmental Engineering, Faculty of Engineering, Ahmadu Bello University, Zaria, Nigeria
2Department of Water Supply and Sanitation, National Water Resources Institute, Kaduna, Nigeria
Correspondence to: Abdullahi S. A., Department of Water Resources and Environmental Engineering, Faculty of Engineering, Ahmadu Bello University, Zaria, Nigeria.
| Email: |  |
Copyright © 2014 Scientific & Academic Publishing. All Rights Reserved.
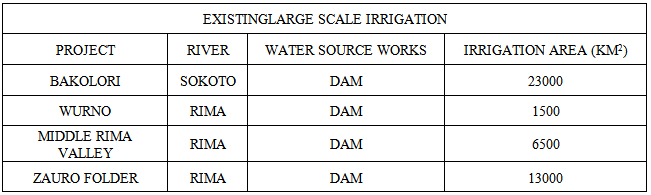
The Sokoto-Rima River basin is located in the north western part of Nigeria, which comprise of four (4) states (i.e Sokoto, Kebbi, Katsina and Zamfara) and have population of more than 15million according to 2006 census. This makes the rivers and streams within the basin to be very important source of fresh water to the people living in those states. Therefore, even small decrease in runoff within the basin could have dramatic effects on the water supply of the region. This paper assesses and evaluates the impact of climate change on water availability and investigates the sensitivity of the basin to climate change in Sokoto-Rima river basin using the Water Evaluation and Planning (WEAP) model. This model allows the simulation and analysis of various water allocations and scenarios. The hydrological processes that occur for the six major rivers within the basin during 1970 to 2013 was satisfactorily model and calibrated by visual observation and compared with the measured data. The calibration process of the model was done using the first twenty two years climatological records (1970-1992) and validated with the remaining data (1993-2013). Simulations are proposed for various climatic situations considering the global climatic models (GCM) predictions. Six (6) developed climate change scenarios of temperature increase (0, +0.5, +1 oC) coupled with decrease or increases in precipitation (0,-10%, +10%) were combined and applied for the study area in the WEAP model for simulation. Then, the climatically affected runoff, evapotranspiration, and water demand series were obtained as output of the WEAP model. Results indicate that climate change will significantly reduce the runoff, and increase evapotranspiration and water demand in the basin, more especially the demand for irrigation. The results indicate an annual reduction in the total available water of about 1.70 billion cubic meter and monthly water demand of 17.11 Billion Cubic Meter for the month of April (which is the driest month in the basin) for the selected sites under 10% reduction in the actual rainfall within the basin and increase in evapotranspiration under 1oC increase in temperature, this indicate reduction of the surface water in the future for the basin. In addition, the dependency of the basin on surface water sources make it imperative to apply some methods of efficient use of water resources in the basin to ensure future sustainability. To adapt to the current trend and minimize the significant impact on availability of water supply in the basin in the foreseeable future, some proposed adaptation and mitigation measures to remedy this trend of scarcity ranges from sustainable developments to collaborative planning among the stakeholders within the basin.
Keywords: Climate, River basin, Availability and Planning
Cite this paper: Abdullahi S. A., Muhammad M. M., Adeogun B. K., I. U. Mohammed, Assessment of Water Availability in the Sokoto Rima River Basin, Resources and Environment, Vol. 4 No. 5, 2014, pp. 220-233. doi: 10.5923/j.re.20140405.03.
Article Outline
1. Introduction
- Climate in a narrow sense is usually defined as the average weather, or more rigorously, as the statistical description in terms of the mean and variability of relevant quantities over a period of time ranging from months to thousands or millions of years. The classical period for averaging these variables is 30 years, as defined by the World Meteorological Organization. The intergovernmental panel on climate change (IPCC) developed the variation of the earth temperature for the past 140 years.As climatic variability intensifies, changes in atmospheric conditions have altered water resources, their distribution in space and time, the hydrological cycle of water bodies, water quantity and, in more recent time, water supply systems and requirements for water resources in the Sokoto-Rima river basin, creating serious water shortages for household needs, agriculture and industry. With further significant variations in the climate of the Sahel being predicted by General Circulation Models (GCMs) (IPCC, 2007), it is important that scientific studies be undertaken at regional levels so as to provide society with accurate information on the real and potential impacts of climate change, as well as, the mitigation and adaptation options available. (Ekpoh and Ekpenyong, 2011).The Sokoto-Rima River basin is located at north western part of Nigeria and it covers four (4) states (i.e Sokoto, Kebbi, Katsina and Zamfara) that have ninety two (92) local government areas for administrative purpose. This makes the rivers and streams within the basin to be the important source of surface water to the people living in those states. Therefore, even small decrease in runoff within the basin could have dramatic effects on the water supply of the region.To address this need, this study evaluates the impact of climate change on available water resources in the six main rivers of the Sokoto-Rima river basin using a decision support system known as the Water Evaluation and Planning (WEAP) Model. WEAP is an analytical framework developed for the evaluation of climate change and other drivers that water managers commonly confront (Yates et. al., 2006). Indeed, WEAP model is one of the useful tools for the integrated water resources management and it can be used as a database for the forecasting and also as a policy analysis tool, depending on the focus of the study. In this regard, the applicability of WEAP in assessing the impact of climate change as well as its main function of the sophisticated water allocation model is tested in this study.
2. Statement of the Problem
- According to Ringiuset, et. al. (1996) although climate change is expected to affect many sectors of the natural and man-made environment, water is considered to be the most critical factor associated with climate impacts. A similar idea is also highlighted by Houghton (1997) who stated that the most important impact of global warming is on water supplies which are in any case becoming increasingly critical in many places. In the continent of Africa, the observational records show that the climate has been warming through the 20th century at the rate of about 0.05°C per decade (IPCC, 2001).In contrast to the assessment of global or large scale variations of the climate driving forces for global hydrology, the impact of climate change on the regional hydrology is still unknown for most regions of the world (Kim et. al., 2006). Although climate change is a global phenomenon, the trends and impact may be different on a local scale.
2.1. Aims and Objectives of the Study
- The aim is to analyse how sensitive is the Sokoto-Rima River basin to climatic change with regards to its water availability by developing a Model of the basin using WEAP, and propose some mitigation measures that can minimize the negative impact within the basin by the principle of mass balance of the hydrologic quantity of the whole area. While the objectives are:i) To analyse the present situation of Sokoto-Rima River Basin in order to evaluate the present hydrological condition of the entire basin. ii) To measure water availability and demand for each sub-basin within the entire River Basin by considering watershed characteristics and the demographic trends.iii) To develop water resources WEAP model for the Sokoto-Rima river basin in order to evaluate the impact of climate change for current and future water availability using water balance concept. iv) To produce a simulation of the projected water availability and to compare the water availability with and without the effect of climate change in the study area and analyse the water resources trend in the part of the basin towards 2100.
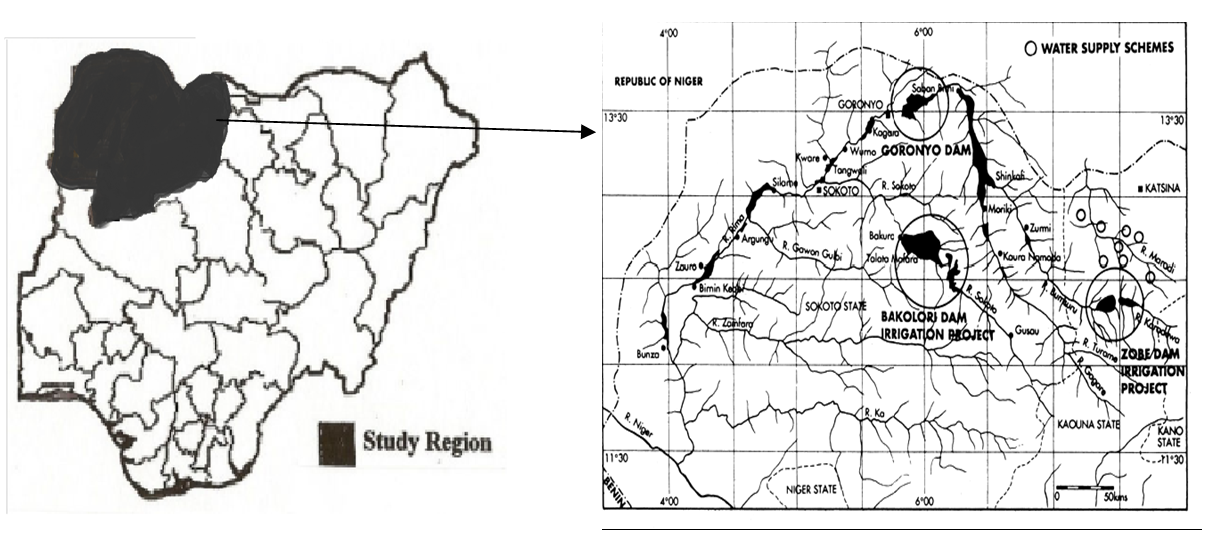 | Figure 1. Sokoto-Rima River Basins in Nigeria |
2.2. Description of the Study Area
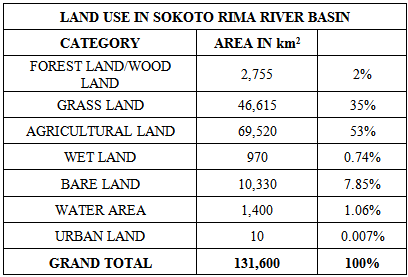
- The study area is Sokoto-Rima River Basin located in the North-Western region of Nigeria, the area is found between latitude 10° 04’ N and Longitude 3° - 8° 14’ E. The area covers a land area of approximately 131,600 km2 and shares its borders with Niger Republic to the north, and covers Sokoto, Kebbi, Zamfara and large part of Katsina States to the East; it also borders Niger State to the South-east, and Benin Republic to the west. The whole basin can be described as Sudan and Sahel Savanna, and it extends beyond the border to Niger republic and the northern part of Benin Republic. The basin topography consists of a vast floodplain (fadama land) and rich alluvial soils that is suitable for the cultivation of different variety of crops. There are also isolated hills (inselberg) and hill ranges scattered all over the area (Ekpoh and Ekpenyong, 2011).
2.3. Physical Features of the Study Area
- The Sokoto basin falls within the hottest parts of Nigeria. The critical zone, located above latitude 10°N, belongs to the Sahel region of Africa, an area most affected by the droughts. Temperatures are generally extreme, with average daily minimum of 16℃ during cool months of January and December, and in the hottest month of April to June, an average maximum of 38℃ and minimum of 24℃. Throughout the year the average maximum is 36℃ and average daily minimum is 21℃. Rainfall is generally low.The average annual rainfall for 35 years is about 470mm. Much of the rain falls between the month of may to September, while the rainless months are October to April. Evaporation is high ranging from 80mm in July to about 210mm in April to May. A monthly average evaporation range of about 140mm represent 30% of monthly average precipitation into the catchment. The hottest months of April to May are periods of highest evaporation. Relative humidity is low most of the year and only increases during the wet seasons of June to September. The vegetation is typically Sudan savannah and is characterised by stunted and thorny shrubs, invariably of the acacia species.
2.4. Description of Climate of the Basin
- Like the rest of West Africa, the climate of the region is controlled largely by the two dominant air masses affecting the sub-region. These are the dry, dusty, tropical- continental (cT) air mass (which originates from the Sahara region), and the warm, tropical- maritime (mT) air mass (which originates from the Atlantic Ocean). The influence of both air masses on the region is determined largely by the movement of the Inter-Tropical Convergence Zone (ITCZ), a zone representing the surface demarcation between the two air masses. The interplay of these two air masses gives rise to two distinct seasons within the sub-region. The wet season is associated with the tropical maritime air mass, while the dry season is a product of the tropical continental air mass. The influence and intensity of the wet season decreases from the West African coast northwards. In terms of climatic statistics, the annual rainfall for Sokoto ranges between 300 mm and 800 mm. The mean annual temperature is 34.5℃, although dry season temperatures in the region often exceed 400C. (Ekpoh and Ekponyong, 2011)
2.5. Description of Hydrology of the Basin
- The basin is essentially drained by the river Sokoto, a prominent part of Niger river drainage system. The sokoto river rises with its main tributaries, the Ka, Zamfara, and Rima from the 600 to 900 meters high Mashika and Dunia highland areas bordering the eastern part of the basin, and flows down, rather sluggishly down a gentle slope toward the northwest, where around Sokoto town, it is joined by the Rima in the north, making a southward swing, collecting the Zamfara and Ka before entering in to the river Niger. The river systems, thus effectively drains the whole basin. At the source areas in the east, the Sokoto river system is only seasonal. However in the western parts of the basin, the river becomes perennial as it begins to receive substantial ground water contribution to its flow.
2.6. Description of Land Use and Land Cover of the Basin
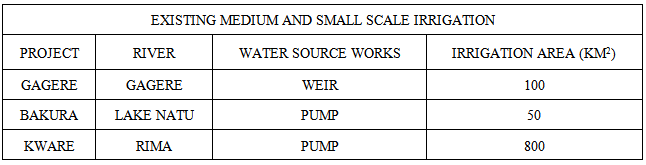
- The land use and land cover within the basin are grouped in to five major categories: Settlements, Agricultural Land, Vegetal Cover, Water Bodies and Bare and Rocky Surfaces. Agricultural land is divided in to three categories: (a) “Fadama”, or land which historically has been seasonally flooded or irrigated; (b) “Tudu” , or land which lies above the flood plain and is dependent on rainfall for its moisture; and (c) land farmed by modern methods of irrigation for example Talata-Mafara Irrigation scheme.
|
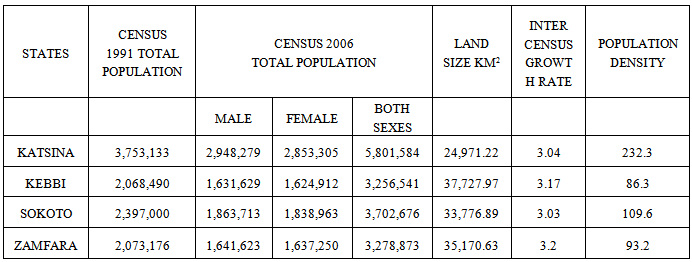
2.7. Description Demography of the Basin
- In 1991, the population in the states of Katsina, Kebbi, Sokoto, and Zamfara total to 10,291,799 people, and consists of Urban and rural population. While the total population according to 2006 census for those states total to 16,039,674 people, as shown in table 2 below. The whole states within the basin have an average inter census growth rate of 3.11 and the vaerage population density of 130.35 in the year 2006.
|
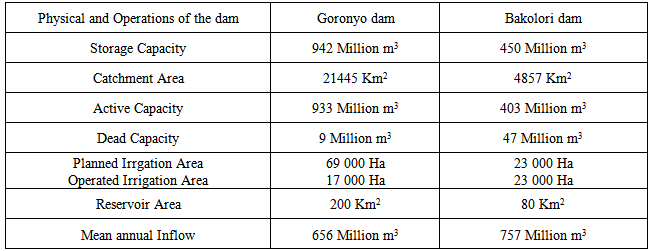
2.8. Existing Water Infrastructure within the Basin
- The two major dams in the Sokoto-Rima River Basin are the Bakolori and Goronyo dams. The Bakolori Dam is in Zamfara state, it was completed in 1978 and its reservoir filled by 1981. It is a major reservoir on the Sokoto \River, a tributary of the Rima River, which in turn feeds the River Niger. Water from the dam supplies the Bakolori Irrigation Project in TalataMafara. The dam has a capacity of 450 million cubic meters, with a reservoir covering 8,000 hectares extending 19 km (12 mi) upstream.
|
|
|
3. Materials and Methods
3.1. Materials
- The Materials used for this research are:i. Hardware and software:- (a) The Hardware used is “HP Pavillion dv6” Laptop computer with window 7 installed as the operation system. (b) The softwares used are GIS-ILWIS, WEAP and Microsoft Excel (Microsoft Office Package).ii. Large flow Current Meter for measurement of velocity of flow in the river and determination of discharge, in using it a thread was used to determine a straight cross section line and divide the cross-section in to equal area and a measuring tape was used for measuring distances.iii. Internet used for research.
3.2. Methods
- A water allocation modeling approach is adopted for this study. First the model is applied to determine the surface water resources availability for the current situation and under the future changes of climate. Secondly, the model is used to analyse the linkage between the water resources and the demand in each region or local government based on the population changes in the whole basin. (a) Data collection as preliminary investigation and analysis from the area was achieved by: (i) Recognisance survey of the whole River Basin and its surrounding Sub-Catchment areas. (ii) Collecting the Hydrological and hydraulic data from data stations in the area. The monthly average rainfall data, the monthly average hydraulic data and the climatic data which include Monthly average temperature for identified major data stations in the sub-catchments for the period of 1970 – 2013 was obtained from the following data stations:(1) Birni-N'Konni, Niger, latitude: 13-48N, longitude: 005-15E, and elevation: 272m(2) Gaya, Niger, latitude: 11-53N, longitude: 003-27E, and elevation: 202 m(3) Sokoto, Nigeria, latitude: 13-01N, longitude: 005-25E, and elevation: 302 m(4) Gusau, Nigeria, latitude: 12-16N, longitude: 006-07E, and elevation: 469 m(5) Yelwa, Nigeria, latitude: 10-88N, longitude: 004-75E, and elevation: 24 m and used for the analysis, the locations are shown in the figure 4 below.(b) GIS-ILWIS software was used to digitalize the hydrologic map, land use map, and local government administration map of the area and convert them to shape file (i.e .shp file) that can be accepted by the WEAP software.(c) Water demand for agriculture and consumption in each subcatchment and the whole stretch of Sokoto Rima River basin was obtained using population and the existing land use and the hydrological characteristics of the catchment.(d) The Modelling: The hydrological and hydraulic data obtained and the parameters of a hydrological model in the study area will be used in soil moisture method of Rainfall runoff to generate current stream flows as the model of available water in the area.
 | (1) |
 | (2) |
 (mm) for land cover fraction, j, the effective precipitation, Pe, excluding the snowmelt since snow is not experienced in the study area.Methods for Generating Climate Scenarios Adopted in the Study:
|
2.3. Development of Weap Model
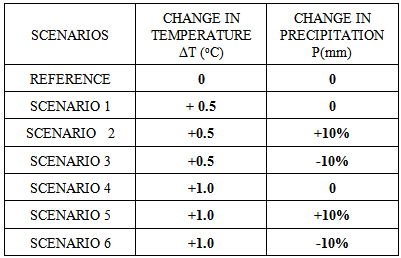
- For the analyses of hydrological processes in the sokoto-rima river basin, all natural hydrological watershed details and infrastructure for water resources management are represented in the WEAP model. The schematic representation is shown in figure 2 below:
 | Figure 2. The Schematic View of the Rivers in the Study Area |
2.4. Analysis of Climate Change Impact on Water Availability
- The final stage is to quantify the water availability in all scenarios from the simulation of the model. The water availability within the catchments was evaluated based on the following output of the WEAP model:Total available water within the catchment under a scenario – The total water demand within the catchmentThe water availability in each scenarios then being analysed in order to evaluate the sensitivity of the study area to climate change based on the relation:
 | (3) |
2.5. Water Year Method
- The water year method is a means to represent variation in climatic data like stream flow and rainfall. The method involves defining how different climatic regime (e.g Very Dry, Dry, Very Wet, Wet) compare relative to normal year, which is given a value of one (1). Normal water year define each non-Normal water year type (Very Dry, Dry, Wet, Very Wet), specify how much more or less water flows into the system in that year relative to a Normal water year. Dry years have a value less than one (< 1), Very wet have a value greater than one (> 1) For example, if a Wet year has 35% more inflow than a Normal year, 1.35 will be entered for the Wet year. These fractions are derived from a statistical analysis of historical rainfall data obtained. First the years are grouped into five bins (quintiles), then how they vary from the norm are computed using the mean value of the entire data as shown in the figure 3 below.
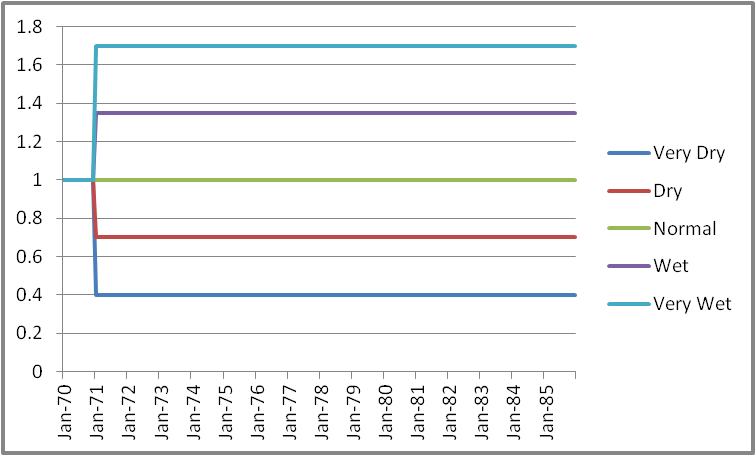 | Figure 3. Water Year Values |
3. Results and Discussion
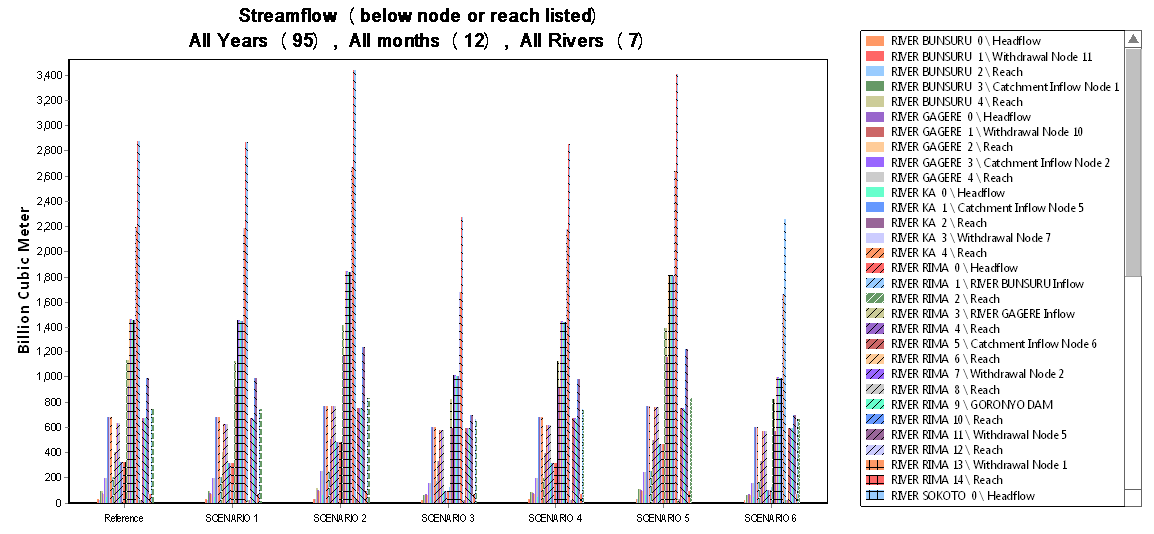
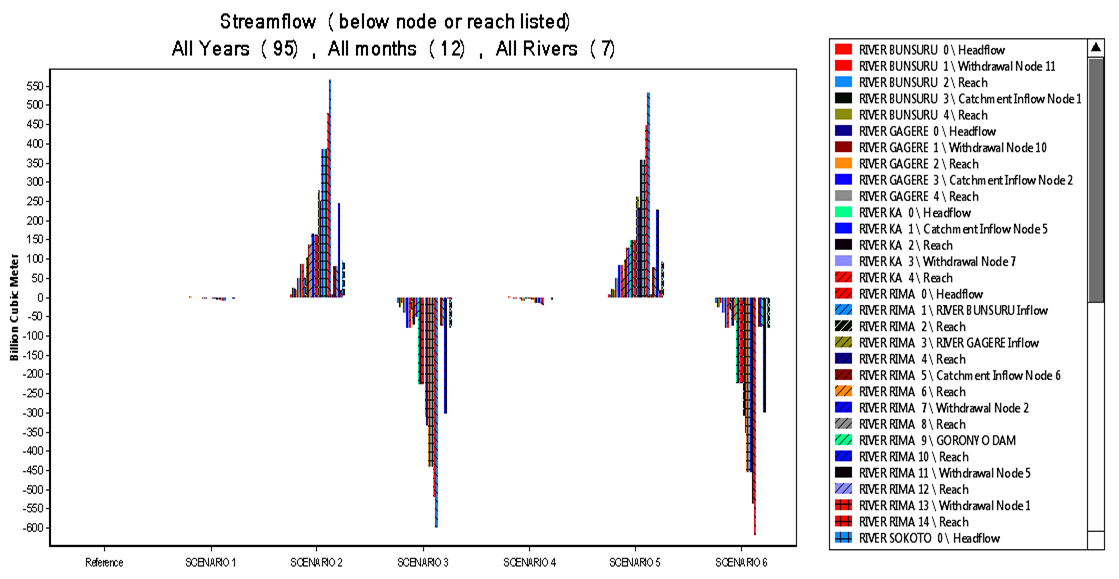
- The six major rivers within the basin are delineated in the WEAP as shown in figure 4 and 5 following their location on the base map developed in GIS using the map of North-Western region of Nigeria, the area is located between latitude 10° 04’ N and Longitude 3° - 8° 14’ E.The land use, present water abstractions and water infrastructures were superimposed on the naturalised hydrology in WEAP to simulate the basin’s water resources. The model simulation was assessed against observed stream flow data for gauges located at some stations within the basin.Stream flow Simulation: The data of 1970 to 1989 was used to set up the model and validated with the streamflow data of 1970 to 2013. The model was also calibrated with average coefficient of determination (R2) of 0.04, and percentage error in total runoff volume (VE) around 19% and percentage error in peak discharge (PE) of around 17%. After calibration the model was validated with the actual measurement of streamflow at ten various points on the rivers within the basin.Based on the simulation and comparison of the sreamflow within the basin for the reference scenario and scenarios 1 to 6, it was observed that the effect of the climate change is not uniform. The difference in water availability from the scenarios depends on the section of the stream observed. As shown in figure 6 below, the difference in water volume from the reference scenario to the worst scenario (scenario 6) at river Bunsuru is not much but on reaching the river Rima the difference is around 391 Billion Cubic Metres in 44 years simulation, indicating a reduction of 8.9 Billion Cubic Metre of water annually While the difference at river Sokoto is 1183 Billion Cubic Metres under the same period, indicating a reduction of 26.9 Billion Cubic Metre of water from the annual flow in that river, see figure 4 to 6 below.
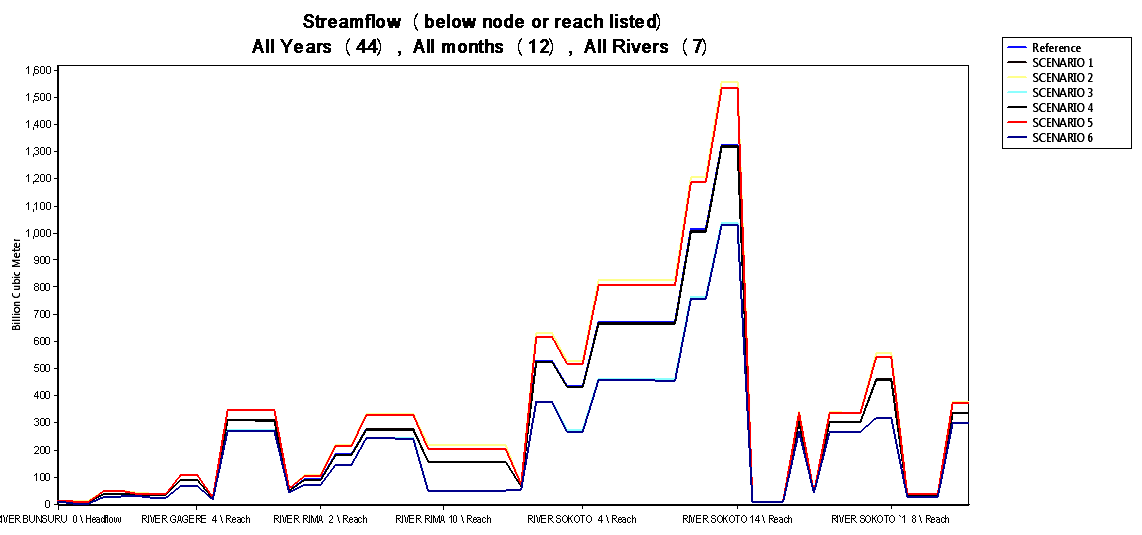 | Figure 4. Streamflow for the basin |
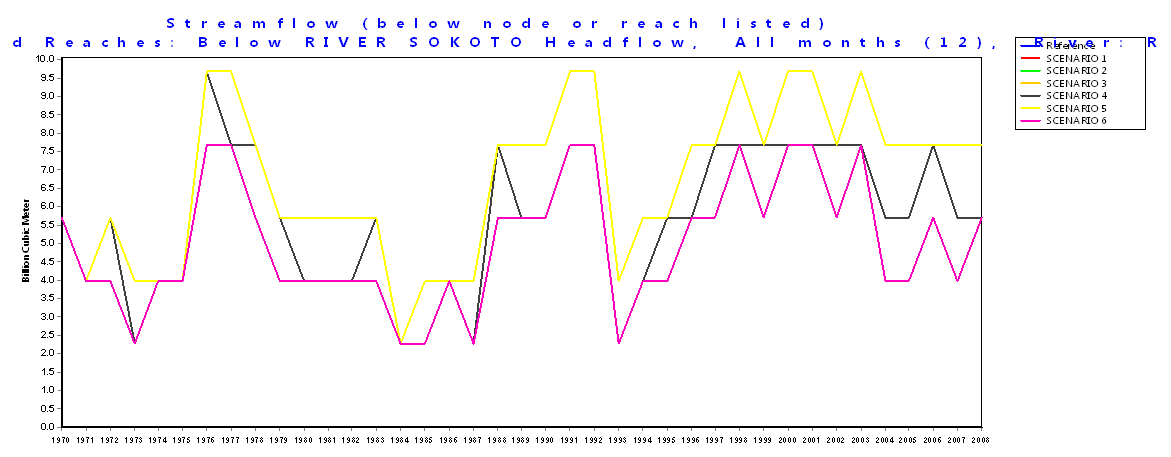 | Figure 5. Streamflow below river sokoto for all scenarios |
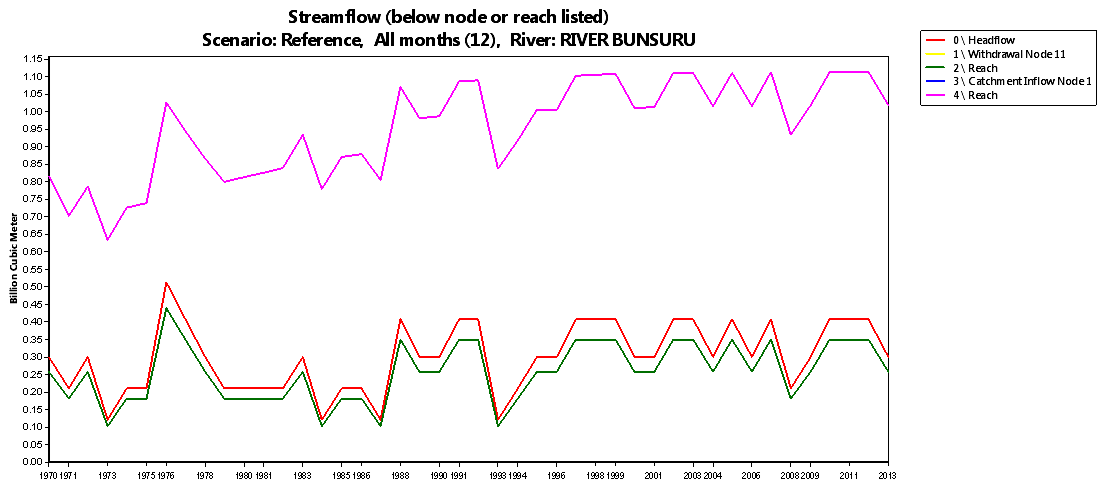 | Figure 6. Streamflow at Bunsuru for Reference scenarios |
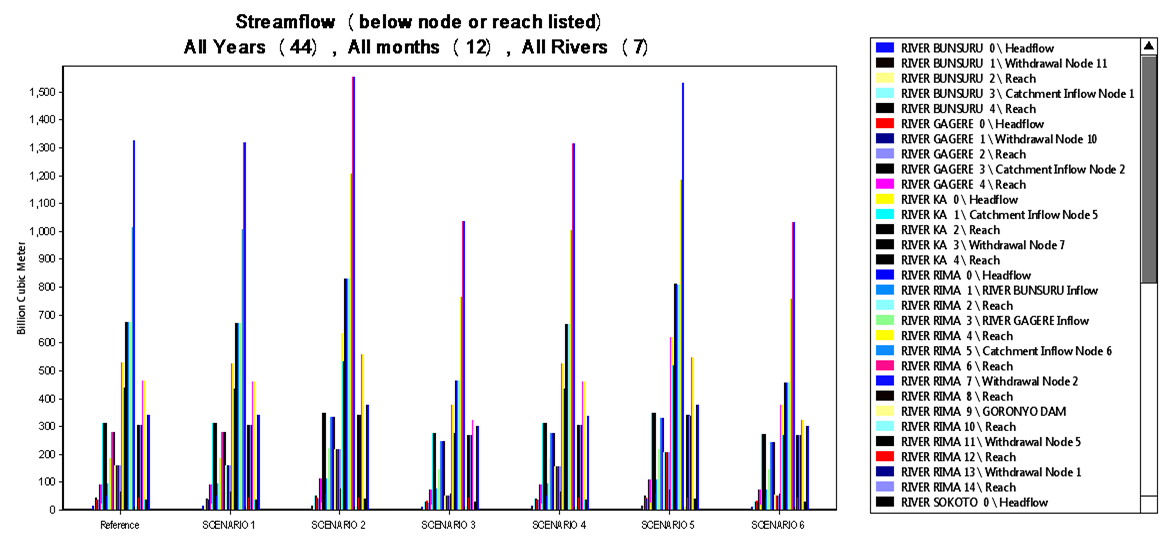 | Figure 7. Streamflow for all scenarios |
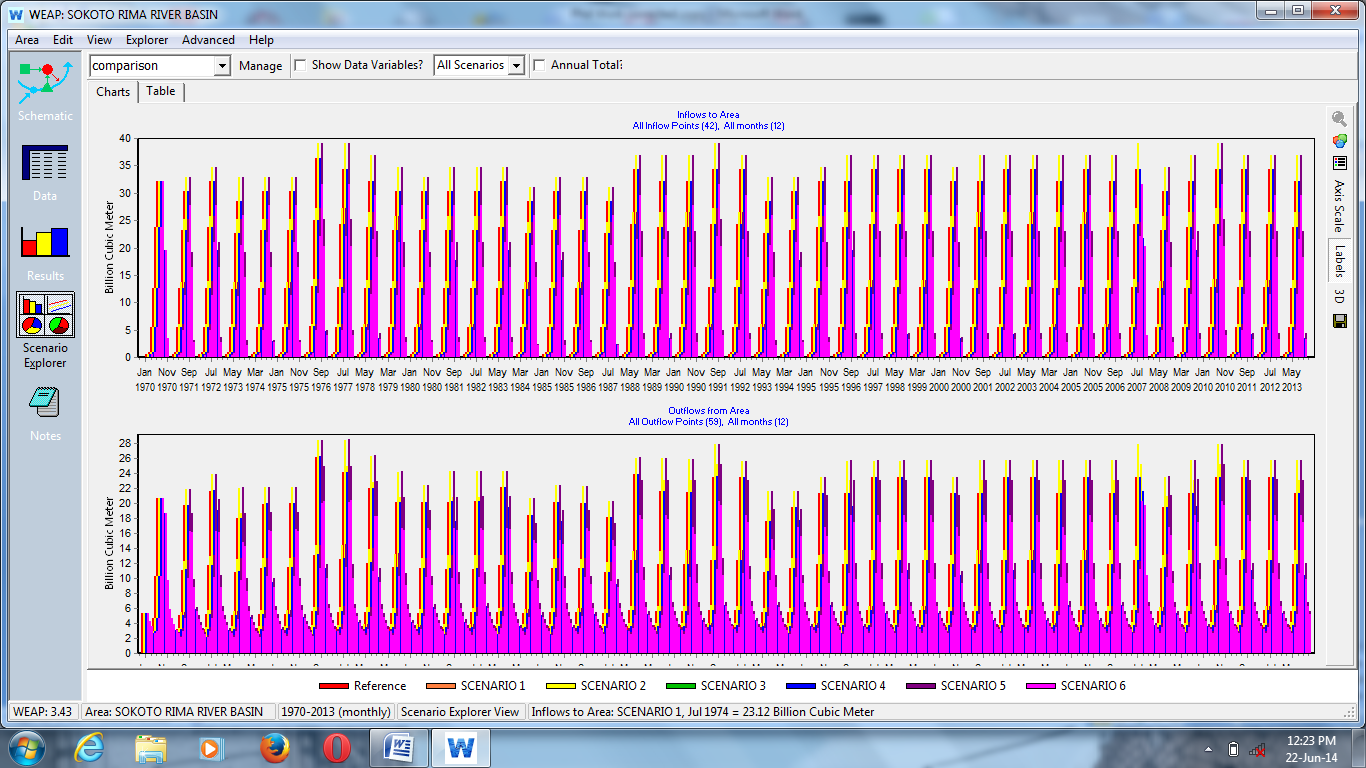 | Figure 8. Streamflow for all scenarios Inflow and outflow |
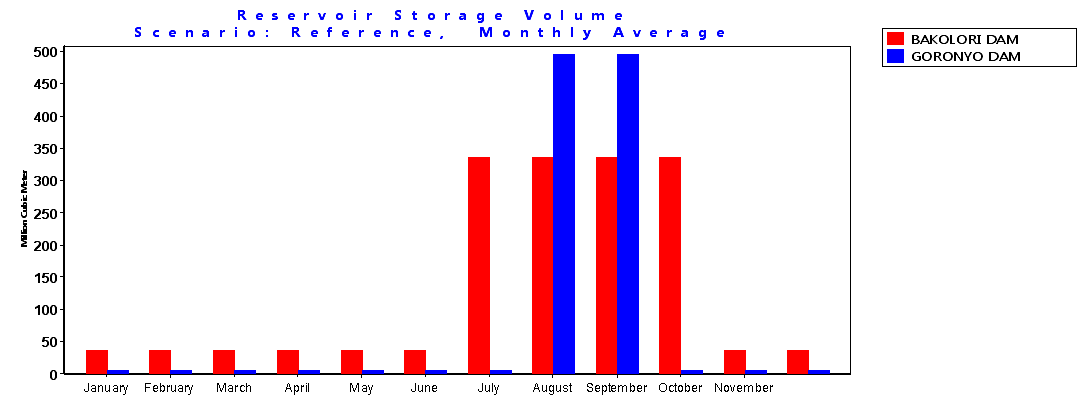 | Figure 9. Average monthly reservoir storage volumes |
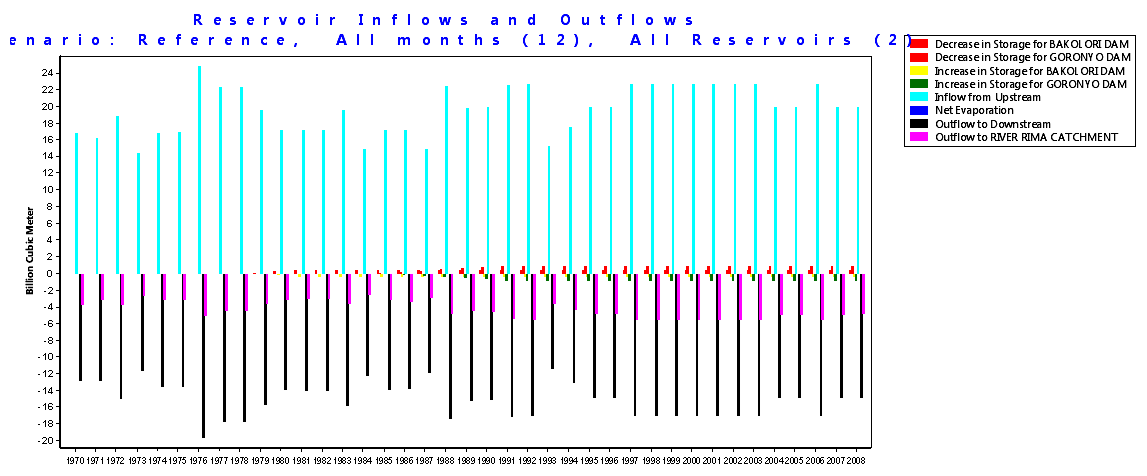 | Figure 10. Reservoir inflow and outflow |
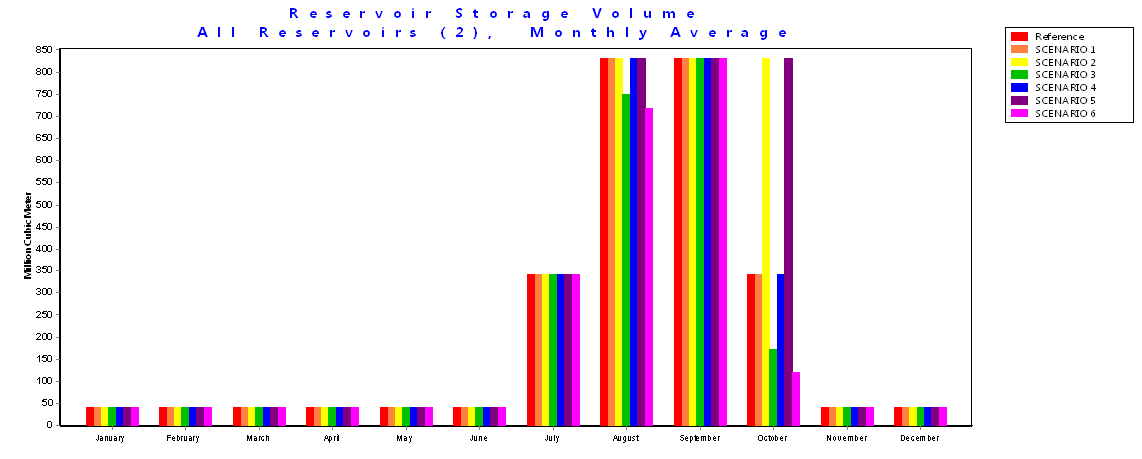 | Figure 11. Average reservoir storage volume for all scenarios |
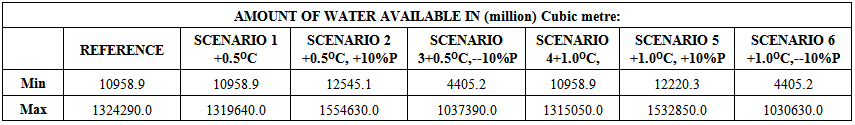 | Table 7. Effect of different climate scenarios to water availability based on the simulation of the sources for all rivers |
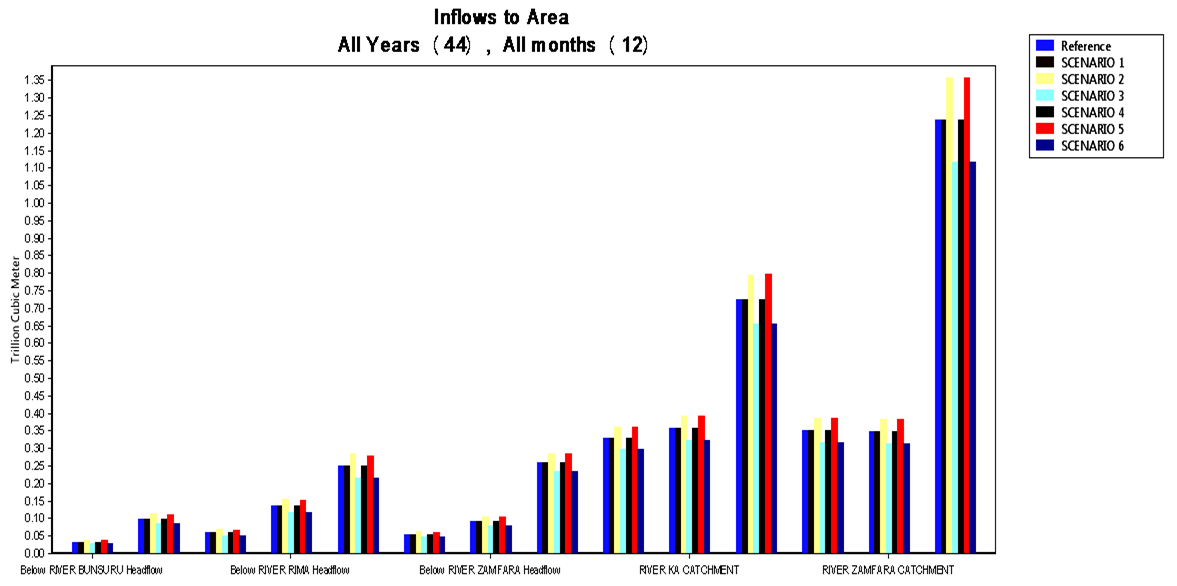 | Figure 12. Inflow water volume for all scenarios |
 | Figure 13. Streamflow from rivers for all scenarios projected to 2064 |
 | Figure 14. Streamflow from rivers for all scenarios compared with reference scenario projected to 2064 |
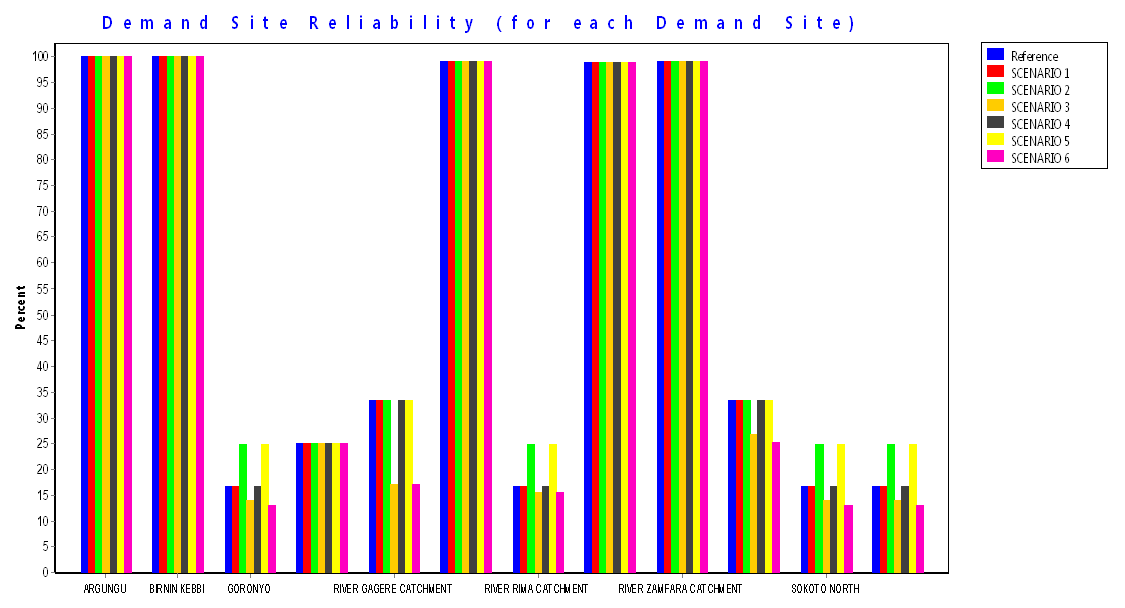 | Figure 15. Demand sites Reliability for all scenarios |
4. Conclusions and Recommendations
4.1. Conclusions
- A model of the Sokoto-Rima River Basin was successfully set up and a scenario analysis carried out under possible impact of climate change. However, despite the quality of checked and justified assumptions made on the data used, errors would be inherent. Therefore, the results of this Study should be viewed with caution at this stage. Nonetheless, the results indicate an annual reduction in the total available water of about 1.70 billion cubic metre and monthly water demand of 17.11 Billion Cubic Meter for the month of April (which is the driest month in the whole basin) selected sites under 10% reduction in the actual rainfall within the basin and increase in evapotranspiration under 1oC increase in temperature, this indicate reduction of the surface water in the future for the basin. In addition, the dependency of the basin on surface water sources make it imperative to apply some methods of efficient use of water resources in the basin to ensure future sustainability.This Study has initiated setting up of a model for the basin which encompasses hydrology and some aspects of water management on a single platform. It also presents the strong ability of WEAP in modelling complex water systems thus providing an opportunity for rapid assessment of the state of existing water resources via scenario analyses.
4.2. Recommendations
- The potential adaptation measures recommended for the Sokoto Rima river basin to conserve its surface water supply and minimize the investigated trend of surface water flow based on this research are as follows:1. Increase in water use efficiency and storage by using new improved method of irrigation.2. Using new improved varieties of different crops species that does not require plenty of water in their production by the farmers within the basin, to reduce evapotranspiration.3. Increasing the forested area and reducing the impervious area by planting more trees to help in percolating more water in to the soil an entrapping it.4. Making a proper plan for the existing reservoirs to maintain adequate flow in to downstream throughout the year.5. Creating more underground storage facilities (i,e underground reservoirs).6. Collaborative planning in using the surface water among the stakeholders within the basin.