-
Paper Information
- Paper Submission
-
Journal Information
- About This Journal
- Editorial Board
- Current Issue
- Archive
- Author Guidelines
- Contact Us
Resources and Environment
p-ISSN: 2163-2618 e-ISSN: 2163-2634
2014; 4(3): 168-172
doi:10.5923/j.re.20140403.05
Evaluation and Assessment of Drinking Water Quality in Shahrekord, Iran
Abdolmajid Fadaei, Mehraban Sadeghi
Department of Environmental Health Engineering, School of Health, Shahrekord University of Medical Sciences, Shahrekord, 8813834435, Iran
Correspondence to: Abdolmajid Fadaei, Department of Environmental Health Engineering, School of Health, Shahrekord University of Medical Sciences, Shahrekord, 8813834435, Iran.
| Email: |  |
Copyright © 2014 Scientific & Academic Publishing. All Rights Reserved.
The aim of this study was to determine the physico-chemical and microbiological quality of drinking waterquality in Shahrekord. For this purpose, 235 samples water from were taken either at the consumer's tap, or from well water. The analysis showed that concentration levels of total coliform bacteria (mean: 9±5 MPN/ 100 ml) exceeded the limits and F-(mean: 0.20±0.1mg/L) below the desirable limits of WHO and Iran in certain wells, while E.coli, pH, turbidity, total hardness, SO42-, Cl-, Mg2+, NO3-, TDS, Ca2+, Sb, Se, V, Cr, Zn, As, Mo and Cu were well within the limits. Our results show that the physical and chemical quality of the waters of Shahrekord was high quality.
Keywords: Drinking water quality, Microbiological,Physico-chemical
Cite this paper: Abdolmajid Fadaei, Mehraban Sadeghi, Evaluation and Assessment of Drinking Water Quality in Shahrekord, Iran, Resources and Environment, Vol. 4 No. 3, 2014, pp. 168-172. doi: 10.5923/j.re.20140403.05.
Article Outline
1. Introduction
- Safe and good quality drinking water is one of the most important human needs.Physical, chemical and biological characteristics of water are considered as a main health controlling factor and the state of disease in the living organisms (Kazi et al. 2009).Surface water includes water that flows across the land in the form of streamlets, springs, streams and rivers or it collects to form ponds, lakes and seas. In contrast, groundwater is located in aquifers underground and links with surface water through penetration and springs. Anthropogenic activities such as urbanisation, industrialization, agriculture and deforestation influence the characteristics. Anthropogenic chemicals that adversely affect drinking water quality are most commonly polar to semi-polar, organic compounds that are present in environmental waters at concentrations in the pg/L to µg/L range and are commonly referred to as micropollutants. With increase of micropollutants being identified in water resources, new strategies are needed to provide cost-effective and sustainable remediation solutions (Munab et al. 2009; Muhammad et al. 2011). Degradation of water quality due to agricultural activities is a global problem of surface water.Supply of drinking water is important to the development of any country, but when polluted it may become the source of undesirable materials hazardous to human health. Potable water supports public health and ensures economic growth. Water contaminated can cause social and economic damages through water-related diseases such as Dysentery, Typhoid fever, Hepatitis A, Poliomyelitis, Vibrio Illness, E. coli Infection and increases medical treatment costs (Mohsin et al. 2013; Rossi et al. 2012).Governments of many developing countries consider the provision of safe water supplies as one of their major responsibilities. In developing countries most of the people do not have access to safe drinking water. Drinking water contaminated with animal and human feces is the major route of transmission of pathogens to human beings. Alternative water supply, deficiency chlorination and sewage flooding seem to be associated with self-reported diseases (Abu-Amr and Yassin. 2008; Emmanuel et al. 2009).Most of the parameters selected for analysis are obligatory from the Directive, comprising both physicochemical (such as pH, conductivity and total dissolved solids-TDS) and chemical properties which are related to the treatment of water itself and its hardness (Cl-, Na+, K+, Ca2+ and Mg2+), heavy metals (Cd, Pb, Cu, Cr and Ni), ions (F-, NO2-, NO3-, Br-, PO43-, SO42- and NH4+) as well as dissolved organic carbon (DOC). Has significant adverse effects on human health either through deficiency or toxicity due to excessive intake. Nitrate (NO3) and nitrites (NO2) are found naturally in water (Jordao et al. 2002) and the toxicology of nitrate to humans is mainly attributable to its reduction to nitrite. The major biological effect of nitrite is its involvement in the oxidation of normal hemoglobin to methaemoglobin, which is unable to transport oxygen to the tissues. The dominant human health risk associated with nitrate consumption is considered to be of methaemoglobinaemia by nitrate-derived nitrite (Van Busse et al. 2012). Heavy metal concentrations in water can be attributed to both geogenic and anthropogenic sources. The excessive ingestion of all these heavy metals including Cd, Cr, Co, Hg, Ni, Pb and Zn has carcinogenic effects on human health (Gilani et al. 2013; Shah et al. 2012). The main sources of potable water for urban communities in Shahrekord are wells and surface water (64% ground water and 36% surface water). The purpose of this study was to investigate the level of drinking water contamination with anions, heavy metals and coliform bacteria water in study area.
2. Materials and Methods
2.1. Study Area
- Shahrekord is the capital city of Chaharmahal and Bakhtiari Province, Iran. It is the largest city in the province. Shahrekord enjoys a cold semi-arid climate with hot summer days, mild summer nights, cool winter days and cold winter nights. The annual average temperature in Shahrekord is about 5.11°C, but the minimum and maximum absolute temperatures recorded in Shahrekord during the last 30 years have been -32°C and 42°.
2.2. Sampling
- A total of 230 samples were collected from 36 wells and tap water. Samples were collected from the source in 500 mL plastic bottles (washed three times with the sample water prior to collection).
2.3. Analytical Measurements
- Water temperature was measured on the site using mercury thermometer. pH was measured using digital pH meter (Model Metrohm, pH Lab 827.). Total alkalinity was determined by the titration using 0.01N hydrochloric acid and methyl orange as indicator according to standard methods. Turbidity was measured by Nephelometer using 0.02 NTU standards. Total hardness, Magnesium, and Calcium were measured by EDTA titration method. Total alkalinity was measured by Acid titration method. Chloride was measured by Argentometric titration method. Sulphate was measured by Turbidity spectrophotometric method. Fluoride was measured by SPADNS spectrophotometric method. Nitrate was measured by Brucine sulphate spectrophotometric method. Nitrite was measured Diazotisation spectrophotometric method. Bicarbonates: The concentrations of bicarbonate was measured by the neutralization of a certain volume of water by hydrochloric acid (0.1 N). The endpoint was determined by colored indicators. Sodium and potassium were measured by Flame photometric method. Total dissolved solids (TDS) were measured using Salinometer (Thermo Electron Corporation, model: Orion 150A+, USA). Water samples were digested according to the method described in APHA (APHA, 2005). Trace elements (Sb, Se, V, Cr, Zn, As, Mo and Cu) were measured by Atomic absorption spectrophotometric method.To prevent contamination, all materials associated with trace metal sampling and analyses were thoroughly acid cleaned before use. Glassware and Teflon vessels were treated in a solution 10% v/v nitric acid for 24 h and then washed with distilled and deionized water. Total Coliforms and E.coli were measured by Most probable number (MPN) method.
3. Results and Discussion
3.1. Physico-chemical Parameters
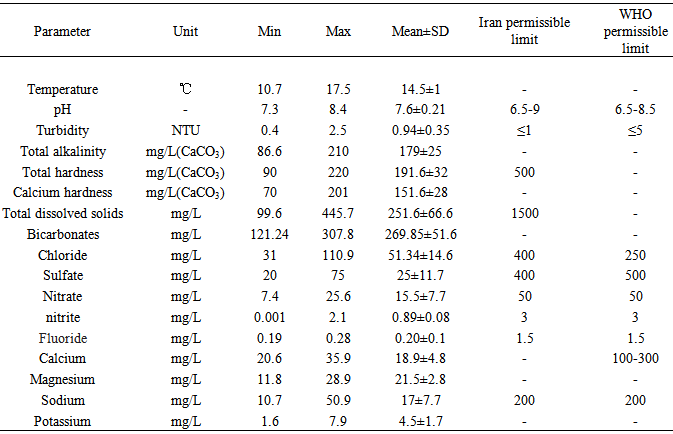
- The data in Table 1 showed that temperature of the water ranged from10.7 to 17.5℃ (mean: 14.5±1℃). The pH of the water ranged from7.3 to 8.4 (mean: 7.6±0.21). pH was below the WHO and Iran acceptable level. This is consistent with the studies carried out by Jabeen et al. (2013) and Gordon et al. (2012). The pH of drinking water has no immediate direct effects on human health but has some indirect health effects by bringing changes in other water quality parameters such as solubility of metals and survival of Pathogens (Zabed et al. 2014).
|
|
3.2. Heavy Metals and Trace Elements
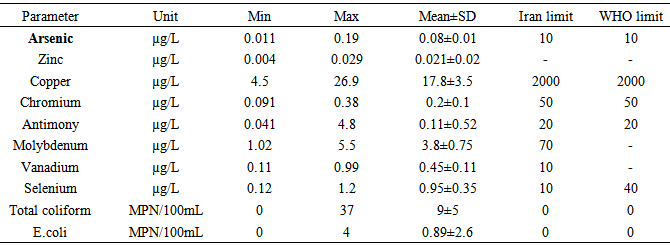
- Arsenic concentration ranged from 0.011 to 0.19 μg/L with mean content of 0.08±0.01 μg/L in potable water (Table 2). Zinc concentration in drinking water ranged from 0.004 to 0.029 With mean content of 0.021±0.02 μg/L. Zinc concentration ranged from4.5 to 26.9 μg/L (mean: 17.8±3.5 μg/L) in potable water.Chromium concentration ranged from0.091 to 0.38 μg/L (mean: 0.2±0.1μg/L) in drinking water samples. Concentration of Antimony was found in the range of 0.041 to 4.8 μg/L (mean: 0.11±0.52 μg/L) in potable water samples. Molybdenum was found in the range of 1.02–5.5μg/L (mean: 3.8±0.75 μg/L) in drinking water. Concentration of Vanadium ranged from0.11 to 0.99 μg/L (mean: 0.45±0.11μg/L) in drinking water. The level of Selenium was found in the range of 0.12–1.2 μg/L (mean: 0.95±0.35 μg/L) in potable water samples.The As, Zn, Cu, Se, Cr, Mo, Sb and V contents were found below the permissible limit Iran and WHO guidelines for drinking water (Table 2). The distribution of average metal concentrations in the drinking water was found in the order of Cu > Mo> Se > V >Cr > Sb> As >Zn.
3.3. Microbiological Quality
- Table 2 shows the mean values of coliform bacteria and E.coli in drinking water collected from the study area. All drinking water samples collected from Shahrekord, were analyzed for coliform bacteria and E.coli. Coliform bacteria ranged from 0 to 37 and mean: 9±5per 100 mL. E.coli bacteria ranged from 0 to 4 and mean: 0.89±2.6 5per 100 mL. In Shahrekord, total coliform bacteria in drinking water samples generally exceeded the permissible limit (0 per 100 mL) set by Iran and WHO. In Shahrekord, drinking water sources were contaminated with coliform bacteria may be due to leakage/discharge from septic tanks, lack of sewage and solid waste disposal systems which were the main threats to water resources. Coliform bacteria may not cause disease, but used as one of the indicators of pathogenic contamination that can cause diseases such as intestinal infections, dysentery, hepatitis, typhoid fever, cholera and other illnesses (Emmanuel et al. 2009).
4. Conclusions
- Water samples studied in different water distribution systems revealed that almost all of the physicochemical parameters and microbiological indicators are in good status, expressing its suitability for drinking purpose. Major problems identified were that of high total coliform bacteria and low Fluoride, The importance of regular monitoring of groundwater and surface water sources are emphasized. Some of the wells in this study contained total coliform indicator bacteria which were in excess of WHO and Iran recommended guidelines for drinking water. Poor maintenance of the wells is the likely reason for the contamination. The water was classified as moderately hard (75–150 mg/L CaCO3) to moderately hard (150–300mg/L CaCO3).
ACKNOWLEDGMENTS
- This research has been supported by Shahrekord University of Medical Sciences.
 Abstract
 Reference
 Full-Text PDF
 Full-text HTML
