-
Paper Information
- Next Paper
- Paper Submission
-
Journal Information
- About This Journal
- Editorial Board
- Current Issue
- Archive
- Author Guidelines
- Contact Us
Resources and Environment
p-ISSN: 2163-2618 e-ISSN: 2163-2634
2014; 4(3): 148-161
doi:10.5923/j.re.20140403.03
Population Growth and Cultivated Land in Rural Ethiopia: Land Use Dynamics, Access, Farm Size, and Fragmentation
 Abstract
 Reference
 Full-Text PDF
 Full-text HTML
Menberu Teshome
Assistant Professor of Development Studies (Environment and Development), Department of Geography and Environmental Studies, University of Gondar, Ethiopia
Correspondence to: Menberu Teshome, Assistant Professor of Development Studies (Environment and Development), Department of Geography and Environmental Studies, University of Gondar, Ethiopia.
| Email: |  |
Copyright © 2014 Scientific & Academic Publishing. All Rights Reserved.
The relationship between rapid population growth and the capacity of our earth has been a matter of controversies for a long time and would continue so in the future. This article is crucial in providing theoretical discourses given by both Multhusians and Boserupians and shows whether the current rural population growth and access to farmland coincides with either Malthusians' or Boserupians' views by taking empirical evidences from Ethiopia. The result shows that the rapid growth of population has resulted in shortage of farmland, and fragmentation through time and in turn affect smallholder agriculture and sustainability of rural livelihoods. Thus, the result calls for further interventions in family planning to limit the rapid population growth, intensification of agricutural production and enhancing non-farm actvities.
Keywords: Population Growth, Cultivated Land, Rural Ethiopia
Cite this paper: Menberu Teshome, Population Growth and Cultivated Land in Rural Ethiopia: Land Use Dynamics, Access, Farm Size, and Fragmentation, Resources and Environment, Vol. 4 No. 3, 2014, pp. 148-161. doi: 10.5923/j.re.20140403.03.
Article Outline
1. Introduction
- The interaction between population growth and environment can have one of the two general dimensions: human actions negatively affect the environment and the environment negatively affects human activities. However, many of the increasing concern relates to the first dimension as production potential of the environment has been largely damaged by high population pressures [2]; [4]; [8]. In response to increasing human-induced environmental change, understanding the relationship between human population growth and cultivated land on temporal scale is imperative and of great concern of the scientific community. The world population grew so slowly for thousands of years. Some 200 years ago it took over 1 million years to reach 1 billion populations in 1800. But the pace of growth quickened and in a relatively short span of 120 years the population doubled to 2 billion. To arrive to the third billion it took only 35 years, and the fourth took 15 years [1]. Since 1950 the population growth has been incomparably higher. For instance, 2.5 billion world population in 1950 was raised to 6.2 billion in 2000 [1]; [2]. It reached 7 billion in 2012 with annual growth of around 81 million (1.2% per year) [2] and it is expected to reach 11 billion by the end of the century [2]; [3]. The modern times demographic explosions have occurred in the developing parts of the world by aggravating land degradation, farmland fragmentation and farm size decline with adverse environmental effects [2]. The population-environment related problems have been more severe in Africa than other Third World Countries. As part of Africa, such problems are more severe in Ethiopia [1]; [2]. Although about 66% of the country is suitable for agriculture [3], unprecedented population growth coupled with traditional practices has posed a tremendous impact on the land resources in the highlands where climatic conditions are more favorable for life and agricultural production [4]. This high concentration of farming population in the highlands is resulting in land shortage, land fragmentation, total devoid of vegetative cover and erosion of the soil cover and exposure of extensive areas of the bedrock. On the contrary, larger proportions of the Ethiopian lowlands (55% of the total area of the country) are still sparsely populated (19% of the total population) due to a number of vector-born tropical diseases [3].There is strong agreement about the current dire situation of Ethiopian agriculture. Population growth is outpacing agricultural production [5]. Farmers grow crops by expanding farmlands for meeting short-term survival needs of increasing human population involving slash-and burn in vegetation and exploitation of the local ecosystems [3]. Even in the highlands, people are encroaching to very steep slopes and marginal lands in order to expand cultivated land which is in its limit in these areas. Thus, farmers in Ethiopia are caught in a vicious circle of low level of income and low level of agricultural productivity though several attempts have been made to address environmental degradation, low agricultural productivity and food insecurity. This implies that population explosion and food insecurity are twin problems which must be addressed together for enhancing ‘Agricultural Development Led Industrialization’ of the nation’s economy [3]; [6].Increasing population with adverse consequences on land resources have fueled the debate beginning from 200 years earlier when Malthus expressed his concern about the ability of the finite resources of the earth to feed an exponentially growing population [1]. The contentious debate has become warm when Boserupians came in the scene with other optimistic position. The research findings have been mixed regarding the respective positions. Given that the majority of the poor people in Ethiopia live in rural areas relying on agriculture, trends in land ownership, farm size, and fragmentation are of great interest [7]. This paper analyzed the nexus between population growth and cultivated land with the main emphasis on access to farmland, farm size and farmland fragmentation in Ethiopia in line with theories on population growth and land resources.
2. Data and Methods
- This paper was first prepared based the review of a set of theoretical and empirical literatures written over the past years that investigated the impacts of population pressure on land resources, mainly cultivated land. The main concern is on the relationship between population growth and agricultural land through connecting the implications of various arguments (pessimist and optimist theories) regarding key factors of agrarian change and other theoretical and empirical literatures to the Ethiopian conditions.The data used were historical population records gathered and compiled from various sources that are directly or indirectly collected from the Ethiopian Central Statistical Agency and other UN Organizations (e.g., UNESCO; FAO and WFP). Long-term population numbers and growth rate records were obtained from 1990 to 2009 aggregated in five years average. Missing population data was filled by projections using growth rates of the time under consideration. Time series data sets on total areas of cultivated land covered by major crops were also derived from Central Statistical Agency (CSA) directly or indirectly spanning from 1980/81 to 2008/09. The surveys done by CSA are confined to smallholder farming households. Other world-wide land use types are also indicated to show the dynamics of land utilization as a result of rapid population growth. Various methods of data analysis were employed in order to accomplish the paper. Analysis of population and data on area of cultivated land involved characterizing long-term trend in annual, five years, and decadal time steps. The simple linear regression technique was used to quantify trend in annual population and farmland and the R-squared (R2) test was used to test statistical significance of trend. In this test, the R2 values greater than or equals to 0.8 indicated the existence of statistically significant trends in population and cultivated land based on the information obtained from statisticians. Percentages, ratio, and averages were also used in the analysis using Microsoft excel worksheet. To illustrate the results tables, bar and line graphs were also used.
3. Population and Land Use/Cover Change: Review of Concepts
3.1. Explanation of Concepts
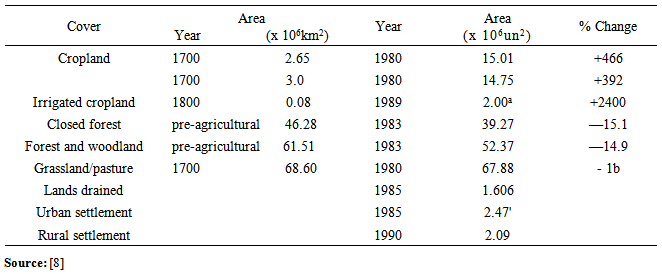
- The main resource controlling primary productivity for terrestrial ecosystems can be defined in terms of land. Despite successful substitution of land-based resources with fossil fuels and mineral resources, land remains of prime importance. Land cover and land use represent the integrating elements of the resource base [8]. Nowadays, it is realized that it is very important to know how land cover has changed over time, in order to make assessments of the changes one could expect in the (near) future and the impact these changes will have on peoples' lives. As people are the main users of the land, it is important for any system to be oriented towards them. Before rushing to discuss the theoretical explanations of the relationship between population growth and land-use-land cover dynamics, the important terms used now and then in this paper need to be defined first. Accordingly, terms such as land, land use, land cover, cultivated land, and land use-land-cover were defined as follows. Land: land is the part of the earth's surface that is not covered by water, as opposed to the sea or the air. It comprises all naturally occurring resources whose supply is inherently fixed. Land is also referred to as primary input and factor of production which is not consumed but without which no production is possible. It is the resource that has no cost of production and although its usage can be switched from a less to more profitable one. The term land includes all physical elements in the wealth of a nation bestowed by nature such as climate, environment, fields, forests, minerals, mountains, lakes, streams, seas, and animals [8]; [9].Land use: since land use is a more complicated term, natural scientists, social scientists, and land managers define it differently. Natural scientists define land-use in terms of syndromes of human activities such as agriculture, forestry and building construction that alter land surface processes including biogeochemistry, hydrology, and biodiversity. Social scientists and land managers define land use more broadly to include the social and economic purposes and contexts for and within which lands are managed (or left unmanaged), such as subsistence versus commercial agriculture, rented versus owned, or private versus public land. While land cover may be observed directly in the field or by remote sensing, observations of land use and its changes generally require the integration of natural and social scientific methods (expert knowledge, interviews with land managers) to determine which human activities are occurring in different parts of the landscape, even when land cover appears to be the same [8]. For example, areas covered by woody vegetation may represent an undisturbed natural shrub land, a forest preserve recovering from a fire (conservation), re-growth following tree harvest (forestry), a plantation of immature rubber trees (plantation agriculture), widen agriculture plots that are in between periods of clearing for annual crop production, or an irrigated tea plantation. The concern of this paper is cultivated land situations of smallholder farmers in Ethiopia not the whole agricultural land, which includes land used for livestock production.Land cover: refers to the physical and biological material over the surface of land, including water, grass, trees, bare soil, and/or artificial structures such as asphalt and settlements [9]. Land cover is distinct from land use despite the two terms often being used interchangeably. Land use is a description of how people utilize the land and socio-economic activity – urban and agricultural land uses are two of the most commonly known land use classes. At any one point or place, there may be multiple and alternate land uses, the specification of which may have a political dimension [8]; [9].Cultivated lands: are those regularly used to grow domesticated plants, ranging from long-fallow, and land-rotational systems to permanent, multi-cropping systems. Rotational cultivation and agro-forestry (including plantations) are often classified as forest, leading perhaps to an underestimate of cultivated land. Further complications arise in distinguishing cultivated land from agricultural land, a broader term that can include land used for livestock production. Perhaps the most common distinction recognizes fodder species grown for livestock as cultivated land and improved pasture as grassland and pasture cover. It is not clear how strictly such distinctions are followed in the data [8].Land-use and land-cover change (LULCC) is a general term for the modification of Earth's terrestrial surface with human interference to obtain food and other essentials for thousands of years. The current rates, extents, and intensities of LULCC are far greater than ever in history, driving unprecedented changes in ecosystems and environmental processes at local, regional and global scales [9].Contemporary interdisciplinary research on human-induced global environmental change recognizes two broad and overlapping fields of study: First that of industrial metabolism investigates the flow of materials and energy through the chain of extraction, production, consumption, and disposal of modern industrial society. Second that of land-use/land-cover change deals with the alteration of the land surface and its biotic cover resulting from rapid population growth. Environmental changes of either kind become global change in one of two ways: by affecting a globally fluid system (the atmosphere, world climate, sea level) or by causing lack of enough places to produce significant food. Land-use change contributes to both kinds of global change: to such systemic changes as trace-gas accumulation and to such cumulative or patchwork impacts as biodiversity loss, soil degradation, and hydrological change [8].The global land use/land cover is changing overtime either due to accelerated expansion of cultivated land (conversion) or the intensification of use of lands already cultivated (modification), or from one use type to another. With a few notable exceptions, most environments have been consumed for rain-fed crop cultivation. The area suitable for rain-fed crop production is estimated to be about 18.74 x 10⁶ km2, only 3.75 to 4.00 x 10⁶ km2 above the area currently taken to represent this land cover. Land expansion will increasingly occur in environments assumed to be more marginal and fragile for cultivation. Tropical forests and grasslands and, to a lesser extent, boreal forests are under increasing pressure from expansion of cultivated lands, as are wetlands [8].Land-cover changes take two forms: conversion from one category of land cover to another and modification of condition within a category. Conversion is the better documented and more readily monitored of the two, but too great an emphasis on it obscures important forms of land-cover modification. The problem will vary with the categories of cover used; the broader and fewer the categories, the fewer the instances of conversion from one to another. If one's classes are as coarse as forest/woodland, permanent pasture, cultivation, and "other lands," for example, forest thinning, replacement of old forests with tree plantations, intensification of cultivation, and severe overgrazing will neither register as conversion nor as land-cover change if conversion totals alone are used to measure change. These four classes such as forest/woodland, permanent pasture, cultivation, and other lands are the most widely used global figures. They purport to show national-level change year by year since the 1950s although criticized for the data quality [8].Table 1 presents the global human-induced conversion in selected land covers. It is very clear from the table that the global total cultivated land is estimated to have increased by 466% from 1700 to 1980. During this time, a net area of more than 12 x 106 km2 of land were brought into cultivation with significant spatial variation across the world. For instance, the USSR, Southeast Asia, Latin America, and North America all experienced greater expansion of cultivated land than the world average. The increase in North America was 6,666%. Two estimates of current cultivated land are 14.75 x 10⁶ km2 and 15.00 x 10⁶ km2. While the global pattern is one of the expansions of cultivated land, some regions have experienced losses, from either the abandonment of cultivated land or its degradation promoting nonuse. Cultivated land has been decreasing in Europe (by 3.5%, 1973-1988) to be replaced by settlement and forest area. Such benign losses are more than matched by forced abandonment owing to degradation. FAO estimates that 5.44 x 10⁶ km2 of rain-fed cultivated lands have been lost worldwide to degradation [8]. Another study estimates that 20.00 x 10⁶ km2 of former cultivated lands has been irreversibly lost due to degrading uses and to permanent cover changes (e.g. water impoundments, settlements). The same authors argued that both estimates are controversial, however [8].
|
3.2. Causes of Land Use/Land Cover Changes
- Changes in land-use/land cover have been driven by real and perceived needs for expanded agricultural production in order to able to feed the rapidly growing population. Regardless of the underpinning causes, the major proximate sources of conversion have been fire and clear-cut timbering (in forested areas), tillage technologies (in grasslands and heavy soils), drainage (in wetlands), and irrigation (in arid lands or where paddy is used). Irrigated land has expanded, according to one estimate, from 0.08 x 10⁶ km2 in 1800 to 2.00 X 1061(km2 in 1989. Perhaps no other form of cultivation is so disputed in terms of its current area, however, estimates range from 2.00 x 10⁶ km2 to 4.58 x 10⁶ km2. The major sources of the modification of cultivated land cover have been switches in cultigens (among cereals, root crops, and agro-forestry) and the intensification of cultivation through Green Revolution (GR) hybrid crops, synthetic inputs, and, more recently, biotechnology although the available data do not allow assessments of the spatial magnitude of these changes [8]. The overall land use/land cover changes encompass the greatest environmental concerns of human populations today, including climate change, loss of biodiversity, and the pollution of water, soils and air. Monitoring and mediating the negative consequences of LULCC while sustaining the production of essential resources has therefore become a major priority of researchers and policymakers around the world [9]. Scientific investigation of the causes and consequences of land use/land cover changes (LULCC) requires an interdisciplinary approach integrating both natural and social scientific methods, which has emerged as the new discipline of land-change science [9].
3.3. Theoretical Frameworks on Agrarian Changes
- As this study was conducted in the agrarian communities of Ethiopia, reviewing theoretical literatures is found imperative. Accordingly, this section begins with a review of theories on agricultural development which were the mainstream discourse dominating the debate on rural development. These theories were favored by donor agencies and international organizations, and also accepted uncritically by policy makers in the developing countries. There are four explanatory models that have enjoyed wide currency in the historical debate on agrarian change: those are the Marxist approach of which Brenner is an important voice, the science and technology argument, the commercialization and urbanization approach, and the demographic model associated with the work of both Boserup and LeRoy Ladurie-Neo-Malthusian [10].The Marxist Approach: Robert Brenner was responsible for initiating a wide-ranging debate on the dynamics of agrarian change in pre-modern Europe. He argued that the indispensable pre-condition for agrarian development was the transformation of the agrarian class structure and the establishment of new relations of production in the countryside [10]. The emergence of capitalism was marked by the displacement of peasant agriculture on a large scale and the redefinition of property rights. The denial of peasants’ secure rights of property enabled the landlords to concentrate and create large farms in their hands and to lease them out to tenant farmers who operated them as capitalist enterprise. The farms were operated with large capital investments and new technologies. Rapid advance in technology, as the prime mover of social and economic change has many adherents among liberal historians and economists. They hold that scientific knowledge and technical innovations have played a pivotal role in setting off what is often called “great transformation” and in economic growth and prosperity even more than having specific resources on the ground [10]. Commercialization and the Growth of Towns: another approach which has attracted a good deal of attention as a driving force for agrarian change was commercialization and the growth of towns. The main argument here is commercialization, accompanied by the growing influence of trading towns led to the dismantling of pre-modern agrarian systems and to a dynamic farm economy and higher rates of productivity. Agricultural commercialization provided a strong incentive for the consolidation of holdings, the adoption of more capitalist forms of production, and the use of improved technology to raise productivity. Here, economic growth is closely associated with urbanization and mobility as more people engaged in the rural sector move out of the sector to seek non-farm employment and a new way of life. Neo-Marxists questioned the relevance of this explanatory model to the Third World rural economies on the grounds that globalization has marginalized poor and weak nations and there are few chances for increasing trade and commerce for them today. But proponents of commercialization may cite examples from the contemporary experience in Asia to support their case [10]. The Demographic Model: the third model is the demographic model which concerns with the works of Ester Boserup and that of LeRoy Ladurie. The main thrust of Boserup’s theory is that population growth has an impact on both innovation and the spread of new technologies internally as well as externally [11]. She argues that population increase has a positive impact in that it leads to the intensification of farm operations, specialization of production and to greater investment on the land. It stimulates new technologies, and in the past, it has been responsible for the shift from hoe to plow agriculture, and brought about improved land management and soil protection practices. Population growth also induces technology diffusion either through the process of migration or through importing technologies from other areas to make up for short-falls that may have been brought on initially by more people competing for scarce resources. Boserup holds an optimistic view of population growth because of its impact on technology and because she believes that technology has been the engine of social and economic progress. The broad outlines of Ladure’s secular Malthusianism and his great agrarian cycle is described here. He stated that a rural economy enters into a phase of decline due to the lack of new technology and its inability to improve productivity, but at the same time, the population continues to grow. The combination of overpopulation leads to greater subdivision of the land, and the cultivation of more marginal areas, soil fertility loss, and thus declining income and greater poverty. If not corrected, over population is followed by population collapse brought on by famine, pandemics, and other disasters that have the effect of depopulating rural society. This lays the ground for the next phase, the new agrarian cycle, which begins with economic regeneration through the greater availability of land, the existing store of technology and gradual improvements in production and income [10]. At first sight, this appears as a suitable model to explain the reality in rural Ethiopia: overpopulation is a critical factor here, the process of impoverishment is well advanced, and there have been frequent famines and pandemics. But a closer examination of conditions in the period under discussion reveals a complex picture, and while some changes in settlement patterns and land management have been induced by population growth (I.e., highland shifting to lowland areas, the loss of the forest cover), the demographic model raises more questions than it answers. To begin with, there is no evidence of improved economic performance following famines and pandemics and the consequent easing of the population pressure that this is supposed to give rise to. On the contrary, the evidence we have in this country is that there is a considerable period of reduced economic performance following disasters, in some cases with communities not being able to recover for a decade or more [12] in [10]. Indeed, a population collapse suggested by the demographic approach would aggravate the ongoing agricultural decline over a long period rather than the opposite. Secondly, different population groups respond to demographic pressure in different ways: some, like the population in the enset culture complex in the Rift Valley areas, adopted a demographic-tolerant farming system that has enabled the areas to carry a much greater population density without being subject to periodic population collapse. Finally, despite the frequency of famines and pandemics, the country’s population has been growing at an increasingly high rate over the last fifty years, thus contradicting one of the main pillars of Ladurie’s demographic argument [13].McCann (1987; 1995) in [10] has attempted to employ a variation of the demographic model to explain the rural history of Ethiopia in the last hundred or more years so. McCann argues that continuous population growth from the nineteenth century on wards and the consequent increase in the demand for food has pushed cultivation into the more marginal areas and fragile ecosystems. Population growth combined with the use of ox-plow technology has been responsible for pushing settlements into new natural settings and the large-scale clearing of forest areas. However, these processes failed to provide the stimulus for radical change in agricultural system or to sustained growth in farming production primarily because of long-term technological stagnation [10].
3.4. The Dynamics of Agricultural Land Utilization: Boserup’s Perspective
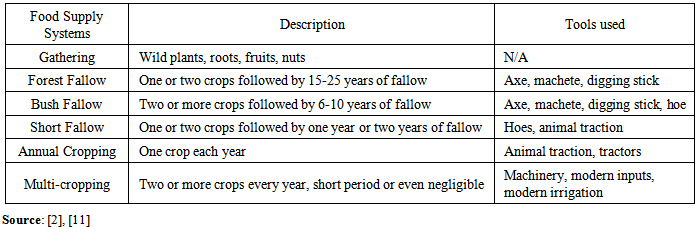
- Questions of land use/land cover change have attracted interest among a wide variety of researchers concerned with modeling the spatial and temporal patterns of land conversion and understanding the causes and consequences of these changes. Among these, geographers and natural scientists have taken the lead in developing spatially explicit models of land use change at highly disaggregate scales (i.e. individual land parcels or cells of the landscape). However, less attention has been given in the development of these models to understanding the economic process, namely the human behavioral component that underlies land use change [14].Population pessimists have emphasized on the strong adverse consequences of the population explosion. Representative of the more alarmist judgments is that of Robert S. McNamara in 1973, then president of the World Bank, who compared population growth with nuclear war: . . . the greatest single obstacle to the economic and social advancement of the majority of peoples in the underdeveloped world is rampant population growth. . . . The threat of unmanageable population pressures is much like the threat of nuclear war. . . . Both threats can and will have catastrophic consequences unless they are dealt with rapidly and rationally. (1973: 31, 45-46 quoted in [1]. Scientific understanding of agricultural change has grown considerably since Boserup’s seminal 1965 work, but her model’s simplicity has provided a foundation for building more complex understandings of farming societies. Much of the development of these more sophisticated understandings has been led by Brookfield [15]. Boserup (1965) asserts the gradual change of agriculture in the degree of intensification as a result of population pressure with wider spatial variation in intensity of land utilization in the world. In large regions of Africa and Latin America, and in some parts of Asia, the system of land use is very extensive, with one to two years' cultivation followed by a fallow period of at least twenty years. The other extreme is found in Egypt and parts of the Far East, where most of the land which bears crops does so at least twice every year. Between these extremes are intermediate intensities of land use, and it is often found that one part of a country is under highly intensive cultivation, another part under annual cropping and a third part under various more or less extensive fallow systems. However, classification of the systems of land use with respect to the degree of intensity is arbitrary to some extent. In order to simplify the analysis Boserup classifies the systems of land use in five categories based on the length of fallow, each category being typically associated with the use of a different set of tools, as shown in Table 2. This sequence can describe both the main stages of the evolution of agriculture from prehistoric times and the association between different population densities and systems of land use in diverse countries [11].
|
4. Results and Discussion
4.1. Trends of Rural Population Growth
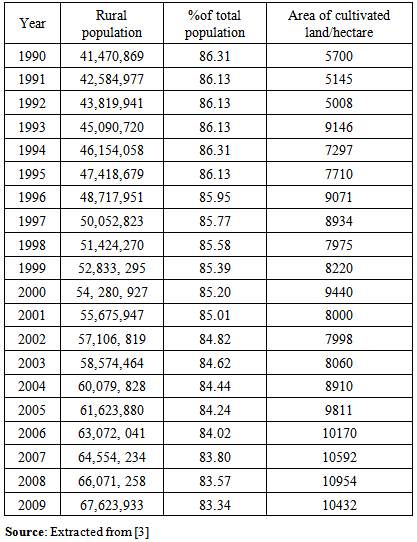
- The population growth rate is the rate at which the number of individuals in a population increases in a given time period as a fraction of the initial population. Specifically, population growth rate refers to the change in population over a unit time period, often expressed as a percentage of the number of individuals in the population at the beginning of that period [4]; [8]. Settlement categories outside urban centers are known as rural areas, where homesteads are very much scattered over a wide area, usually close to the land that each family owns. Since 1984, three decennial Population and Housing Censuses have been conducted to generate relevant statistical data that reflect the socio-economic conditions of the inhabitants of Ethiopia. Such statistical data are useful both for the design and preparation of various development plans and for monitoring and evaluating their impact. Among the most important data collected by the Population and Housing Census was that on population size at national, regional and district levels [16]. Accordingly, the population of the country in 1984 was 39,868,572, of whom 20,062,490 (50.3%) were males and the rest 49.7 were females. The population was rose to 53,477,256 by the 1994 Population and Housing Census (PHC). When it further disaggregated this total population into rural and urban, total rural population ten years ago was 46,154 058 (86.32 of the total), while the urban population was 7,323,122 (13.7% of the total population) [16]; [3].Projected population size of Ethiopia after ten years (July 1/2004) according to CSA’s Statistical Abstract is, 71,066,000; that is, an increase of 17,588,735 (32.89%). In ten years time urban and rural population has increased to 11,199,000 and 59,867,000 respectively. According to the 2007 PHC of Ethiopia, the total number of persons enumerated rose to 73,918,505. Of these, 37,296,657 (50.5%) were males and 36,621,848 (49.5%) were females [16]. Each successive PHC demonstrates that national population size increased in steady increments of significant proportions. For instance, in the previous decade (1984 to 1994), the population of the country increased by 13.2 million people [16]. Similarly, a comparison of the 2007 census results with those from 1994 shows that the population of the country increased by more than 20 million persons over the last 12 years. By the year 2015 the total population is projected to become 93,991,777, of which 17,011,383 and 76,980,394 respectively are for urban and rural areas. This shows that the Ethiopian population is going to increase by 22,925,177 (32.26%) [3] (Refer to table 3 below).
|
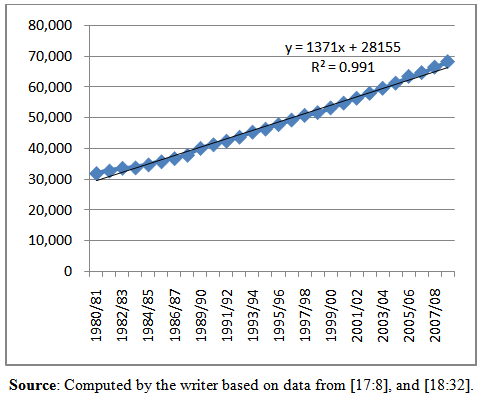 | Figure 1. Rural population Distribution of Ethiopia (1980/81-2008/09) |
4.2. Trends of Cultivated Land in Ethiopia
- Cultivated land is a precious resource for Ethiopia's agriculture, particularly in the highlands. However, most of the country is covered by steep mountains, arid and semi-arid lands, or dry grasslands, which are unsuitable for agriculture. Although it is outpaced by population growth rate, the cultivated land has shown significant increment on temporal scales. In this regard, this sub-section provides a foundation for discussions of the trends of cultivated land within the smallholder sectors of Ethiopia. Results are drawn from nationally gathered data from 1980/8 to 208/09. Figure 2 depicts the total area of crop land of Ethiopia for three decades (1980/81-2008/09). It is clear from Fig. 2 that agricultural land is growing slowly (R2 = 0.806) as compared with population growth (R2 = 0.991) and finally show stagnation or even some decline from1990 to 1992. Two main reasons can be cited for the slow growth of cultivated land in Ethiopia. First, the potentially cultivable land has already reached its limit in the highlands of Ethiopia. Second, most of the untapped land resources are concentrated in the lowlands which are drier than the highlands and suffer from inadequate amount of rainfall and low level of population density. This trend coincides with Malthus’s argument. The starting point for his analysis in An Essay on the Principles of Population Growth first published in 1798 and then in six successive editions was the recognition of the basic difference between the laws that regulate population growth and the laws that regulate food production growth. In theory, Malthus maintains that there are no limits to what he define the power of population [2].
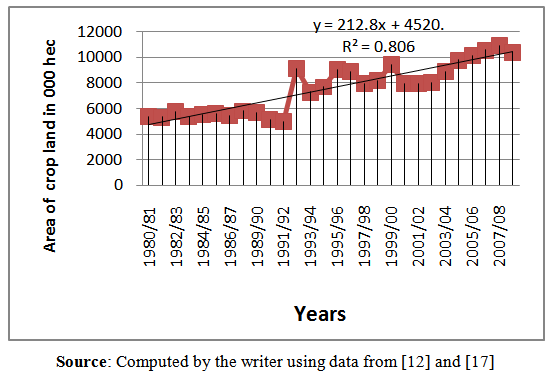 | Figure 2. Area of cultivated land in Ethiopia (1980/81-2008/09) |
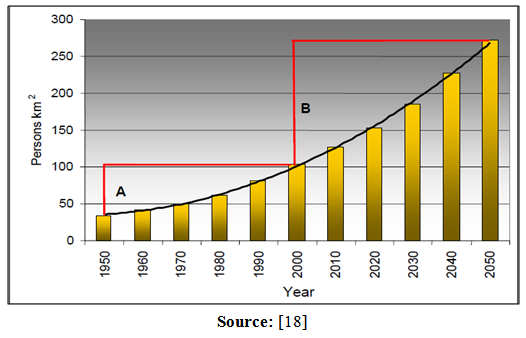 | Figure 3. Estimated population per arable km2, 1950-2050 |
4.3. Agricultural Density of Ethiopia
- Ethiopia’s land resource base is heavily degraded from unsustainable farming practices and deforestation, aggravated by growing population pressure. The relationship between population growth and the relatively fixed quantity of arable land makes evident the magnitude of the problems confronting Ethiopia and underlines the difficulty of improving the food security status of the country’s poor [19].The figure above shows the numbers of people in Ethiopia per km2 of arable land over the 100-year period from 1950 to 2050. If population growth continues in 2050, 270 Ethiopians will have to gain a living from each km2 of arable land, compared to 35 in 1950. This underscores the importance of efforts to reduce the amount of arable land in Ethiopia that is degraded, to increase the returns to this land and to decrease the rate by which the population is growing [18].
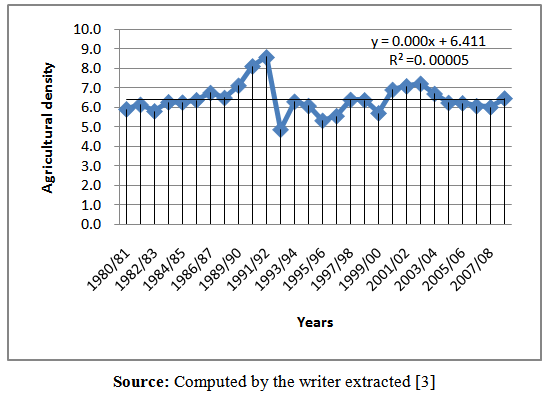 | Figure 4. Agricultural density of Ethiopia from 1980/81 to 2008/09 |
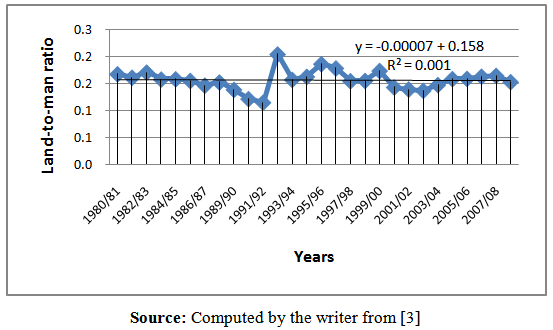 | Figure 5. Land-to-man Ratio of Ethiopia from 1980/81 to 2008/09 |
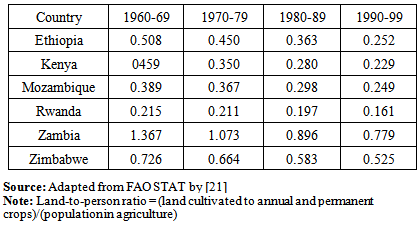
4.4. Comparison of Ethiopia’s Land-to-man Ratio with Five African Countries
- This land-to-person ratio is significantly varied from a study result of [21] as can be seen in Table 4 below. The variation in Jayne et al. study may be the ratio of cultivated land per household heads. But in this study the calculation was done by dividing area of cultivated land to the total rural population.
|
4.5. Access to Land, Farm Size and Fragmentation
- Land as a public property in Ethiopia has been administered by the government since the 1975 radical land reform. Rural land is both an economic and a political/social question in the present-day Ethiopia. The insertion of the issue of land in the Ethiopian constitution in the early 1990s, however, may indicate that rural land has increasingly become a political affair [20]. Currently, land and land tenure is a hot policy issue in Ethiopia. Three key issues among others are raised in relation to Ethiopia’s land policy–access to land/land security, farm size, and fragmentation [20] which are the concern of this sub-section.
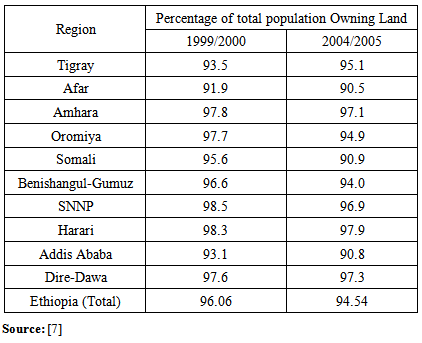
4.5.1. Access to Cultivated Land
- Access to land refers to land under the household’s use rights, so long as it is regularly utilized. This generally includes all cropped land, wood lots, fallow land, land under tree crops, gardens and rented land [21]. But for this paper access to land refers to the farmers’ ownership right to cultivated land. In order to investigate land ownership right, the 2004 Well-fare Monitoring Survey (WMS) asked households whether they owned land and how much land they owned. In answering these questions, respondents used an array of locally defined units. It has not been possible to have these converted into standard (metric) units and so it is only possible to explore correlations between ownership and other measures of welfare [7]. Table 5 indicates proportion of rural households who own land by Administrative Region in the years 1999/2000 and 2004/2005. As the table clearly reveals, the proportion of rural households who own land slightly decreases in all regions except Tigray region. In Tigray region it increases from 93.5 percent in 1999/2000 to 95.2 percent in 2004/2005. I did not come across with evidences as to why the proportion of rural households increases. But as to my personal judgment, this might be due to expansion of land use in untapped areas of Humera, Wolkait Tsegede, and other western lowlands. In 2004/05, almost all (96 percent) of rural households owned some land. There are no meaningful regional variations in ownership. Landownership is highest in Harari (97.9 percent) and Dire-Dawa (97.3 percent) followed by Amhara (97.1 percent and SNNP (96.9 percent) and lowest in Afar (90.9 percent). Across all rural areas, landownership declined by 1.6 percentage points between 1999/2000 and 2004/05 [7].
|
4.5.2. Size of Farmland Holdings
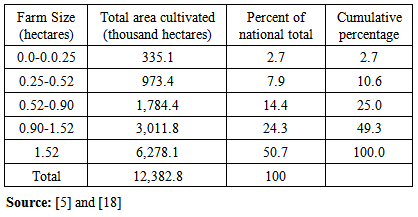
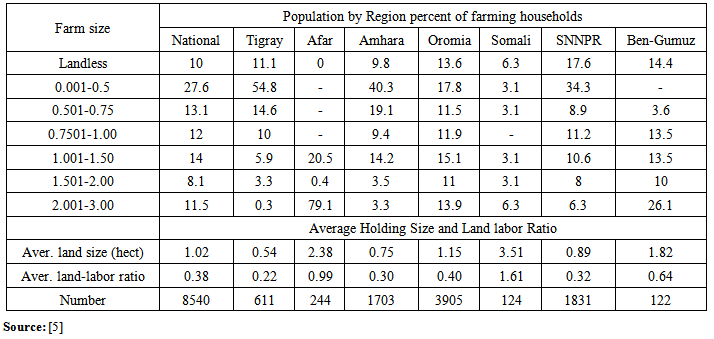
- Ethiopia is a country of smallholder agriculture because population pressure has diminished households’ farm size. The question of farm size is related to the degree to which the size of landholdings can adequately support the livelihood of the farmer and a sustainable intensification of agricultural production. A number of researchers have raised the issue of the gradual conversion of Ethiopian agriculture from small-scale agriculture to micro-agriculture that cannot reduce the poverty of the farmers and even unable to support the life of the farming community [20]; [5]. Farm size in all the sample households range from zero (landless) to a high of 5 hectares although those who own the latter are very small in number and usually reside in the less densely populated regions of Somali and Afar. The average landholding size for all the households is about 1.02 hectares per household and this average declines slightly to about 0.96 hectares when we take out the samples from sparsely populated regions of Somali, Afar and Benishangul-Gumuz [5].In the 2000 cropping season, 87.4 % of rural households operated less than 2 hectares; whereas 64.5% of them cultivated farms less than one hectare; while 40.6% operated land sizes of 0.5 hectare and less. Such small farms are fragmented on average into 2.3 plots. From this one can suggest that landholding is one of the factors that constrain farm income and the level of household food security. As landholding declines, per capita food production and farm income also decline, indicating that extremely small-sized farms cannot be made productive even with improved technology and certainly not enough to address rural poverty. Such farmers have little or no surplus for investment and for input purchase. The increasing decline of farm size also leads to a reduction of fallowing practice or shortening of fallow cycles, and rotation, with a consequence of declining soil quality and fertility in some highland areas [21], [19]; [5]. The average farm size is considered to be small to allow sustainable intensification of smallholder agriculture. Empirical evidence shows that the probability of adopting fertilizer and improved seeds decreases with declines in farm size [19]. The same author using the Broadening Access and Strengthening Input Market Systems/Institute of Development Research (BASIS/IDR) study in South Wollo has found that farm size has a positive and statistically significant impact on fertilizer application. In the study, the relationship between technology use and farm size was observed by categorizing farm holdings into three: (i) small size farms, 0.50 hectare and less; (ii) medium size farms, 0.51 - 2.0 hectares, and; (iii) large size farms, above 2.0 hectares. Large size farm holders were found to be significant users of fertilizer, improved seeds and manure. This implies simply that farm size is a crucial factor in the intensification of smallholder farming systems. A unit change in size of farm entails more than two and half times higher chance of using chemical fertilizer, if other factors remaining constant. Those farming households with larger farm size benefit from economies of scale in using chemical fertilizer as they can better afford to purchase it. Households with relatively small farm size are poor in cash income, have less access to extension services and credit, and have less risk coping capacities to take risks of rain failure, and less profitable technologies given higher transaction costs of acquisition and application of fertilizer per unit of land [20]. Table 6 shows total area cultivated by farm size for the smallholder farms only. Each farm size interval contains 20 percent of Ethiopia’s smallholder farms. Sixty percent of smallholders (small farms) in Ethiopia cultivate less that 0.90 hectares of land. While 40 percent of the farmers cultivate less than 0.52 hectares, they manage only 11 percent of total area cultivated. On the other hand, medium-size farms, defined as those cultivating 0.90 hectares or more, account for 75 percent of the total land cultivated for crop production.
|
|
4.5.3. Farm Land Fragmentation
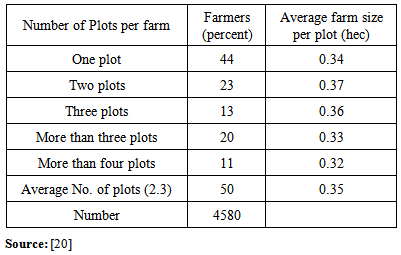
- The Ethiopian subsistence agriculture has not only suffered from continuous decline of cultivated land but also from farm fragmentation. According to 2004 national survey data, the average farm size in the highlands was fragmented into 2.3 plots, each with 0.35 hectares. About one-third of the surveyed farms consisted of 3 or more plots indicating high farmland fragmentation (Table 8).
|
|
5. Conclusions
- The interaction between population growth and environment can have one of the two general dimensions: human actions negatively affect the environment, and the environment negatively affects human activities. Although both dimensions are true, many of the increasing concern relates to the first dimension because food production potential of the environments has been largely damaged by high population pressure. In this regard, understanding the relationship between human population growth and cultivated land is imperative. Accordingly, the objective of this study was to analyze rural population and cultivated land time series, detecting long-term trends and assessing their significance in Ethiopia. The dynamics of land utilization, access to cultivated land, farm size, and farm fragmentation were given most attention including the broad patterns of land-use/cover changes at global level. In order to advance the general understanding on the link between population growth and cultivated land, the long-term data on population and cultivated land was collected from different sources such as Central Statistical Agency (CSA) and documents of UN organizations. Various methods of data analysis were employed in order to accomplish the paper. Analysis of population and area of cultivated land involved characterizing long-term trend in annual, five years, and decadal time steps. The simple linear regression technique was used to quantify trend in annual population and farmland and the R-squared (R2) test was used to test statistical significance of the trends. In this test, the R2 values greater than or equals to 0.8 indicated the existence of statistically significant trends in population and cultivated land.The result of time series data indicated that population and cultivated land are steadily increasing over the period under consideration although the former outpaces (R2= 0.991) the latter (R2 = 806) which is almost consistent with Malthusian and Neo-Malthusian arguments. For instance, in the previous decade (1984 to 1994), the population of the country increased by 13.2 million people. Similarly, a comparison of the 2007 census results with those from 1994 shows that the population of the country increased by more than 20 million persons over the last 12 years. By the year 2015 the total population is projected to further increase in rural areas. In addition, the population is concentrated particularly in the highlands, where climatic conditions are more favorable for human settlement and crop cultivation. However, the Ethiopian lowlands though they consist the larger portion of the country, are still sparsely populated due to a number of tropical disease particularly Malaria. Thus, only 19% of the total populations are living in the lowlands that are consisting 55% of the total area of the country. The rapidly increasing population number coupled with uneven population distribution has led to shortage of farmland, changes in land utilization, declining farm sizes, and increasing land fragmentation over time. Evidences indicated that agricultural land is growing so slowly and finally show stagnation or even more decline from 1990 t0 1992 particularly in the highlands. The main reasons were first, the potential cultivated land has already reached its limit in the highlands and second most of the unused lands are concentrated in the lowlands characterized by drier conditions suffering from inadequate rainfall. This has resulted in great obstacle on smallholder agriculture. The diminishing farm size has not only affected the level of technology use, but also the rural livelihoods. The result indicated that the average farm size can generate only about 50% of the minimum income required for the average farming households to lift farmers out of poverty. The average land holding size in the Ethiopian highlands would thus be insufficient to feed a family of five, even if production could be increased three times. The result again shows the numbers of people in Ethiopia per km2 of arable land over the 100-year period from 1950 to 2050. If population growth continues in 2050, 270 Ethiopians will have to gain a living from each km2 of arable land, compared to 35 in 1950. Even though the process of further farmland fragmentation has become less practical, the current level of farm fragmentation is high, especially considering together with existing farm sizes and level of land productivity. This may hinder sustainable intensification of smallholder agriculture in many ways. The incentive to apply sustainable land management practices like rotation, agro-forestry, and inter-cropping and soil erosion control is affected negatively by farmland fragmentation and diminution. Smallholders are less risk tolerant and the opportunity cost of participation in sustainable land management practices is not high, when compared to farmers with relatively higher farms. This underscores the importance of efforts to reduce the amount of arable land in Ethiopia that is degraded, to increase the returns to this land and to decrease the rate by which the population is growing. Moreover, Ethiopia’s land resource base is heavily degraded from unsustainable farming practices and deforestation. The relationship between population growth and the relatively fixed quantity of arable land underlines the difficulty of improving the food security status of the poor. These limited/no access to farmland and food insecurity situations almost coincide with Malthusians argument. Thus, the result indicates the need for further interventions in family planning to limit the rapid population growth. Forecasting problems, perceiving consequences, and formulating appropriate policies will help to limit population growth and enhance agricultural production in particular and fast development of the country’s economy in general.
ACKNOWLEDGEMENTS
- I wish to thank the Central Statistics Authority and Economic Association of Ethiopia for providing the necessary data for this study. The study was supported by the School of Graduate Studies of Addis Ababa University and University of Gondar. The paper has benefited substantially from anonymous reviewers.