-
Paper Information
- Previous Paper
- Paper Submission
-
Journal Information
- About This Journal
- Editorial Board
- Current Issue
- Archive
- Author Guidelines
- Contact Us
Resources and Environment
p-ISSN: 2163-2618 e-ISSN: 2163-2634
2014; 4(3): 139-147
doi:10.5923/j.re.20140403.02
Modeling Soil Erosion within Small Moutainous Watershed in Central Vietnam Using GIS and SWAT
 Abstract
 Reference
 Full-Text PDF
 Full-text HTML
Tran Thi Phuong, Chau Vo Trung Thong, Nguyen Bich Ngoc, Huynh Van Chuong
University of Agriculture and Forestry, Hue University, Hue City, Vietnam
Correspondence to: Tran Thi Phuong, University of Agriculture and Forestry, Hue University, Hue City, Vietnam.
| Email: |  |
Copyright © 2014 Scientific & Academic Publishing. All Rights Reserved.
Soil erosion has been considered the primary cause of soil degradation because soil erosion leads to the loss of topsoil and soil organic matter, which are essential for the growing of plants. The purpose of this study is to integrate Geographic Information System (GIS) and Soil and Water Assessment Tools (SWAT) for simulating soil erosion within small mountainous watershed that is an upstream of Bo River watershed in Central Vietnam. The results of this study found that the largest amount of soil erosion was 92.33 t ha-1 in 2007, followed by 2010 (85.41 tha-1) and 2005 (76.79 t ha-1). The average soil loss in the whole period from 2000 to 2010 was 62.50 tha-1. Additionally, this study indicated that high soil erosion level still occupies high percentage in 2000 and 2010 with more than 30 %, and this trend tends to increase mainly in the Southwest and North of the watershed. Soil loss occurred mainly in Dry agriculture land area with slope above 250in Ferralic Acrisols (Fa) while there is very low amount of soil loss in slope from 80 to 150 with land use type of forest mixed in Ferralic Acrisols (Fs). The case study also provides an example quantitative indication of how well GIS and SWAT may perform under limited availability of input meteorological data. These results will be useful for water and soil conservation management and the planning of mitigation measures.
Keywords: Central Vietnam, Simulation, Soil erosion, SWAT, Watershed
Cite this paper: Tran Thi Phuong, Chau Vo Trung Thong, Nguyen Bich Ngoc, Huynh Van Chuong, Modeling Soil Erosion within Small Moutainous Watershed in Central Vietnam Using GIS and SWAT, Resources and Environment, Vol. 4 No. 3, 2014, pp. 139-147. doi: 10.5923/j.re.20140403.02.
Article Outline
1. Introduction
- Adverse impacts of natural factors and human’s resource exploitation cause significant changes in surface soil and degradation of land in quality (Nguyen D.K. et al., 2007). These factors will be accelerated under increasing climate change. Vietnam’s statistic data indicate that the total erosion-risk areas are 13 millions of hectares accounting for 40 percent of natural areas (Nguyen A.H., 2010). The average of arable land per capita is decreasing yearly from 0.101 hectare to 0.036 hectare per capita. The fragmentation of agricultural land and inappropriate farming techniques lead to low crop productivity and poverty in mountainous region (Le V.D, 2011). The A A watershed is the smallest one in Thua Thien Hue Province (Le P.C.L and Pham T.T., 2012). In recent 10 years, most of forest land in the watershed has been changed into other land use types such as agricultural and residential land. These changes have negative impacts on vegetation cover, surface run-off speed which lead to an increasing soil loss in the watershed (Tran T.P and Huynh V.C., 2013).Soil erosion causes loss of fertile top soil cover, delivers millions of tons of sediments into reservoirs and lakes, resulting in a significant negative environmental impact and high economic costs by its effect on agricultural production, infrastructure and water quality (Lal, 1998; Pimentel et al,. 1995). Not surprisingly soil erosion and sediment delivery have become important topics for local and national policy makers. This has led to an increasing demand for watershed or regional-scale soil erosion models to delineate target zones. Result of model will suggest the most effective conservation measures. Literature review shows that there are many soil erosion models such as AGNPS (Agricultural Non-Point Source) model, HSPF (Hydrological Simulation Program Fortran) model, SWAT (Soil and Water Assessment Tool) model, and WEPP (Water Erosion Prediction Project) model. Among these models, the SWAT model is frequently used to evaluate sediment yield in many catchments around the world (e.g. Xu et al., 2009; Wang et al., 2010; Betrie et al., 2011; Oeurng et al., 2011). Some recent studies show that SWAT is capable of simulating soil erosion in large areas, even in situation of limited data. That is an important advantage for modelers in developing countries. Mekonnen et al. (2009) applied SWAT to simulate hydrological regimes in the two Ethiopian catchments. Quyang et al. (2010) investigated soil erosion dynamics in the upper watershed of the Yellow River, China. The Mekong River Commission has been using SWAT since 2000 to facilitate the joint planning and management of the Mekong River Basin (Rossi et al., 2009). Although SWAT is applied in many other large areas all over the world, few studies are carried out in small watershed scale, especially it is rare to find the studies in the small watershed of Central Vietnam. Therefore, implementation of this research offers an opportunity to apply the results to other small watersheds in the whole Vietnam.The objective of this study is to develop a Soil and Water Assessment Tool version 2009 model (Neitsch et al., 2009) combining with GIS in the small watershed in Central Vietnam. This study is also an additional test case for the efficacy of the SWAT2009 model to represent and simulate spatially variable watershed processes on a small scale watershed in developing countries where data reliability is often a big issue.
2. Study Site
- The selected watershed of this study is located in the mountainous region of Thua Thien Hue Province, Central Vietnam with total areas of 14,047.60 hectares. Among them, hilly land accounted for 98.33% of the total natural area of the watershed and most of them are steep slope. This is a complex terrain region which is separated by many large and small streams and often influenced by natural disasters such as hail, flash floods and landslides. In addition, the selected watershed is a poor mountainous area of A Luoi District with 89% of the population being ethnic minorities such as Pa Co, Pa Hy, Ta Oi and Co Tu. The main branches of this river originate from mountain region with height of 636m in the Southeast of A Luoi District. This river goes through communes of Huong Lam, Huong Phong, Hong Thuong and is also basis boundaries of communes such as: Hong Thuong and Phu Vinh communes, Hong Thai and Hong Thuong communes, Hong Thai and Hong Nham communes. The final point of this river converge on the Sekon river whose part go through The People’s Democratic Republic of Laos. The watershed has abundant flow dividing the whole basin, and has rainfall intensity, which occur in steep terrain and cover of mountain ranges. Therefore, the risk of erosion and landslide of riverbanks are very high. The study site is divided into twelve Sub-watersheds (called Sub) numbered from 1 to 12. Most of areas in of the watershed are natural forest, plantation forest, annual crop land, perennial crop land and a part of paddy rice land.
3. Material and Methods
3.1. SWAT Model Input
- The ArcSWAT 2009 (Soil and Water Assessment Tool) model was used to assess soil erosion. SWAT is a basin scale, continuous time hydrology model that can produce simulation results on a daily, monthly, or annual basis (Arnold and Fohrer, 2005). The input data required for SWAT include weather data, a land use map, a soil map and a Digital Elevation Map (DEM). The ArcGIS interface of the SWAT 2009 version was used to delineated and sub-divided into 12 sub-watershed. Sub-watershed parameters such as the slope gradient and slope length of the terrain were derived from the DEM.
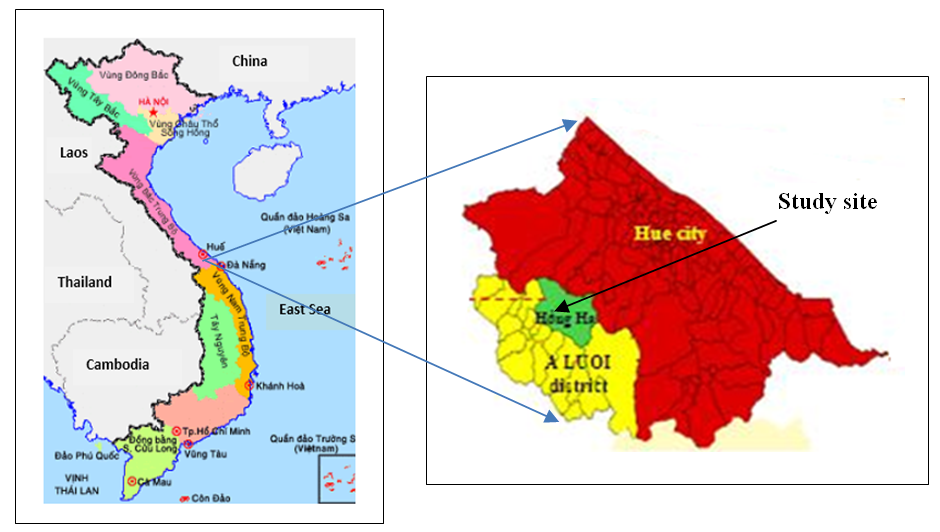 | Figure 1. Location map of the study site (Source: Department of Natural resource and Environment in Thua Thien Hue Province) |
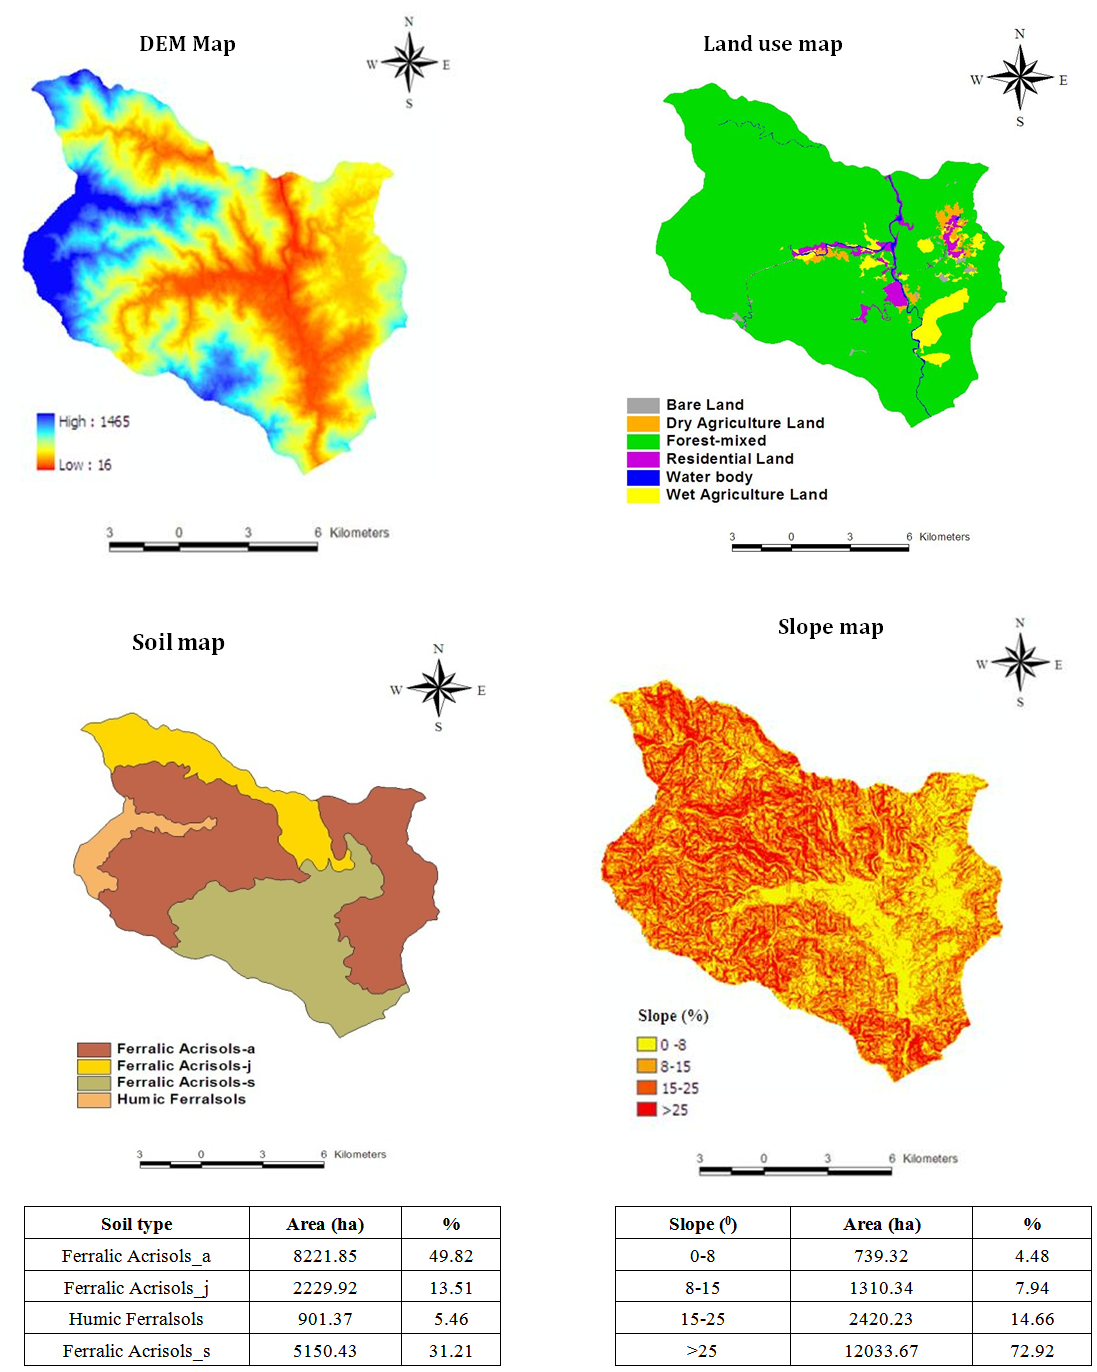 | Figure 2. Four main thematic maps for SWAT model input (Source: Department of Natural resource and Environment;Science and Technology in Thua Thien Hue Province) |
3.2. Watershed Configuration
- SWAT divides a watershed into sub-watersheds and the sub-watersheds can be further sub-divided into Hydrologic Response Units (HRUs). Within each sub-watershed, HRUs in are formed as unique soil and land use combinations that are not necessarily contiguous land parcels. In this study, the ArcGIS interface (Winchell et al., 2010) of the SWAT 2009 version was used to describe a watershed and extract the SWAT model input files. The DEM was used to delineate the watershed and provide topographic parameters for each sub-watershed. The watershed was delineated and described into 12 sub-watersheds.
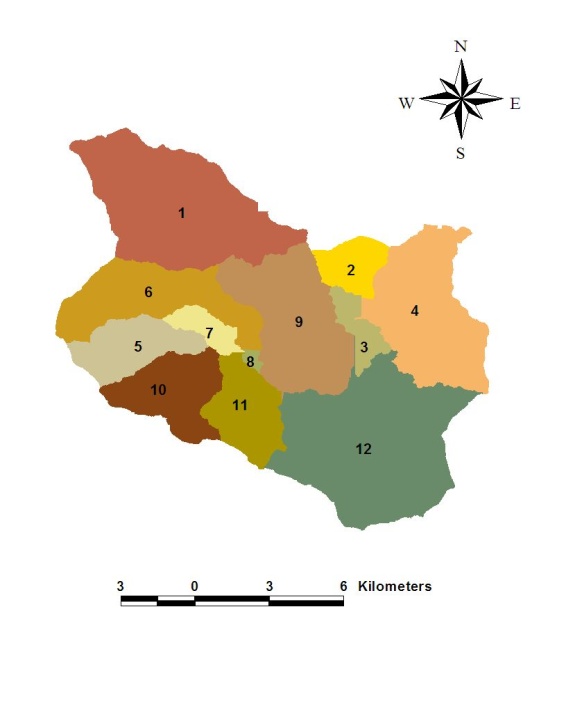 | Figure 2. Map of sub-watershed |
3.3. Model Calibration and Validation
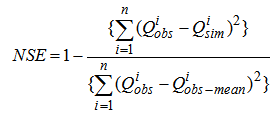
- The SWAT calibration method was used for the study, which included calibration of model manually by adjusting hydrologic and sediment parameters in SWAT. The calibration process was basically trial-and-error to yield the highest Nash-Sutcliffe coefficient. Validation is taken to mean ‘model testing’ and validated model not necessarily be a perfect predictor. Rather, good validation results are simply stronger evidence that the calibrated model is a good simulator of the measured data and does not over measure data in the calibration period. In this study, the model was calibrated and validated only for flow due to lack of data on annual sediment load in outlet station. The flow monitoring data in 2000 and 2010 were used for calibration and validation. The Nash-Suttcliffe coefficient-NSE (Nash and Suttcliffe, 1970) and percent pias (PBIAS) were used to quantitatively assess the ability of the model to replicate temporal trends in measured data. The NSE value is calculated using the following equation (1):
 | (1) |
 and
and  are the observed and simulated data, respectively, on the ith time step, and
  is the mean of observed data across the n evaluation time steps. The NSE value indicates how well the observed data versus simulated results fit the 1:1 line (Nash and Sutcliffe, 1970). NSE values range from -∞to one, with values less than or very close to zero indicating the unacceptable or poor model performance and values equal to one indicating perfect performance. The PBIAS is used to determine if the average tendency of the simulated data is either larger or smaller than its observed counterparts (Gupta et al., 1999). The optimal value of PBIAS is zero, with low-magnitude values indicating accurate model simulation. Positive PBIAS values indicate model underestimation bias, while negative values indicate model overestimation bias (Gupta et al., 1999). PBIAS is calculated using the following equation (2):
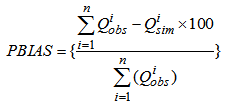 | (2) |
3.4. Soil Erosion Assessment Using SWAT
- Erosion and sediment yield in SWAT are estimated for each HRU with the Modified Universal Soil Loss Equation (MUSLE) developed by Wischmeier and Smith (1965; 1978). While the USLE uses rainfall as an indicator of erosive energy, MUSLE uses the amount of runoff to simulate erosion and sediment yield. The hydrology mode supplies estimates of runoff volume and peak runoff rate, which are used to calculate the run off erosive energy with the sub-basin area. The crop management factor is recalculated every day that runoff occurs.This calculation is a function of aboveground biomass, residue on the soil surface, and the minimum USLE (Universal Soil Loss Equation) cover and management factor (CUSLE factor) for the plant. The modified universal soil loss equation is given by (3):
 | (3) |
4. Results and Discussion
4.1. The Soil Loss of the Whole Watershed
- Output data on total eroded soil for the whole watershed are simulated monthly per year and presented in the file output.std/Annual summary for watershed in year of simulation.As can be seen from Figure 3, the amount of soil erosion over months varies and most of them have reached the peak in October annually. The correlation between graphs in Figure 3 shows that the amount of soil erosion at some point follows the rules of change in rainfall and water flow.
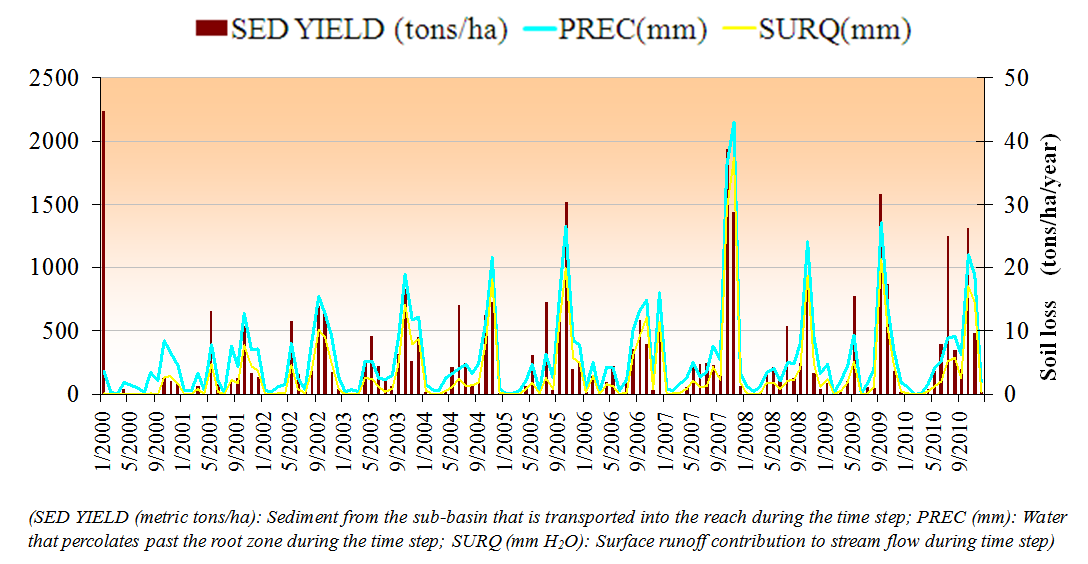 | Figure 3. The monthly amount of soil loss |
|
4.2. Soil Erosion at Sub-watershed Level
- The amount of soil erosion for each sub-watershed are illustrated in the file of output.sub/SYLD (ton/ha). There is a fair correlation between soil erosion and surface runoff in the period from 2000 to 2010 (Figure 3). However, there has been still a difference among them at some point of time such as 2001, 2008 and 2010. The causes for that are the differences of sub-watershed in soil type, land use and slope. These factors also have decisive influence on the amount of soil loss due to erosion.The soil loss of each sub-basin is varied and there is a deviation between the amount of soil erosion and runoff in the beginning period of 2000 and 2001. Since 2001, there has been a significantly positive correlation between soil erosion and surface run-off. The amount of soil erosion has tended to vary and depend upon the amount of surface runoff. Average soil loss in each sub-watershed is displayed in figure 4.As can be seen from Figure 4, the minimum average amount of soil loss occurs in Sub-watershed No 8 while the highest average amount of soil loss is in Sub-watershed No 12.The monthly detailed soil loss of these two Subs is described in Figure 5. The results in Figure 5 show that maximum amount of soil erosion in Sub 8 is 19.064 ton/ha in 2000; while this largest figure in Sub 12 is 153.479 ton/ha in 2010, which is eight-fold in comparison with Sub 8. So it is noted that there is a large difference in the amount of soil erosion because of differences in features of each sub in terms of area, width, height, soil type, land use type and slope. The Table 3 presents differences in features of Sub 8 and Sub12.The Table 3 shows that soil loss occurs mainly in Dry agriculture land area with slope above 250 in Ferralic Acrisols (Fa) while there is very low amount of soil loss in slope from 80 to 150 with land use type of mixed forest in Ferralic Acrisols (Fs).
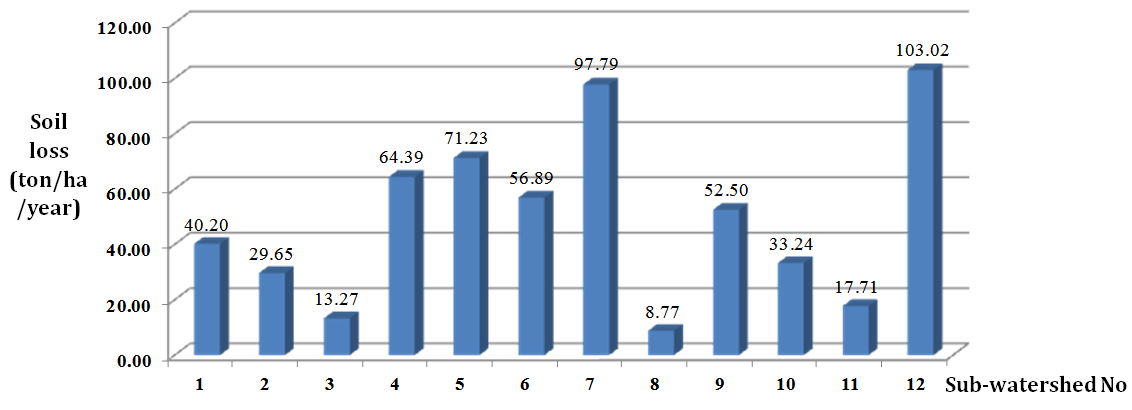 | Figure 4. Average soil loss at sub-watershed level from 2000 to 2010 |
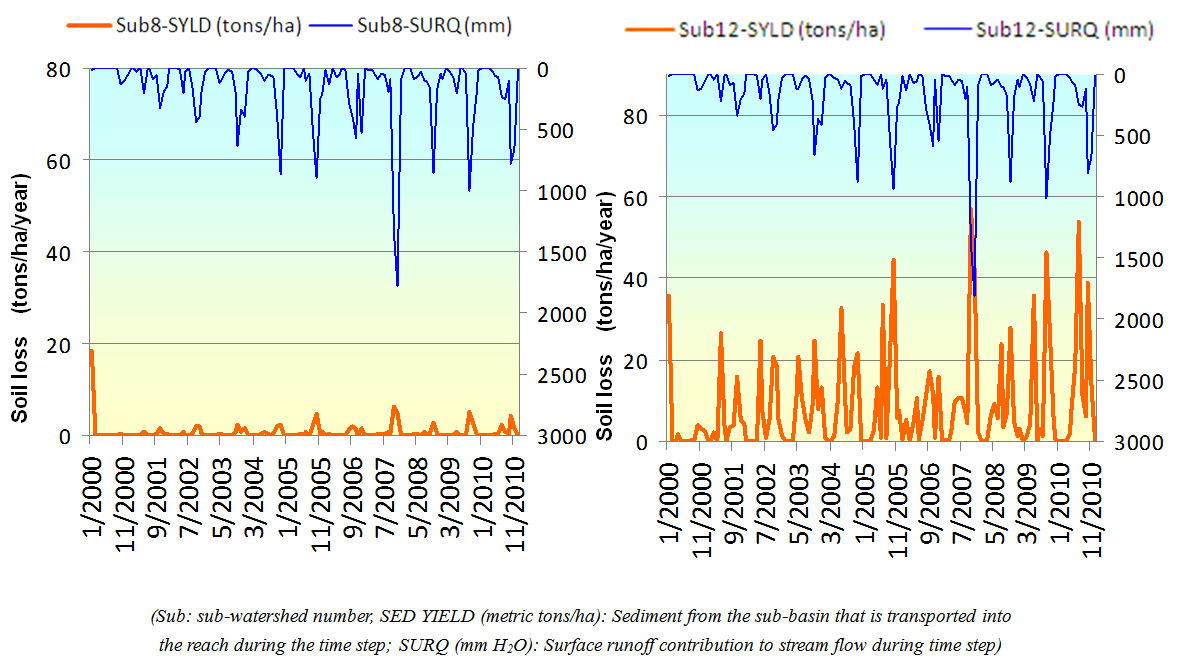 | Figure 5. Monthly soil loss from 2000 to 2010 in Sub-watershed 8 and Sub-watershed 12 |
|
4.3. Soil Loss at Different Land Use Types
- According to Neitsch et al (2009), the canopy affects erosion by reducing the effective rainfall energy of intercepted raindrops. Water drops falling from the canopy may regain appreciable velocity but it will be less than the terminal velocity of free-falling raindrops. The average fall height of drops from the canopy and the density of the canopy determine the reduction in rainfall energy expended at the soil surface (Geißler et al, 2013). The soil loss in different land use types in 2000 and 2010 are shown in Table 4.
| |||||||||||||||||||||||||||||||||
4.4. Model Evaluation
- Data on sediment measuring in the study site cannot be collected, so in this research run-off data is used to calibrate the model. Process of analyzing sensitivity of run-off is done automatically by SWAT model in "Sensitivity Analysis" function of ArcSWAT. The results of this process show parameters such as Surlag (The surface runoff lag time), Cn2 (infiltration factor), Esco (The soil evaporation compensation factor), Alpha_Bf (The Alpha factor on base-flow), Sol_Awc (Available water capacity of the soil layer), Gw_Delay (Ground water delay) having strong influence on changing value of run-off volume in rivers of the watershed. Based on results of this process, the parameters are selected for process of calibration so that coefficients of evaluation satisfy requirements and obtain the highest accuracy.
|
| ||||||||||||||||||||
4.5. Soil Erosion Mapping
- After erosion database is sorted and formatted appropriately, soil erosion map is simulated by using ArcGIS software and adding a field of erosion results SYLD (ton/ha) into attribute table of HRUs database layer. Soil erosion map in the whole watershed is displayed in Figure 5. Continuously using calculation functions in ArcGIS 9.3, respective area of each erosion level is counted and illustrated in Table 7.
| ||||||||||||||||||||||||||||||
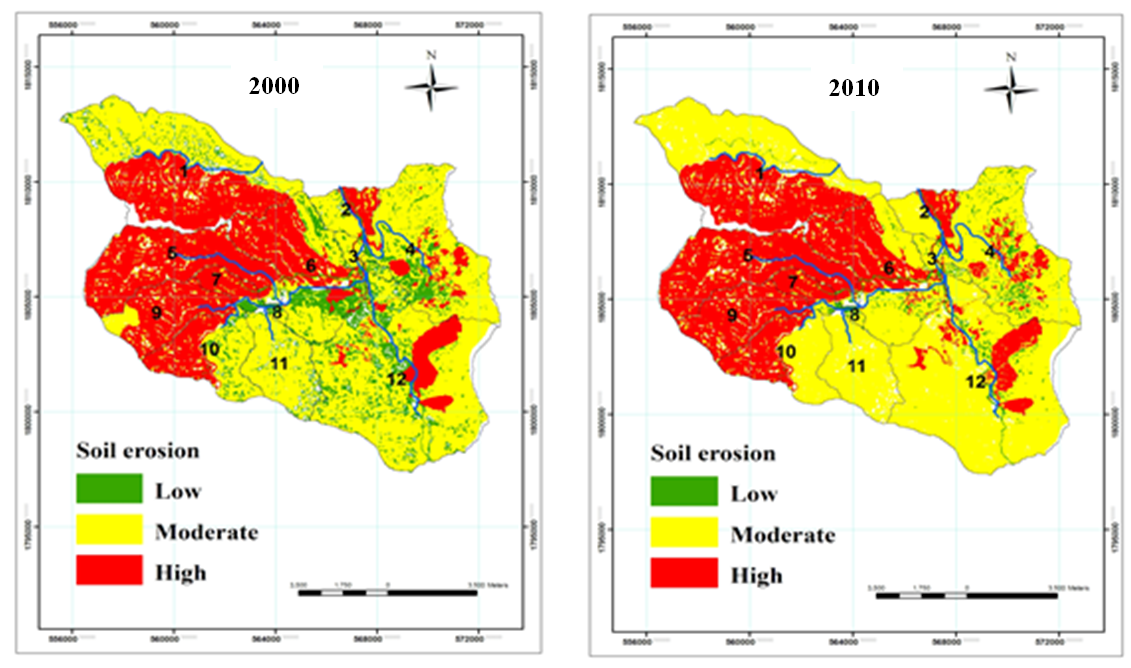 | Figure 5. Classification map of soil erosion in the study area in 2000 and 2010 |
5. Conclusions
- The findings of this research state that the largest amount of soil erosion was 92.33 t ha-1 in 2007, followed by 2010 (85.41 tha-1) and 2005 (76.79 t ha-1). The average soil loss in the whole period from 2000 to 2010 was 62.50 tha-1. Additionally, this study indicated that high soil erosion level still occupies high percentage in 2000 and 2010 with more than 30 %, and this trend tends to increase mainly in the Southwest and North of the watershed. Soil loss occurred mainly in Dry agriculture land area with slope above 250 in Ferralic Acrisols (Fa) while there is very low amount of soil loss in slope from 80 to 150 with land use type of forest mixed in Ferralic Acrisols (Fs).Approach method integrating SWAT2009 model and GIS in this research allow to simulate the amount of soil loss and its spatial distribution in the small watershed scale effectively and quickly. This study also proves that flow data can be used during calibration process to replace sediment data in context of lack of this data. The results of daily flow calibration processes show good fit between simulated and observed data.Therefore, the results of applying these tools are reliable and prove that is a good support tool for resources managers, especially land policy-makers and stakeholders in building scenarios of land use and identifying potential level of soil erosion respectively. Hence, recommendations and policy decisions are made in order to use land resource reasonably and reduce negative impacts of soil erosion.
References
| [1] | Betrie, G. D., Y. A. Mohamed, A. Van Griensven, and R. Srinivasan. 2011. Sediment management modeling in the Blue Nile Basin using SWAT model. Hydrol. Earth Syst. 15: 807-818. |
| [2] | Gassman, P.W., M.R. Reyes, C.H. Green, and J.G. Arnold. 2007. The soil and water assessment tool: historical development, applications, and future research directions, Transactions of the ASABE 50(4): 1211-1250. American Society of Agricultural and Biological Engineers. |
| [3] | Geißler, C., Nadrowski, K., Kühn, P., Baruffol, M., Bruelheide, H., Schmid, B., & Scholten, T. (2013). Kinetic energy of throughfall in subtropical forests of SE china - effects of tree canopy structure, functional traits, and biodiversity. PLoS One, 8(2)doi:http://dx.doi.org/10.1371/journal.pone.0049618. |
| [4] | Gupta, H.V., A. Sorooshian, and P. O. Yapo. 1999. Status of automatic calibration for hydrologic models: Comparison with multilevel expert calibration. Journal of Hydrologic Engineering. 4 (2): 135-143. |
| [5] | Lal R. 1998. Soil erosion impact on agronomic productivity and environment quality. Crit Rev Plant Sci 17(3):319–464 |
| [6] | Le Van Du. 2011. Farming practices and soil quality. International workshop on vegetable agroforestry and Cashew-cacao systems in Vietnam. Ho Chi Minh City, Vietnam. WASWAC. 6a: 63-70. |
| [7] | Mekonnen, M.A., A. Worman, B. Dargahi and A. Gebeyehu. 2009. Hydrological modeling of Ethiopian catchments using limited data. Hydrological Processes 23(23), 3401-3408. |
| [8] | Ministry of Natural Resource and Environment, 2012. Land degradation Inventory Framework. Hanoi. |
| [9] | Nash, J.E., and J.V. Suttcliffe. 1970. River flow forecasting through conceptual models, Part I. A discussion of principles. Journal of Hydrology. 10 (3), 282–290. |
| [10] | Neitsch SL, Arnold JG, Kiniry JR, Srinivasan R, Williams JR. 2009. Soil and Water Assessment Tool, Theoretical Documentation: Version 2009. USDA Agricultural Research Service and Texas A & M Blackland Research Center: Temple. |
| [11] | Nguyen Anh Hoanh. 2010. Comprehensively studying geographical arising and land degradation aiming the purpose of reasonably using land resource and preventing disaster in Binh - Tri - Thien region. Doctor of Philosophy Dissertation. Hanoi. (In Vietnamese) |
| [12] | Nguyen Dinh Ky and et al. 2007. Studying, assessing and forecasting land degradation in the North Central of Vietnam aiming sustainable planning. Final report of research run by Ministry of Science and Technology, Hanoi. (In Vietnamese) |
| [13] | Le Phuc Chi Lang and Pham Thi Tuyet Mai. 2012. Assessing potential of land degradation in Thua Thien Hue Province. Journal of Science, Hue University. Vol 74A, No 5, page 77-84. (In Vietnamese) |
| [14] | Oeurng, C., S. Sauvage, J. M. Sánchez-Pérez. Assessment of hydrology, sediment and particulate organic carbon yield in a large agricultural catchment using the SWAT model model. J. Hydrol. 401: 145-153. |
| [15] | Pimentel D, Harvey C, Resosudarmo P, Sinclair K, Kurz D, McNair M, Crist S, Shpritz L, Fitton L, Saffouri R, Blair R. 1995. Environmental and economic costs of soil erosion and conservation benefits. Science 267:1117–1123. |
| [16] | Quyang, W., A.K. Skidmore, F. Hao and T. Wang. 2010. Soil erosion dynamics response to landscape pattern. Science of the Total Environment. 87(6), 1358-1366. |
| [17] | Rossi, C.G., R. Srinivasan, K. Jirayoot, T. Le Duc, P Souvannabouth, N.D. Binh and P.W. Gassman. 2009. Hydrologic evaluation of the lower Mekong River basin with the Soil and Water Assessment Tool model. Int’l Agricultural Engineering J. 18(1-2), 1-13. |
| [18] | Tran Thi Phuong and Huynh Van Chuong. 2013. Simulating effects of land use change on soil erosion in Bo River basin in the Central of Vietnam. Journal of Agriculture and Rural Development, Vol 2 - October. (In Vietnamese) |
| [19] | Wang, X., S. Shang, W. Yang, C. R. Clary, and D. Yang. 2010. Simulation of land-use soil interactive effects on water and sediment yields at watershed scale. Ecological Engineering. 36: 328-344. |
| [20] | Williams, J.R. 1975. Sediment Yield Prediction with Universal Equation using Runoff Energy Factor, ARS-S-40. Agricultural Research Service, Washington, DC. |
| [21] | Winchell M, Srinivasan R, Di Luzio M, Arnold J. 2010. Arc SWAT interface for SWAT 2009. Users’guide. Grassland, Soil and Water Research Laboratory, Agricultural Research Service, and Blackland Research Center, Texas Agricultural Experiment Station: Temple, Texas 76502, USA, p. 495. |
| [22] | Vu Anh Tuan. 2007. Studying current land use change and its effect on erosion in Tra Khuc River basin by Remote sensing and GIS. Doctor of Philosophy Dissertation. Institute of Science and Space Technology. Hanoi. (In Vietnamese) |
| [23] | Xu, Z. X., J. P. Pang, C. M. Liu, and J. Y. Li. 2009. Assessment of runoff and sediment yield in the Miyun Reservoir catchment by using SWAT model. Hydrological Process. 23: 3619-3630. |