-
Paper Information
- Paper Submission
-
Journal Information
- About This Journal
- Editorial Board
- Current Issue
- Archive
- Author Guidelines
- Contact Us
Resources and Environment
p-ISSN: 2163-2618 e-ISSN: 2163-2634
2014; 4(2): 79-85
doi:10.5923/j.re.20140402.01
Inspection Chart Mapping of National Power Corporation Watershed Agroforestation Areas
 Abstract
 Reference
 Full-Text PDF
 Full-text HTML
Eric D. Bimmoy, Joseph L. Ngohayon, Carmelito C. Valdez
Faculty, College of Agriculture and Forestry, Ifugao State University, Potia campus, Alfonso lista, 3608, Philippines
Correspondence to: Eric D. Bimmoy, Faculty, College of Agriculture and Forestry, Ifugao State University, Potia campus, Alfonso lista, 3608, Philippines.
| Email: |  |
Copyright © 2012 Scientific & Academic Publishing. All Rights Reserved.
This paper highlights the result of inspection chart mapping conducted National Power Corporation-Magat Watershed Reservation areas in Sitio Natlob, Barangay Halag, Aguinaldo, Ifugao, The study revealed that the highest survival rate of sapling and pole crop of forest tree species were recorded was Guyabano (Anona muricata) 23.18 Bugnay (Antidesma bunius) 10.3%, Coffee (Cofea arabica) 6.5%, Rambutan (Nephelium lapacium) 8% and Calamansi (Citrofortunella microcarpa) 12.6% species. Other fruit trees like Litoko (Calamus manillensis), Mangga (Mangifera indica), Banana (Musa sp.) and Datiles (Muntingia calabura) which might be both naturally disperse by birds and human, this wild fruit trees gives alternative foods for the people in the surrounding community.
Keywords: Inspection Chart Mapping, Watershed, Reforestation
Cite this paper: Eric D. Bimmoy, Joseph L. Ngohayon, Carmelito C. Valdez, Inspection Chart Mapping of National Power Corporation Watershed Agroforestation Areas, Resources and Environment, Vol. 4 No. 2, 2014, pp. 79-85. doi: 10.5923/j.re.20140402.01.
Article Outline
1. Introduction
- The Magat Watershed is one of the most important watersheds of the Philippines and has two primary purposes: as a source of irrigation water and as a provider of hydroelectric power and other vital infrastructures which serve as flood control, and other related uses. Comprising 4463.27 km2 in horizontal area and is administratively divided between the provincial governments of Ifugao, Isabela and Nueva Vizcaya (Elazuegi et al. 2004).The inspection chart mapping should be done to evaluate and monitor surviving seedlings in the agro-forestation areas. Such mapping will accomplish an early orientation toward proper management and sustainable development of the site, which may remedy both the dying and damage seedlings of the need for greater relevance in the reforestation activities.The aim of the project is to establish adequate and verifiable ground control for the effectives management and closer supervision of the NPC reforestation; be able to assess and determine the overall status of the completed 10- hectare agroforestation project of NPC through 100% counting of seedling planted status of seedling and sapling survives and establish monitoring plot to assess the growth performances of various species planted in varying location and conditions. The life span of the dam has been significantly shortened by siltation of the reservoir. Floods have also become more frequent (Lasco et al.2009). The need to rehabilitate the degraded Ifugao watershed areas is very urgent, conducting more intensive research to analyze the farming practices and addresses certain areas which critical to rejuvenate and revive the current status is very urgent.Recent findings revealed that the area is already denuded and only patches of grassland and brush lands remain as the soil cover due to destructive activities such as improper land-use, hillside cultivation and uncontrolled grazing (Elazuegi et al. 2004). Illegal activities enhance soil erosion of the watershed area that contributes to the sedimentation of the reservoir threatening the life span of the dam. Forest covers are mostly located along gullies, stream banks, steep slopes, ravine and the rest are dominated by cogon grasses. According to NPC the area is generally marginal due to severe forest degradation.
2. Materials and Methods
2.1. Project Strategy
- As a strategy, a communication was signed among the adjacent community duly approved by the Barangay officials and logistical support was asked from Mag-WAT NPC Team. To attain quality output, personnel with adequate qualification and experience were assigned to work dependently to perform its services with degree of skill and judgment to gather, organize and reconcile field data. The allotment of vehicles, drivers, and tents field kit, consumable foods and snacks, medicines, blank forms and field instructions was decided by the team leader depending upon the availability of staff. The assignment of duties to various ranks is also left at the discretion of the team leader particularly because the entire work is teamwork and defining duties of the staff would not be possible. The members of the team have to be assigned works by the project team leader considering their knowledge and capacity to work. These assignments may vary from time to time. The team leader distributed the work of inventory to the 3 working group of each group having 1 group leader and 3 members.
2.2. Location and Access to the Project Site
- The project team hired small boat to cross the reservoir, it takes about 35 minutes to the farthest site of Halag, and the team used private vehicle and motorcycles to other parts of project which are navigable by land in the nearby Barangay of Namnama, Alfonso lista, Ifugao. The partner of the project was always ready to provide logistical support to the project technical team. For instance, to facilitate the expeditions to the area for data collection, the transport to the area, acquisition of GPS used in locating blocking boundary and monitoring plot, as well as hiring local farmers, providing food and lodging conditions in the project area. The involvement of private partner in implementing the project did not present any risk that could hamper and hinder its implementation. The team spent the night at the site necessary to complete the ICM activities because of the distance to the area, which are very accessible and near the reservoir and can be reached through water by boat in just about 15 minutes.
2.3. Survey of the Project Areas
- Verification survey was conducted by the team to ascertain the position and description of the existing survey monument and markers established in the reforestation, the boundary lines was indicated. Based on the gathered data using GPS receiver the result of the survey activities were plotted using AutoCAD with scale of 1:10,000 and subdivided to 1 hectare per block. Figure 2, shows the boundary of the plantation area per block of 1 hectare each was plotted on the Inspection Chart Map (ICM) form.
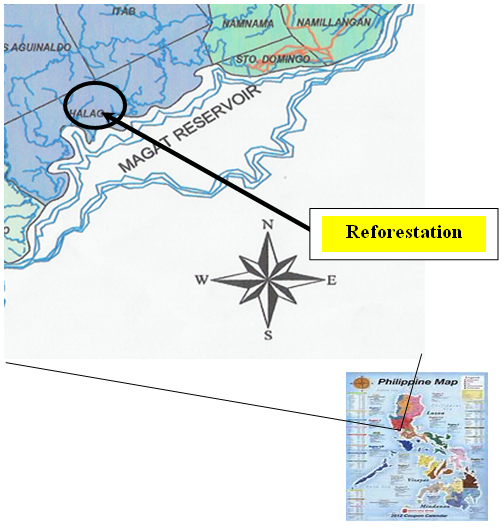 | Figure 1. Location of the study |
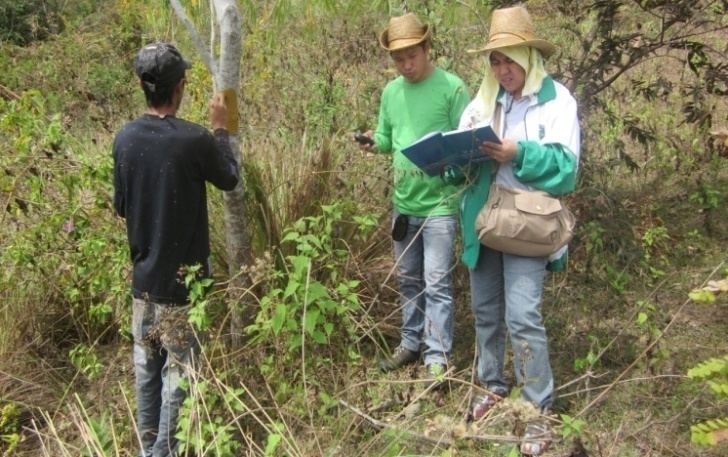 | Figure 2. Tagging and recording counted seedlings |
2.4. Actual Counting of the Seedlings Planted
- The team was subdivided into group to work independently, using the reference map of the plantation area as result by blocking given, 10 hectare block was derived and further subdivided to 1 hectare block. UTM coordinates of the corner points of the 1-hectare block were again derived using GPS receiver. After the team finished deriving the boundaries of the 1 hectare block, they constructed semi-permanent marker made of wood painted with red and installed it each in the boundaries. Monitoring plot of 10x20 m(200 sqm) following cardinal direction with each corners plotted in the survey map using GPS instrument was established using stratified random sampling for every 10 hectares for every completed project while two monitoring plot for size ranging from10 hectares or more. Designated project staff worked on the tagging and marking of seedlings that are found within each monitoring plot.Team leader of the working group designated person and assigned each every 1 hectare block for 100 % counting of seedlings. The seedlings were evaluated and judged as to living, dead/ dying and missing.
3. Result and Discussion
3.1. General Profile
- The study site shown in Figure 1, located at barangay Halag reforestation areas has a total land area of 10 hectares, surrounded by water in the far flung Barangay in the municipality of Aguinaldo, it can be traveled by water using passenger and hired small boat or by land using single motorcycle and by hiking. The reservation is under the administrative jurisdiction of National Irrigation Administration (NIA) by virtue of LOI 1002. However, through MOA between NIA and NPC, a total of 4,300 hectares was given to NPC for its management and development. This area is located within the immediate vicinities of the Magat Reservoir in the Province of Ifugao.a. Vegetation and Topography. Characterized as multistory canopy agroforestry, with an area of 10 hectares Natlob has a forest floor occupied by ferns, vines, saplings of palms, rattans, and regenerations from dominant trees. The closed canopy of the area favors the growth of shade tolerant species. It was planted by Guyabano, Bugnay, Coffee, Rambutan and Calamansi species; the shade tolerant species depend and adapt at the edge of the creek and ponds, other depend on sunlight entries and crown opening. The intensity of regeneration or number of seedlings in portion of the project is adequate. Species of regeneration under the canopy are very diverse and abundant. Two variations in canopy layers were distinguishable storeyed pole crop and saplings into upper and lower storeys. Livestock grazing incidence is from moderate to lightly graze. Presence of grasses species is prominent in the area.b. Percentage survival of species planted. In the table 1, shows that the highest survival rate of sapling and pole crop of forest tree species were recorded was Guyabano (Anona muricata), 23.18, Bugnay (Antidesma bunius) 10.3%, Coffee (Cofea rabica) 6.5%, Rambutan ( Nephelium lapacium) 8% and Calamansi (Citrofortunella microcarpa) 12.6% species. Other fruit trees like Litoko (Calamus manillensis), Mangga ( Mangifera indica), Banana (Musa sp.) and Datiles (Muntingia calabura) which might be both naturally disperse by birds and human, this wild fruit trees gives alternative foods for the people in the surrounding community. High mortality of seedlings might be caused by animal grazing and anthropogenic activities.
3.2. Pest and Diseases
- Incidence of injuries to pole, crop, saplings and seedling is minimal, some recorded are wild and domestic animal damages like bark eating, borer, root rot and leaf spot also visible but in limited areas only. Lopping for fodder collection was observed which resulted to wound and fungal infection. There are no significant losses in the plantation project due to biotic agent.
3.3. Monitoring Plot
- Two monitoring plot per block of 10 hectares were established. Figure 3 also shows the subdivision of block for designating actual counting and establishment of monitoring plot. Pole, saplings and seedlings that are found within each monitoring plot was tagged and marked using red color paint. As shown in table 1 and 2 saplings located are recorded these are Guyabano, Rambutan, Citrus and some from the genus Writhia, Ficus, and family Euphorbiaceae and Lauraceae.The average height of intermediate is 5-7 meters in average heigh and 10-15 diameters at breast height was recorded in the area were measured and estimated.
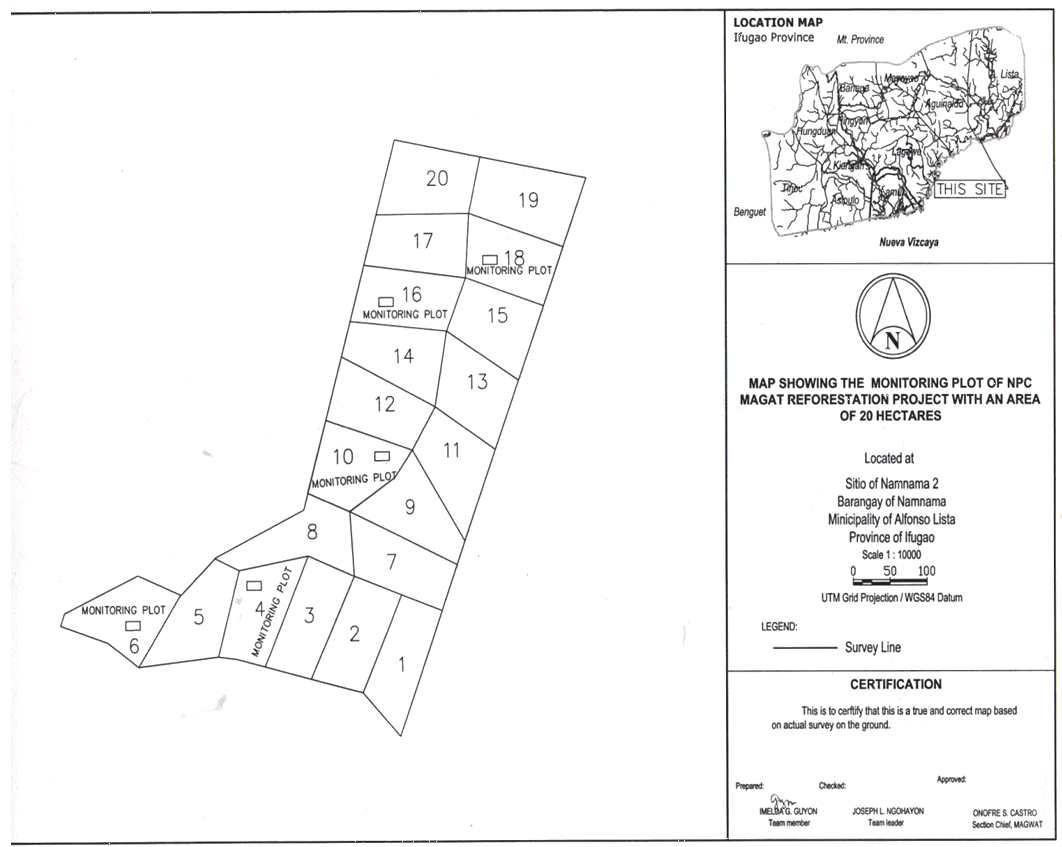 | Figure 3. map showing the 10x20m (200sq m) monitoring plot and subdivided 20 hectares into 1 hectare per block for 100% actual counting of seedlings survived |
|
|
3.4. Inspection Chart Mapping (ICM) Form
- Figure 4 shows the standard ICM forms used in assessing the actual count of trees survived and died. Study further revealed that large part of the areas is not plantable because of steepness and the presence of rocks and water resources such as creeks and river in lower portion of the areas.
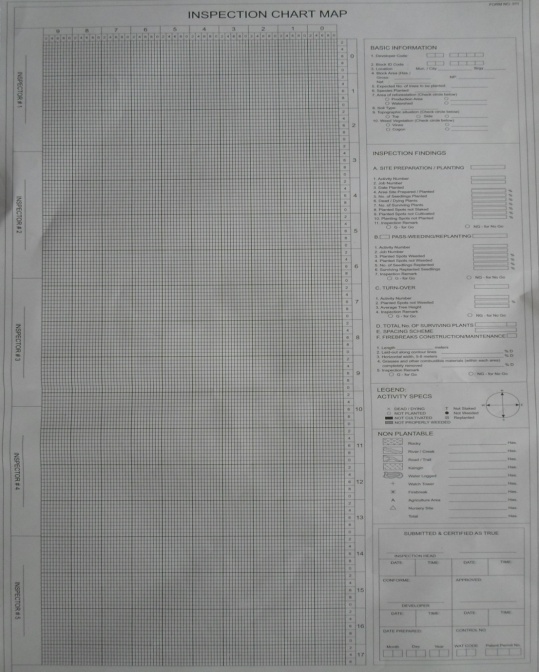 | Figure 4. Inspection Chart Map used in the actual counting |
4. Conclusions
- Plantations were mainly damaged by anthropogenic activities, the protection of the project sites is the main priority in order to conserve and sustainably manage its existence. Encouraged by the government project reforestation, many of farmers are accumulating broad knowledge about timber for various reasons for household consumption of wood products, accumulate capital and income source. However some constraint in the planting practice has been noticed. The lack of more diverse planting species, the manifestation of heavily subsidized fast growing species, and lack of support system for technology based training on grazing management and poor seedling market access and opportunities.
5. Recommendations
- The following is recommended;1. Shade tolerant species of shrub like cacao, lansones, banana and others of the same height must be planted when nitrogen fixing plant are sown in plantation boundary.2. Planting of short and medium-term crops such as pineapple, sweet potato, sorghum and pigeon pea should be planted between desired plantation strips.3. Woody lianas of the rattan species must be planted inside closed canopy to enhance and enrich plantation species.4. Replant fruit trees that have died, pruning is also needed to shorten fruiting season and enhance growth. Fertilization must be regularly done to support stunted seedlings for growth enhancement. 5. The northern part of the project approximately 5-7 hectares is recommended to be a natural regeneration site for forest trees because of the presence and abundance of some premium and other pioneering species.6. Perimeter fencing of the area to stop encroachment of upland peoples.7. Regular monitoring of the site to avoid the expansion of kaingin practice inside the project.
ACKNOWLEDGMENTS
- The author wishes to acknowledge the National Power Corporation for the funding contributions in the fulfillment of this project.Furthermore, the peoples in the community for giving the project team access to the reforestation areas including tools and materials used in the sites.
References
| [1] | Castaneto, Y.T., 2006. Manuals on Forest Pathology, NVSU, Philippines. |
| [2] | Elazegui, D. D. and E. A. Combalicer., 2004 .Realities of theWatershed Management Approach: The Magat Watershed Experience. Philippine Institute for Development Studies. Discussion Paper Series no. 2004-21. |
| [3] | Fernando, E.S., 2007. Checklist of Species in FBS 21Taxonomy of Forest Plant, UPLB Philippines. |
| [4] | Lapitan, P.G., 2010. Biodiversity and Natural Resources Conservation in Protected Areas of Korea and the Philippines. |
| [5] | Lasco, R. D., F. B. Pulhin and R. F. Sales., 2007. Analysis of Leakage in Carbon Sequestration Project in Forestry: A case Study of Upper Magat Watershed, Philippines, Springer. 12: 1189-1211. |
| [6] | Rossing W.H., 1998. Control Method in Integrated Pest Management IPM, Wageningen, The Netherland http://www.napocor.gov.ph/WMD%20WEBPAGE/area%20teams/magat.htm. |