-
Paper Information
- Next Paper
- Paper Submission
-
Journal Information
- About This Journal
- Editorial Board
- Current Issue
- Archive
- Author Guidelines
- Contact Us
Resources and Environment
p-ISSN: 2163-2618 e-ISSN: 2163-2634
2014; 4(1): 1-12
doi:10.5923/j.re.20140401.01
How and Much Does the Housing Market Pay for Environmental Amenity? A Malaysian Case
 Abstract
 Reference
 Full-Text PDF
 Full-text HTML
Abdul Hamid Mar Iman1, Tan Yu Tian2, Suriatini Ismail3
1Environment and Natural Resources Sub-Cluster, Faculty of Earth Sciences, Universiti Malaysia Kelantan, 17600, Jeli, Kelantan, Malaysia
2Department of Real Estate, Faculty of Geoinformation and Real Estate, Universiti Teknologi Malaysia, 81310, Johor Bahru, Johor, Malaysia
3Faculty of Creative Technology and Heritage, Universiti Malaysia Kelantan, 16300 Bachok, Kelantan, Malaysia
Correspondence to: Abdul Hamid Mar Iman, Environment and Natural Resources Sub-Cluster, Faculty of Earth Sciences, Universiti Malaysia Kelantan, 17600, Jeli, Kelantan, Malaysia.
| Email: |  |
Copyright © 2012 Scientific & Academic Publishing. All Rights Reserved.
There has been no empirical evidence of the importance of environmental amenity to house price reported from a developing market. This paper fills in the gap by taking the state of Terengganu, Malaysia as a case study. Based on the stated preferences for environmental amenity among potential home-buyers and 442 sale transactions recorded between 2006 and 2010, environmental amenity elements were included in the hedonic model of house price. The empirical results were generally consistent with those obtained from respondents’ feedbacks. This paper concludes that there is evidence to show that the housing market the study area places a significant importance of environmental amenity. As an implication, environmental amenity should remain as a major factor in a sustainable housing market in Malaysia.
Keywords: Environmental Amenity, Hedonic Model, House Price
Cite this paper: Abdul Hamid Mar Iman, Tan Yu Tian, Suriatini Ismail, How and Much Does the Housing Market Pay for Environmental Amenity? A Malaysian Case, Resources and Environment, Vol. 4 No. 1, 2014, pp. 1-12. doi: 10.5923/j.re.20140401.01.
Article Outline
1. Introduction
- Property price measures differences in people’s desirability for the environmental services rendered by a property[1]. From human ecology perspective, the natural environment influences people’s residential choices which result from human interactions with particular environmental components such as land, water, air, land cover, and other natural resources[2,3]. In general, the environment could supply amenity or disamenity to residents based on its different elemental characteristics[4]. For example, people will pay a premium for attractive views[5].However, environmental amenity does not actually yield an evidently quantifiable price in the market. Fortunately, the implicit prices of environmental amenity could be estimated by regressing house price on the amenity that is inherent on site. This is different from the popular option for valuing environmental amenity which is often based on the stated preferences methodology[6]. However, no attempt has been made to estimate the implicit price of environmental amenity or to differentiate between amenity types and qualities in the Malaysian housing market. This might be caused by the difficulty in determining the level of house price differentials attributable to particular amenity features[7].Views observable from homes, for example, are sometimes embedded in a price model as independent variables, with a limited analysis on the value of environmental amenity[5]. In other words, houses are commonly classified as “view” property or “non-view” property, with no attempt to distinguish between different qualities of view[8]. As a matter of fact, there is real need for a comprehensive measurement of the quality (e.g. panoramic, partial, or poor) and type (e.g. water, mountains, valleys) of environmental amenity[9]. As mentioned, generally, a regression method can be used to estimate the contribution of a particular characteristic on some composite commodity (in this case, house) from the property itself[10,11,12]. In view of this, our study attempts to examine the differentiation of view amenity by both type and quality in assessing the premium offered by the market in house purchase.The state of Terengganu, Malaysia is chosen for study on two main reasons. First, being a state with a long coastal line, it has a good mix of ocean and inland water views while having a good proportion of terrestrial landscapes. Second, our analysis of property data from the Property Market Reports (various years) shows that the state of Terengganu still stands at the bottom four of least dominant property markets in Peninsular Malaysia, in terms of volume of property transaction. Based on data for 2007, the state’s property market is dominated by residential (54%) and agriculture (30%); the rest is made of development land (12%), commercial (3.5%), industrial (0.2%), and others (0.3%)[13]. In terms of price, Terengganu still has among the “cheapest” properties in the country, reflecting a less mature market stage. Further scrutiny of the data from the Property Market Reports (various years) finds that this trend has persisted over a long period of time from 1978 to 2012. Our analysis and property site inspections also discovered that despite being in urban, semi-urban, and semi- country - side, many properties are still surrounded by multiple landscape views, providing various environmental amenity elements to these properties. The question are, with such a conspicuous phenomenon, do home buyers notice its significance and, thus, attach it to the asking price of residential properties in the area? How and much does the market pay for environmental amenity?
2. Literature Review
2.1. Environmental Amenity
- In the simplest terms, environmental amenity refers to a view of scenery of a portion of a territory whose eyes can comprehend in a single view[14]. It is a scene generated via observation, either on natural or built environment from one focal point that provides inspiring vistas and pleasing environment while contributing to the economic value and comfortable enjoyment of real property[15,16].The number of past studies measuring the effects of environmental amenity on house price has come to the hundred and listing all of them would be unproductive. With this sheer number, perhaps, there are little issues left to be learnt from any new study. Notwithstanding this, the specific amenity elements that significantly influence house price and their magnitudes of effect will never be the same from one case to another and, therefore, the actual outcomes remain to be determined empirically.Overall, the most prevailing types of amenity measured are ‘view’ and ‘distance’ or ‘proximity’. Examples of view include general view, ocean view, water view including lake and river, open space, park, garden, woodland, green strip/space, and mountains view. Examples of distance or proximity are distance to water bodies such as beach, coast, seashore, river, lake, proximity to forest, public park, garden, urban landscape, distance to agriculture and water, and distance to nearest mountains. To illustrate a few cases, among the impacts on house price of environmental amenity elements being evaluated are appearance of the residential area, air quality, area of trees and greenery nearby[9]; views of woodland, urban area, and open water area[17]; land uses, air and water quality[18]; and environmental attributes such as view of green spaces and proximity to wood and water bodies[19]. This later study has focused on environmental externalities such as view of green space, water body, street, and building[5,20].Environmental beauty is often embedded in landscape components, as it is a physical trait of the landscape. Thus, researchers often relate environmental beauty to the landscape background such as sea, river, and mountain. Pleasant environmental amenity such as ocean frontage, ocean, and lake views usually contributes to the positive impacts on residential property value[8,21]. However, it does not mean that all the visual impacts of these landscapes will definitely give a positive impact on house price. Unappealing views such as weak quality of view and cemetery view, for example, lead to the reduction in residential property value[5].Due to the heterogeneity of preferences towards the variety of environmental amenity, consumers’ fondness is considered to be a major problem in estimating the willingness to pay for environmental attributes. Several researchers presumed that preference on environmental aesthetics actually depends on the views observed, which would possess a knowledgeable perception or prospective functional significance for the perceiver[22, 23]. Therefore, it is important to have an understanding of people’s evaluation and preference decisions in environmental view assessment. In this context, some studies have classified environmental amenity according to natural and built environment and discovered that people prefer view of natural environment to built environment[22,23]. This paper is also scoped to natural environment to represent environmental amenity.With the exception of China, most of the studies cited above focused on the developed property market. Do home buyers in a developing property market like Malaysia also consider environmental amenity elements in their home purchase? If yes, are these elements being capitalized into home price? In a study on residential waterfront development in Malaysia, it is said that panoramic water view adds an improvement to the value of waterfront property for a total of 59%[24]. Our study indirectly attempts to verify this claim. If the result is positive, we can argue that accounting for environmental amenity is vital in property development appraisal in Malaysia, apart from its importance in property valuation.
2.2. Modelling the Effects of Environmental Amenity
- Almost all studies dealing with the valuation of view in housing price apply the regression models[25]. They are voluminous and their complete listing in this study is not desirable. The regression model is well-established for assessing the market value of individual characteristics of a given good[26,27]. The general form of hedonic model can be specified as follows:
 | (1) |
 is the sale price of house, Sij denotes structural housing characteristics such as land area, floor area, age, property type;
  represents house sub-markets such as sub-district and time dummy;
  represents locational variables such as distance to CBD, to major roads, and availability of clubhouse;
  represents environmental amenity variables of interest,
  is error term, i, j, and t represent individual house, house sub-market, time period, respectively. The vector of regression coefficients,
  represents the implicit prices of environmental attributes in which we are interested to estimate. The treatment of “view” and “non-view” properties can use single-dummy (“with” and “without view”) or multi-dummy variables (combining view with other factors such as visual quality, distance, and other environmental features)[5,8,28,29,30,31].In equation (1),
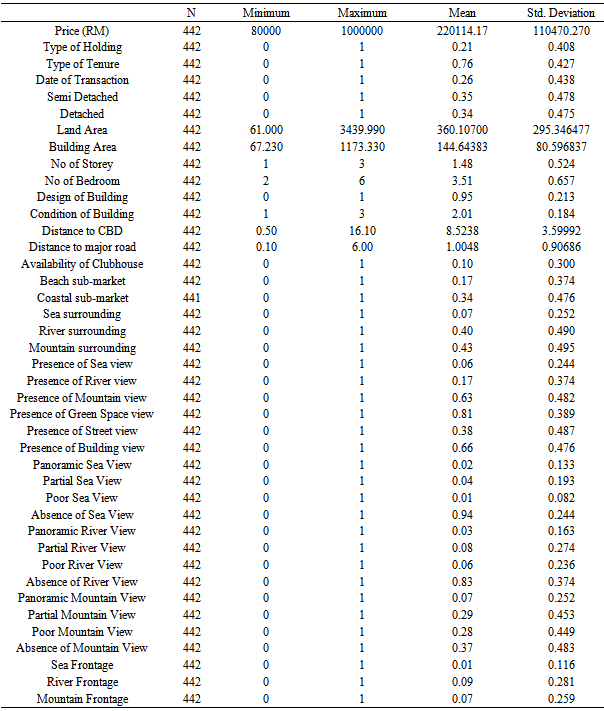
  in particular, can be denoted by a (1,0) dummy variable representing a given element of environmental view for a property i in a locality j. The expected regression function of “view” properties is given in equation (2) while that of “non-view” properties in equation (3).
 | (2) |
 | (3) |
 This
This  quantity is exactly equivalent to the value of dichotomous variable
  ’s slope in equation (1). Note that since one of the two groups is made the control group,
  should be interpreted as the amount of differential effect of environmental amenity on house price between the “included” and “control” groups, particularly between “view” and “non-view” properties. The
  from the regression model is a parameter that is used to estimate price discount or price premium resulting from a particular environmental amenity element.The results for
  can vary. For example, a full ocean view has added 68% premium to property price, indicating that sea ranks first as the most pleasant view[8]. In terms of measuring the view, some studies adopted visual impact assessment rather than simple view assessment[5,17]. An observer’s field of vision or view from ground is analysed in the measurement of degree to the view observed on the landscape. This paper measures both visual impact and simple view effects.It is important to inspect and observe from the respective properties to account for surface elements like vegetation or buildings that may cause obstructions or may block view. Several measurements that may affect the outcome of view qualities, observed from the landscape context, are also considered such as presence of view, level of visibility, proximity from the view, position from the view, etc. In our study, we assume a situation where the regression intercepts, not the slope, are different between the two discriminating groups, “included” and “control” groups. This is because, in this study, we only wish to investigate a dichotomous situation of “view” or “non-view” (and not the “levels”) of environmental amenity among the sampled properties so that only differentiation of the intercept dummies is required to measure environmental view effects on house price.For capturing such effects, statistical analysis is applied for analysing property prices against environmental amenity or otherwise disamenity[32]. The theoretical foundation of measuring such phenomena dated back in the 1970s, whereby property data were used in the regression equation of residential values. The principle of this method is that, if similar homes sell for less, all else equal, the conditional differences in price are interpreted as the market discount attributed to the problem for properties being closer to the source of disamenity. In the same way, if similar homes sell for more, all else equal, the conditional differences in price are interpreted as the market premium attributed to the advantage for properties being closer to the source of amenity.The appropriate functional form of the model in equation (1) is arguable. Some studies applied a linear form model [30,33,34]. Others choose a double-log[33,35]; semi-log [4,20,36,37]; inverse semi-log[38]; and translog[39]. Following a proposition[40], some other studies made a comparison of these functional forms combination [41,42,43,44] using the Box-Cox transformation[45,46]. In our case, we adopt the approach as follows:
 | (4) |
 and
and  are the parameters used to perform a transformation on house price and continuous independent variables, respectively, while other variables are as defined earlier.Different values of λ and
  can be chosen for the dependent and continuous explanatory variables, respectively. However, the search procedure would not be efficient if the number of λ and
  is more than two or three [47]. Thus, to avoid the estimation becoming cumbersome, it is assumed that λ=
 for all variables (see[48]).In addition, the Box-Cox transformation has one major caveat: the optimum equation may not produce a model that can be easily used for estimating the implicit prices of property attributes[49]. This occurs when the optimum equation results in the Box-Cox parameter, say λ, such that 0> λ >1, for the dependent variable. Furthermore, parameter estimates tend to be unstable, that is, they are susceptible to inclusion of other variables in the regression equation. Therefore, the choice of model for estimating these implicit prices is normally confined to the special forms of Box-Cox functions. In this context, if (λ,
  ) = (1,1), Equation (1) produces a linear model; if (λ,
  ) = (0,0), it is a double log; if (λ,
  ) = (1,0), it is a linear-log; and if (λ,
  ) = (0,1), it is a log-linear. In these special cases, the choice of best function is determined primarily by the standard statistical tests, two of which are the likelihood ratio test[50,51] and the Box-Cox test for model equivalence[48]. Apart from the above tests, other basic statistics such as the
  , sign and magnitude of the regression parameters, t-values for individual regression parameters, and Sum Squared Errors (SSE) (or Mean Squared Errors (MSE) or Root Mean Squared Errors (RMSE)) will also need to be collectively evaluated, to choose the most appropriate model to use.
3. Data and Analysis Procedure
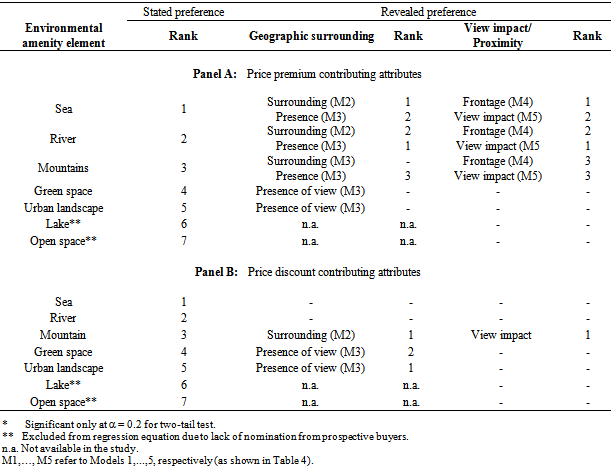
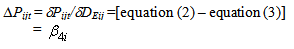
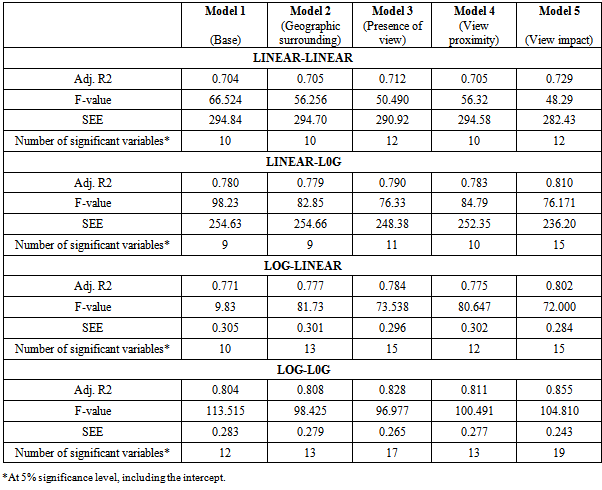
- The study covered thirteen localities in the state of Terengganu, Malaysia. Data collection was carried out in two stages. The first stage involved interviews with sixty randomly picked potential home-buyers in the study area to simulate buyers’ preferences for environmental amenity. The stratified sampling method on the study area’s population was adopted to choose home-buyers for interview. We asked about their stated preference of willingness-to-pay for view of certain landscapes in the study area. A brief interview was conducted in order to identify the elements of amenity that they may be willing to pay if they buy a house. Seven types of environmental amenity were available as options, namely sea, river, lake, mountain, open space, green space and urban view. Each respondent was given the option to choose three types of environmental amenity that he/she preferred most.The number of buyers’ nominations for these views were found to be in the following order: sea view (53), river view (41), mountains view (38), green space view (31), urban landscape view (15), lake view (2), and open space view (1). The result shows three key elements of environmental amenity – sea, river, and mountain – which could have been most preferred by home buyers. Lake view and open space view were ranked lowest; lake view was almost physically absent in the study area while open space view was not chosen by the respondents at all. Therefore, these two types of landscape view were excluded from this study.In the second stage of data collection, state-wide house transactions were randomly selected from thirteen localities, namely (number of transactions in brackets) beach localities comprising Batu Buruk (66), Cenering (59) and Kuala Ibai (55); coastal localities comprising Kuala Terengganu (15), Cabang Tiga (11), Kubang Parit (18), Gelugur Kedai (42), Losong (18), Manir (44), Paluh (6) and Tok Jamal (17); and inland localities comprising Bukit Besar (45) and Kepung (46). These gave a sample of 442 transactions comprising terraced, semi-detached, and detached houses. The data were obtained from the Department of Valuation and Property Services, Kuala Terengganu. The assessment of environmental view was carried out on-site based on appraiser’s judgement.The assessment of environmental amenity was made on four aspects, namely geographic surrounding, presence of view, view impact, and view proximity. Geographic surrounding does not require an observable view from a property, rather a mere location of a property within a given type of environmental amenity. For presence of view assessment, we simply identified the “presence” of a particular environmental view observable from each inspected property. For view impact assessment, the method of measurement was relatively complicated. Generally, we replicated the studies that have chosen, in their models, view impact of environmental amenity, namely “panoramic”, “partial”, “poor”, and “no view”[8]; type, scope, and distance to view besides the appearance of landscapes and structures in the general neighbourhood of each property[30]; and type, availability, accessibility, and visibility of amenity[4]. In doing so, we assess a particular type of view using a camera and a protractor as observation measuring tools. Since the quality of environmental view observed might vary according to distance from property, the elements of measurement such as “nearness" from the landscapes or view and the “position” of property from the surrounding environmental view were also included in view proximity assessment.The above types of assessment were included in reference to major environmental amenity elements, namely sea, river, mountains, green space, street view and building view. Dummy variables were used for these views, where the type/presence or quality/impact of environmental view was coded “1” and “0” otherwise. Literally, this method of measurement was applied to differentiate different types of environmental view. To examine the effects of environmental amenity on house price, these dummy variables were specified together with other variables of property attributes in five model specifications (see Table 1). Model 1 (base model) specified the basic property attributes, Model 2 incorporated geographic surrounding, Model 3 incorporated presence of view (position of property with respect to a certain environmental view), Model 4 incorporated view proximity; while Model 5 incorporated view impact of the environment. The Statistical Package for Social Sciences (SPSS) was used to analyse the data (see[52,53,54]).
|
4. Results and Discussion
4.1. Sample Profile
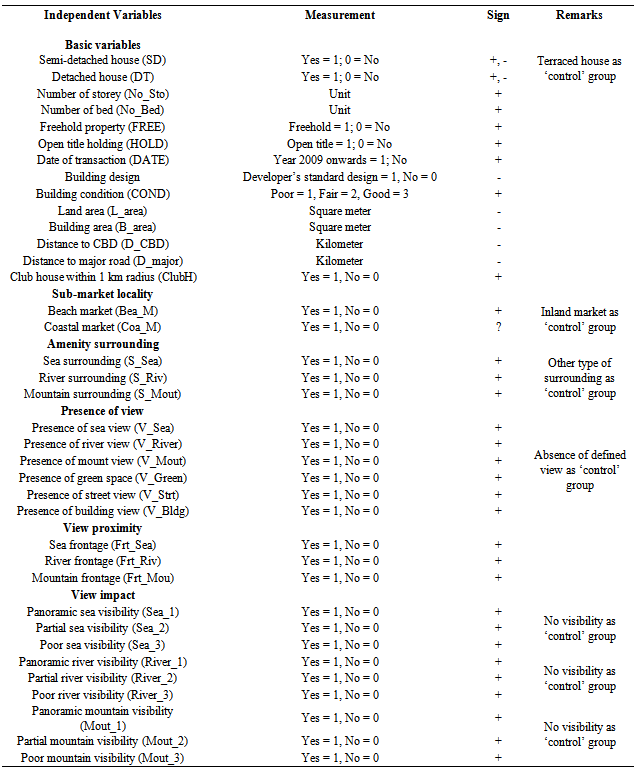
- The general profile of the sample is summarized in Table 2. The sample comprised 31% of terraced houses, 35% of semi-detached houses, and 34% of detached houses priced at the mean of RM 220,114 per unit. These houses have 2-6 bedrooms. The sample comprised 76% freehold and 21% open-title residential properties, respectively. Out of the sample, 26% of the houses were transacted after 2009 while the rest were transacted at earlier dates. Almost all, i.e. 95% of the houses were developer-designed and they were in good condition. The mean land area was 306.12 sq. m. while that of the building was 144.64 sq. m. giving the mean built-up area of 47.25% per property. The houses were quite close to town whereby the mean distance was about 8.5 km. With the mean distance of only about 1.0 km away, many houses were also close to major roads. However, only 10% of the houses were located close to clubhouse.The geographic backdrop of houses in the study area was generally dominated by mountains and rivers. However, most areas have multiple elements of environmental amenity with green space, buildings, mountains, and streets dominating the landscapes. Less than 1% of the houses have sea view background making this type of amenity as a scarce environmental resource.
4.2. The Regression Results
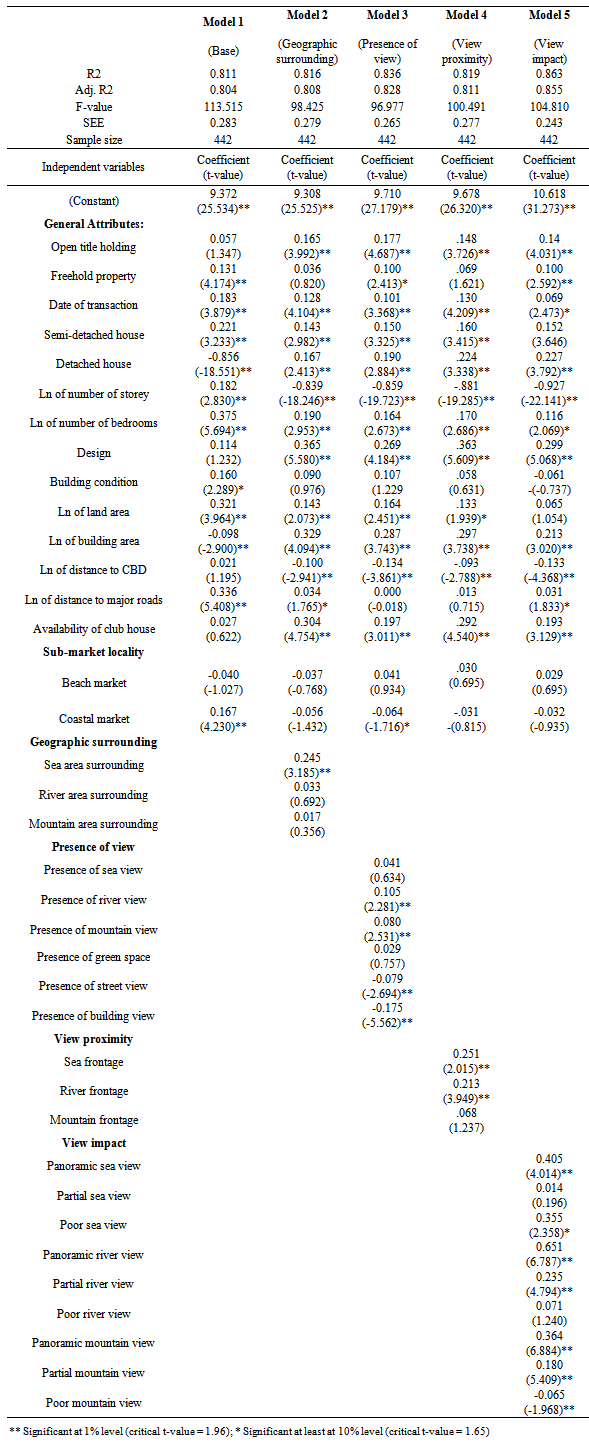
- From Table 3, the Box-Cox transformation using Equation (1) above and the pertinent diagnostic statistics (F-value, adj. R2, SEE) indicated that log-log function is the most appropriate model to use. We also discovered that house price models expressed in per square metre unit explained the variation in the dependent variable much better than those expressed in per parcel unit (not reported here in order to save space) and, thus, we only report our results based on the per square metre log-linear model.Table 4 shows the regression results for the five log-log model specifications. Model 1 was the base model that included only essential property attributes. Models 2 through 5 tested how much the different ways of environmental amenity impact assessment could have changed the level of explained variation in house price.
|
|
5. Conclusions
- Our study has provided some evidence of how people in a developing market value environmental amenity in the context of house purchase. Primary data from a questionnaire survey were collected in order to identify important factors of view. The results have shown that view impact was the most important aspect of environmental amenity that has influenced house price in the study area. Besides, house buyers in Terengganu could have regarded river, sea, and mountain as the key sources of environmental amenity in a descending order. Results from both interviews and regression analysis have also indicated river and sea views as the most valued elements of environmental amenity. It is interesting to note that this finding was similar to a previous study[25].This study has two main implications. First, property valuation in Malaysia needs to explicitly account for environmental elements in estimating house price. Besides, a standard approach to valuing the influence of environmental factors needs to be in place in property development appraisal in Malaysia. Environmental amenity should continue to exist if sustainable property market is to be preserved. This means, while property market should continue to grow in Malaysia, it must not take place at the expense of environmental preservation and protection, especially in the rural areas.
|
|