Masakazu Yamashita, Jun Mitsumata
Department of Environmental Systems Science, Doshisha University, 1-3 Miyakodani, Tatara, Kyotanabe, Kyoto, 610-0394, Japan
Correspondence to: Masakazu Yamashita, Department of Environmental Systems Science, Doshisha University, 1-3 Miyakodani, Tatara, Kyotanabe, Kyoto, 610-0394, Japan.
| Email: |  |
Copyright © 2012 Scientific & Academic Publishing. All Rights Reserved.
Abstract
The present paper examines the theory that global warming causes abnormal weather phenomena involving typhoons, focusing on the numbers of typhoons that develop and hit Japan and their intensities. According to records, since 1980, there has been a decrease in the annual number of typhoons that develop during the year, whereas there has been an increase in those that approach and hit Japan. The annual number of typhoons since 1980 is the same as in the period between 1951 and 1960. The numbers of typhoons that approached and hit the country were the highest during the period from 1951 to 1970, and started to decline between 2001 and 2010. When compared to the data on the numbers of typhoons that developed, approached, and hit Japan during the period from 1951 to 1970, there have been no significant changes since 1980. Data on the monthly numbers of typhoons that develop, approach, and hit also suggest that there has been no significant prolongation of the typhoon season or delay in its start. Regarding the intensity of typhoons, there has been no significant change in the mean minimum pressure of typhoons, a decrease in the number of typhoons with a very low minimum pressure, and no significant increase in the number of typhoons with a very large maximum wind velocity.
Keywords:
Typhoon, Global warming, Develop, Hit Number, Intensity
Cite this paper: Masakazu Yamashita, Jun Mitsumata, Does Global Warming Affect Typhoon Patterns in Japan? Discussion from the Viewpoints of the Numbers of Typhoons That Develop, Approach, and Hit Japan, and Their Intensities, Resources and Environment, Vol. 3 No. 5, 2013, pp. 115-128. doi: 10.5923/j.re.20130305.02.
1. Introduction
In recent years, the mass media has reported abnormal weather phenomena around the world, including torrential rain, droughts, and increases in the frequency of extremely hot days. This has led people to think that abnormal weather phenomena have been more frequent in recent years, and become worried over their further increase without foundation. Nowadays, every time an unusual phenomenon occurs, people put it down to “global warming” without careful consideration.In fact, some of those unusual phenomena may have been caused by global warming. However, it makes no sense to overreact to every abnormal weather phenomenon and promote measures for the prevention of global warming and CO2 reduction activities based on their vague images. Has there actually been an increase in the frequency of abnormal weather phenomena? If there has been an increase, what are the causes? Are they really related to global warming? It is necessary to examine these points.When ten typhoons hit Japan in 2004 - a significantly larger number compared to the annual mean, people unquestioningly suggested its association with global warming[1]. In 2008, at his inauguration, Taro Aso, the Prime Minister at that time, stated regarding global warming: “There has never been a year in which no typhoon hit Japan”[2].The present study examined the status of the occurrence of typhoons since the early days of the use of the term global warming, focusing on their relationship with global warming.It is believed that, as global warming proceeds, there will be a decrease in the number of typhoons that develop annually, increase in the intensity of each typhoon (or in the number of large-scale typhoons), and a larger number of typhoons will hit Japan[3]. As a typhoon develops due to a temperature difference between seawater close to the equator and a neighboring body of water, when such a difference is small because of global warming, there will be a decline in the number of typhoons that develop in the area. When an increase in the temperature of seawater due to global warming facilitates the development of a typhoon, its intensity is considered to become higher. Furthermore, as typhoons may develop throughout the year because of elevated seawater temperatures, the typhoon season has become longer.These theories were examined on the assumption that the effects of global warming have been exerted since 1980.As global warming is predicted to affect the numbers of typhoons that develop, approach and hit the country, and their intensities, changes in them every ten years were examined based on best track data obtained from the Japan Meteorological Agency[4]. To examine whether or not the typhoon season has become longer, data on the monthly numbers of typhoons that develop, approach, and hit the country were organized and used.
2. Global Warming and Typhoons
2.1. Definition of a Typhoon
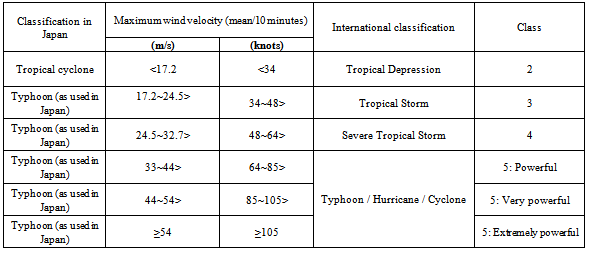
Low pressure systems that develop over tropical seas are referred to as “tropical cyclones”, and tropical cyclones that develop above the Northwest Pacific Ocean (the area located north of the equator and at less than 180 degrees east longitude) or the South China Sea with a mean maximum wind velocity (for ten minutes) of 34 kt (17.2 m/s, a wind force of 8) or higher, as measured in the low pressure area, are defined as “typhoons”. Tropical cyclones with a lower maximum wind velocity are not referred to as typhoons[5].Typhoons are classified into several groups according to the intensity, as shown in Table 1.It should be noted that the Japanese term “taifu” refers to a phenomenon different from a typhoon. The Japan Meteorological Agency defines tropical cyclones with a maximum wind velocity of 34 kt or higher as “taifu”[6], whereas tropical cyclones with a maximum wind velocity of 64 kt or higher are referred to as typhoons in the international community[7]. There is a wind velocity difference of 30 kt between tropical cyclones defined as typhoons and taifu. Therefore, in Japan, strong tropical cyclones are classified as typhoons.On the other hand, meteorological organizations in the U.S., such as the Joint Typhoon Warning Center, have adopted the Saffir-Simpson Hurricane Scale to classify strong tropical cyclones, including typhoons and hurricanes, based on the mean maximum wind velocity for one minute, as shown in Table 2[8].
2.2. Background, Typhoons, and Abnormal Weather Phenomena
In recent years, temperature rises on a global scale have been drawing attention. With this background, two abnormal weather phenomena increased Japanese people’s concern over typhoons: an unusually large number of typhoons that hit the country in 2004 and Katrina, a large-scale hurricane, that struck southeastern America at the end of August 2005. In 2008, former Prime Minister Taro Aso’s comment on global warming at his inauguration: “There has never been a year in which no typhoon hit Japan”, increased people’s concern over the relationship between global warming and the number of typhoons that hit the country (His remark was not true, as Japan had actually no typhoon in 1984, 1986, 2000, and 2008)[2]. An Inconvenient Truth, a documentary with Al Gore, pointed out that the intensity of hurricanes has become higher in recent years[9]. M Saunders et al. reported, using a statistical model with local sea surface temperatures and atmospheric wind areas as environment variables, that there was an approximately 40% increase in the number of hurricanes between 1996 and 2005, compared to their mean frequency between 1950 and 2000, because of increases in local sea surface temperatures[10]. When Typhoon No.14 approached Japan in October 2010, the media reported the possible prolongation of the typhoon season because typhoons rarely approach in that period of time[11]. The media also report that the typhoon season will be longer when a typhoon approaches Japan in May or June - earlier than the normal typhoon season. These forms of unusual weather have led to the theory that a typhoon may also develop as an abnormal weather phenomenon attributed to global warming.Table 1. Classification according to the intensity of the typhoon
 |
| |
|
| Table 2. Intensity of typhoons (based on the American standard) |
| | International classification | Category | Maximum wind velocity (mean/minute) | | Knots | Speed (m/s) | | Typhoon / Hurricane | 1 | 64~83> | 33~43> | | Typhoon / Hurricane | 2 | 83~96> | 43~49> | | Typhoon / Hurricane | 3 | 96~114> | 49~59> | | Typhoon / Hurricane | 4 | 114~136> | 59~70> | | Typhoon / Hurricane | 5 | ≥136 | ≥70 |
|
|
2.3. Effects of Global Warming on Typhoons
According to established theories on the development of typhoons, global warming decreases the number of typhoons that develop and increases their intensity (or the number of large-scale typhoons)[3]. The former is explained by a decrease in the temperature difference between seawater close to the equator and a neighboring body of water, and the latter is attributed to increases in sea temperatures that facilitate the development of typhoons. Energy required to develop and move a typhoon is generated when water vapor just above the ocean surface turns into raindrops, producing heated steam. The larger the volume of heated steam, the faster and larger the typhoon develops. As global warming proceeds, larger volumes of water evaporate from the ocean surface, and the amount of saturated vapor increases due to rises in temperature. As a result, a larger amount of latent heat is produced when vapor is condensed, and a typhoon or tropical cyclone with a higher intensity develops as the heat energy transforms into kinetic energy[12].One theory explains that the typhoon season has become longer because typhoons may develop at any time throughout the year due to increases in sea temperatures.Although most of these theories are supported by studies using numerical models, the World Meteorological Organization (WMO), in its “statement on tropical cyclones and climate changes” published at the end of November 2006, suggested that the theories had not yet been established[13].“An Inconvenient Truth”, a documentary with Al Gore, introduced the theory: “The numbers of hurricanes in Categories 4 and 5 almost doubled across the world over the past decades”, which still remains questionable. It has been pointed out that biases in previous records have not been adequately examined, and, therefore, the theory should not be considered as evidence-based[14].As described in the preceding paragraphs, there are various views on the effects of global warming on typhoons. The following paragraph examines recent changes in its influences based on measurements, including the numbers of typhoons that developed, approached, and hit Japan, and their intensities.
2.4. Data on Typhoons from an Average Year
Among various factors related to typhoons, the present study focused on three points that are considered to be affected by global warming: the number of typhoons that develop, approach, and hit Japan. In the study, measurements from an average year, or mean values in the 30-year period between 1971 and 2000, were used to compare data. Table 3 shows mean values related to typhoons. In the study, the approach of a typhoon refers to the time when its center has reached within 300 km of the coast of Japan, and the landfall of a typhoon refers to the time when its center has reached the coast of Hokkaido, Honshu, Shikoku, or Kyushu island. When a typhoon has passed by a small cape or hit the Okinawa Islands, it is not regarded as a landfall[15].| Table 3. Typhoon data from an average year |
| | | Number of typhoons that developed | Number of typhoons that approached | Number of typhoons that hit | Minimum pressure (hPa) | | Data from an average year | 26.7 | 10.8 | 2.6 | 963.6 |
|
|
2.5. Definition of Global Warming
This paragraph defines global warming to examine its relation with typhoons.Figure 1 shows changes in the mean temperature of the earth according to the IPCC third report[16].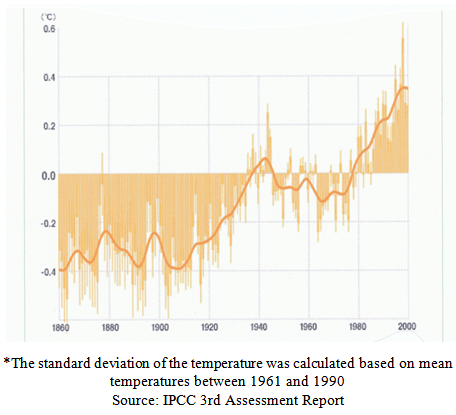 | Figure 1. Changes in the mean temperature of the earth (the earth as a whole / over the past 140 years) |
The phenomenon of global warming started to be discussed in the 1970s and became prominent in the 1980s. (Although some people argue that global warming is not actually occurring, the present study is based on the assumption that it is).In summary, typhoons have been affected by global warming since around 1980.
3. Number of Typhoons that Develop
The characteristics of typhoons that occurred prior to and following 1980 were compared to examine whether or not global warming affects them.A typhoon is believed to reduce the temperature difference between seawater close to the equator and a neighboring body of water[17]. As the temperature of seawater surrounding a typhoon area increases due to global warming, the temperature difference between seawater close to the equator and seawater in the typhoon area decreases, which reduces the number of typhoons that develop.
3.1. Changes in the Annual Number of Typhoons That Develop
Figure 2 shows changes in the ten-year mean annual numbers of typhoons that developed.As shown in Figure 2, the number of typhoons that developed has been changing in a cycle. The mean number in the period between 1951 and 1960 was 24.6 - smaller than the number in an average year (26.7). The number increased from 1961, and the mean number between 1961 and 1970 was 29.5 - larger than the number in an average year. The mean number between 1971 and 1980 was 26.5, which is similar to that in an average year. The number in the period between 1981 and 1990 was larger than that in an average year, and started to decrease again from 1991. After 1990, the number of typhoons that developed was larger than that in an average year four times: 29 typhoons in 1991, 36 in 1994, 28 in 1997, and 29 in 2004. Since the 1990s, there has been a decrease in the number of typhoons.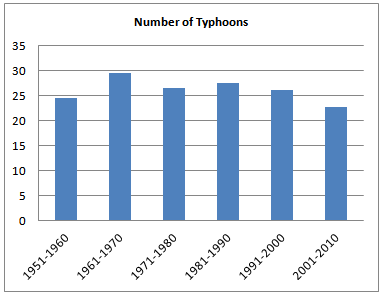 | Figure 2. Number of typhoons that develop |
 | Figure 3. Changes in the number of typhoons each month |
3.2. Changes in the Monthly Number of Typhoons that Develop
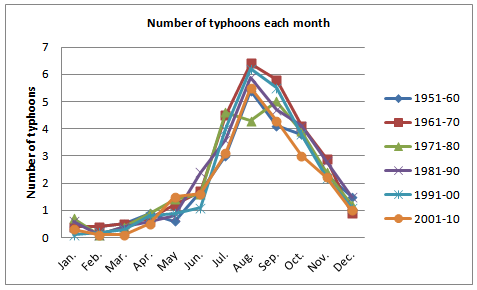
Figure 3 shows the numbers of typhoons that developed each month, and Figure 4 shows the number in an average year and data over the past ten years.As shown in Figure 3, only a small number of typhoons developed between January and April, and the number increased between July and November; the number was the largest in August. The period between 1971 and 1980 was an exception. In this period, the largest number of typhoons developed in September, followed by July and August in this order. The number of typhoons that developed in August between 1971 and 1980 was 2.1 times smaller, compared to the period between 1961 and 1970.Figure 4 compares the numbers of typhoons that developed in an average year and the period between 2001 and 2010. Changes in the number of typhoons in the period between 2001 and 2010 were similar to those in an average year. The monthly number of typhoons that developed was smaller in all months except May and August, compared to an average year. The number from July through to November was significantly smaller than in an average year. There were no significant differences in the monthly number of typhoons that developed between the two periods.
4. Numbers of Typhoons that Approach and Hit Japan
The unusually large number of typhoons that hit Japan in 2004 led to the theory that there has been an increase in the number of typhoons with a path toward Japan because of global warming. This chapter examines the theory based on typhoon data.
4.1. Changes in the Number of Typhoons that Approach Japan in Specific Periods
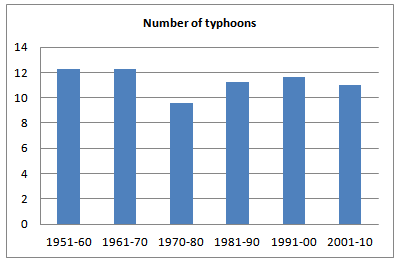
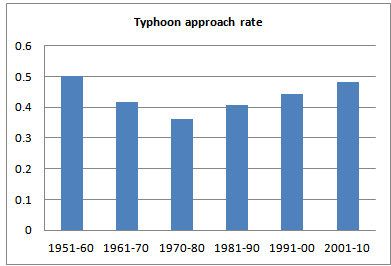
Figure 5 shows mean annual numbers of typhoons that approached Japan in ten-year periods. The mean annual number was 12.3 in the 1950s and 1960s - larger than the number (10.8) in an average year, it decreased prominently to 9.6 in the period between 1971 and 1980, and increased from the 1980s. The mean annual numbers between 1981 and 1990, 1991 and 2000, and 2001 and 2010 were 11.2, 11.6, and 11.0, respectively - each larger than the number (10.8) in an average year. Although the mean annual number has been increasing since 1980, it has not reached the level in the 1950s and 1960s. The numbers in 2008, 2009, and 2010 were 9, 8, and 7 - smaller than the number in an average year. This means that there has been no significant increase in the number between 1950 and 2010.The focus should be on the number of typhoons that approached Japan as a proportion of the total number of typhoons that developed. Figure 6 shows a graph representing the approach rate (the number of typhoons that approached Japan / the total number of typhoons that developed) every ten years.As the approach rate started to decrease from the 1950s and increase from the 1980s, the columns of the graph depict a V-shaped curve. Just as the number of typhoons that approached Japan, the approach rate was the highest in the period between 1951 and 1960 and lowest between 1971 and 1980. The approach rate increased, decreased, and increased again in a cycle. The approach rate has also been lower than the level in the 1950s and 1960s, although it has been increasing since the 1980s.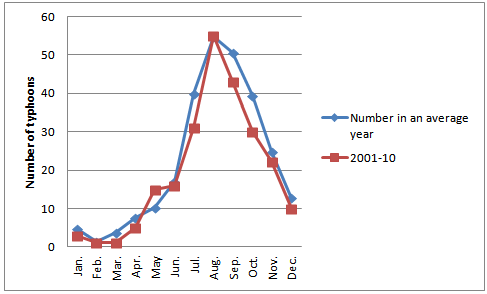 | Figure 4. Numbers of typhoons that developed each month in an average year and over the past ten years |
 | Figure 5. Number of typhoons that approached Japan |
 | Figure 6. Typhoon approach rate (the number of typhoons / the total number of typhoons) |
4.2. Changes in the Number of Typhoons that Hit Japan in Specific Periods
Figure 7 shows changes in the number of typhoons that hit Japan every ten years.Figure 7 resembles Figure 5, representing the number of typhoons that approached Japan. The number of typhoons that hit Japan started to increase from the 1950s, decreased in the 1970s, and has been increasing since the 1980s. There is a difference between the two figures. Whereas the number of typhoons that approached Japan did not significantly change between 1950 and 1970, the number that hit Japan increased between 1961 and 1970.The number of typhoons that hit Japan has been lower than the level in the period between 1951 and 1970, although it has been increasing since 1980.The number between 2001 and 2010 was 2.8 - larger than that in an average year (2.6); a total of ten typhoons hit Japan in 2004, and the number is approximately four times larger than that in an average year. The number in the period 2001 and 2010, excluding 2004, was almost the same as in an average year, and there were two medians between 2001 and 2010. If the number of typhoons that hit Japan in 2004 is excluded, the mean number between 2001 and 2010 is 1.8 - smaller than that in an average year. Therefore, there has been a decrease in the number of typhoons hitting the country since 2000.The number of typhoons that hit Japan as a proportion of the total number of typhoons that developed was also examined. Figure 8 shows graphs representing the landfall rate (the number of typhoons that hit Japan / the total number of typhoons that developed) every ten years, and Figure 9 shows the number of typhoons that hit Japan divided by the number that approached the country.The columns in Figure 8 depict a V-shaped curve that resembles the curve of the approach rate; the landfall rate started to decrease from the 1950s and increase from the 1980s. Just as the approach rate, the landfall rate was the highest between 1951 and 1960, and the lowest between 1971 and 1980. The landfall rate also increased, decreased, and increased again in a cycle.The landfall rate increased in the period between 1951 and 1970, decreased between 1971 and 1990, and increased again from 1991. There was no correlation between the landfall rate and “the number of typhoons that hit Japan divided by the number of typhoons that approached the country”.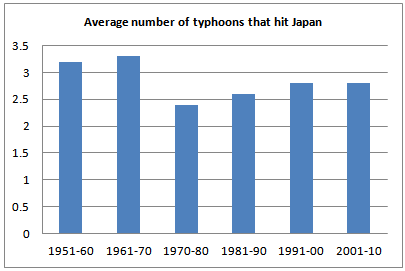 | Figure 7. Average number of typhoons that hit Japan |
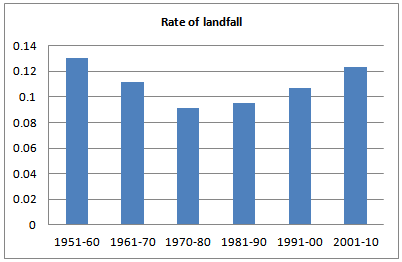 | Figure 8. Rate of landfall (number of typhoons that hit / number of typhoons that developed) |
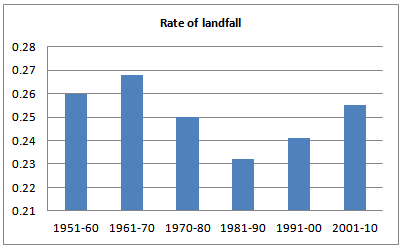 | Figure 9. Rate of landfall (number of typhoons that hit / number of typhoons that approached) |
4.3. Changes in the Monthly Number of Typhoons that Hit Japan
Figure 10 shows the numbers of typhoons that hit Japan each month, and Figure 11 shows the number in an average year and data over the past ten years.Just as the number of typhoons that developed, the number of typhoons that approached Japan was the largest in August, depicting an inverted U-shaped curve, as shown in Figure 10. There were significant differences in the number in May, June, August, September, and November. In the period between 1951 and 1990, the number was by far the largest in August, forming an inverted U-shaped curve. On the other hand, in the periods from 1991 to 2000 and from 2001 to 2010, the numbers in August and September were similar, and the curve has two peaks.As shown in Figure 11, the number in August was not significantly larger than that in September. The mean number of typhoons that approached Japan between 2001 and 2010 was smaller than that in an average year, forming a shallower curve.There results suggest that the typhoon season has become longer. However, there has been an increase in the number of typhoons that approached Japan, whereas the number in August has been decreasing; there has been no significant change in the total number throughout the year.
4.4. Changes in the Monthly Number of Typhoons that Hit Japan
Figure 12 shows the numbers of typhoons that hit Japan each month, and Figure 10 shows the number in an average year and data over the past ten years.Different from the numbers of typhoons that developed and approached Japan, the number of those that hit the country was the largest in August or September depending on the period, as shown in Figure 12. The number was the largest in August In the periods between 1951 and 1960, 1971 and 1980, and 1991 and 2000, the number was the largest in August. In the periods between 1961 and 1970, 1981 and 1990, and 2001 and 2010, the number was the largest in September. The time of the year in which the number is the largest has not become earlier or later, although it has changed in a ten-year cycle.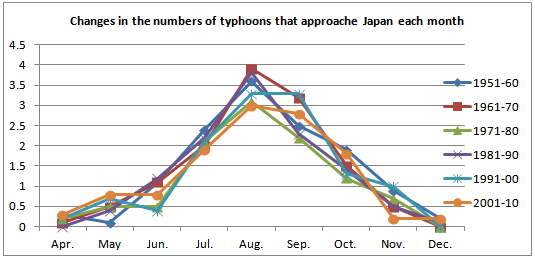 | Figure 10. Changes in the numbers of typhoons that approached Japan each month |
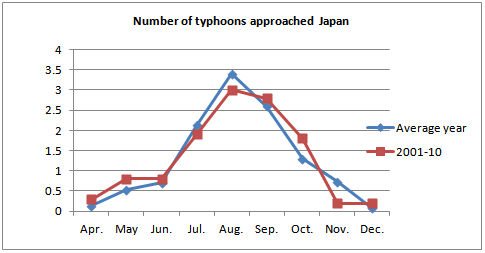 | Figure 11. Numbers of typhoons that approached each month in an average year and over the past ten years |
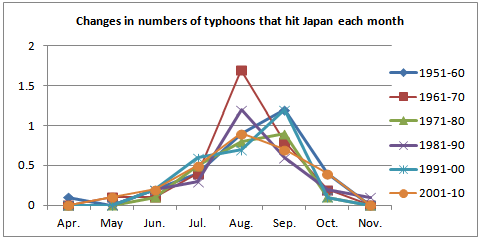 | Figure 12. Changes in the numbers of typhoons that hit Japan each month |
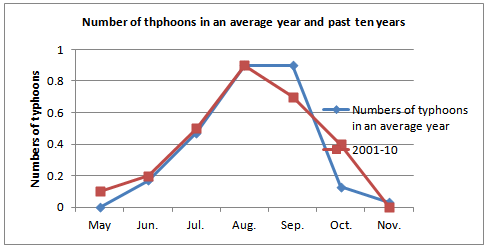 | Figure 13. Numbers of typhoons that hit Japan each month in an average year and mean number over the past ten years |
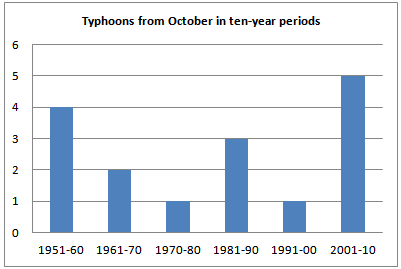 | Figure 14. Numbers of typhoons that hit Japan from October in ten-year periods (total) |
As shown in Figure 13, the curve representing the number of typhoons that hit Japan between 2001 and 2010 is slightly shallower. The number was also large in October. To examine the increase in the number in October, let us look at the numbers of typhoons that hit Japan between October and December in ten-year periods, as shown in Figure 14.As the figure shows, the number of typhoons that hit Japan from October has been large over the past ten years. However, the number was very small (one) in the ten-year period between 1991 and 2000, and there has been no significant change since 1980, when global warming is believed to have started to exert its effects. The results did not suggest that the duration of the period in which typhoons hit Japan had become longer.
5. Intensity of a Typhoon
To categorize the power of a typhoon, the Japan Meteorological Agency classifies the sizes of typhoons based on the diameter of the storm area (in which a strong wind with a velocity of 15 m/s or higher is blowing or would have blown if it were not for topographical influences), and their intensities using the “maximum wind velocity”. The present study focused on the intensity of typhoons.As described in Chapter 2, typhoons are classified into different groups of intensity according to the maximum wind velocity (Tables 1 and 2). Typhoons with a maximum wind velocity of 130 kt or higher are broadly categorized into Class 5 and referred to as super typhoons, and hurricanes categorized into Class 3 or higher are referred to as major hurricanes[18].Based on the relationship between the central pressure and maximum wind velocity, determined using data on previous typhoons, the maximum wind velocity close to the center of a typhoon, when the central pressure is P, can be approximated using the following formula[19]:Maximum wind velocity: As the formula shows, the central pressure of a typhoon is related to the maximum wind velocity.This chapter examines the relationship between the central pressure and maximum wind velocity. An increase in the number of powerful typhoons due to global warming has been reported. The present chapter has examined whether or not there have been increases in the numbers of typhoons with a low atmospheric pressure or high maximum wind velocity.
5.1. Atmospheric Pressure
Mean minimum pressures in ten-year periods were calculated based on the minimum pressures of typhoons since 1951, as shown in Figure 15.The mean minimum pressure started to decrease in the period between 1961 and 1970, was significantly lower between 1981 and 1990, started to increase between 1991 and 2000, and decreased to the lowest in the period between 2001 and 2010, as shown in the figure. Although the mean minimum pressure decreased between 1961 and 1990, it increased between 1991 and 2000. This means that there has been no decrease in recent decades.According to data on typhoons since 1951, there has been no significant decrease in the central pressure. Let us focus on the number of strong typhoons.First, the maximum wind velocity is calculated using the following formula when the minimum pressure is 900 hPa: Therefore, typhoons broadly categorized into Class 4 or higher are defined as strong typhoons.Figure 16 shows the number of typhoons in ten-year periods with a minimum pressure of 900 hPa or lower, as determined based on the formula.The figure reveals that the number of typhoons with a minimum pressure of 900 hPa or lower was the largest between 1961 and 1970, and the number has been decreasing since 1971. There has been a significant decrease in the number since 1991 in particular; there was only one typhoon with a minimum pressure of 900 hPa or lower during the ten-year period between 2001 and 2010.
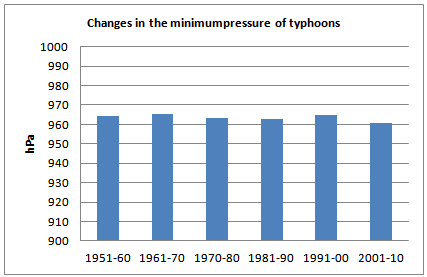 | Figure 15. Changes in the minimum pressure of typhoons |
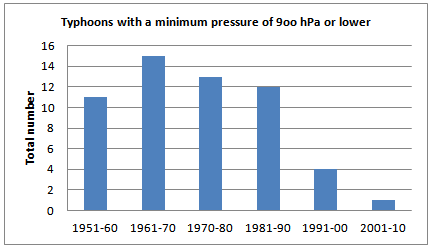 | Figure 16. Number of typhoons with a minimum pressure of 900 hPa or lower |
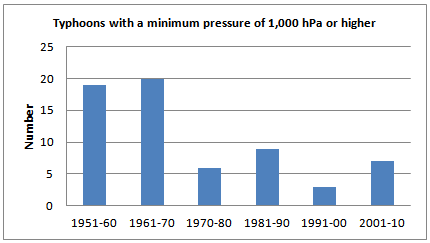 | Figure 17. Number of typhoons with a minimum pressure of 1,000 hPa or higher |
These results question the theory that typhoons have become stronger due to global warming from the viewpoint of the minimum pressure.The approximate maximum wind velocity was calculated as 19 m/s, using the above-mentioned formula. The numbers of typhoons with a minimum atmospheric pressure of 1,000 hPa or higher, categorized into the lowest class, in ten-year periods were determined (Figure 17).The number of typhoons with a minimum atmospheric pressure of 1,000 hPa or higher was large in the period from 1951 to 1960 and from 1961 to 1970, whereas the number significantly decreased around 1971 and has been low since then.
5.2. Wind Velocity
The theory that there has been a decrease in the number of less powerful typhoons and an increase in that of stronger typhoons was examined based on wind velocity measurements.Figure 18 shows the number of typhoons categorized into Class 3, the lowest class. The Japan Meteorological Agency has measured and recorded maximum wind velocities as part of its best track data since 1977. Records from 1981 were used in the study[20].The number of typhoons categorized into Class 3 increased and decreased in a cycle, although differences were not significant because the volume of data was small. The number has not been continuously decreasing or increasing.To examine the characteristics of typhoons with a high wind velocity, the number of super typhoons was determined.A super typhoon is defined as a typhoon with a mean maximum wind velocity (for one minute) of 130 knots (67 m/s) or higher[21].The numbers of super typhoons in ten-year periods were determined based on maximum wind velocity data (Figure 19). The results differed from those shown in Figure 15. The number of super typhoons was large in the period from 1971 to 1980 and from 1981 to 1990, and small in the period from 1991 to 2000 and from 2001 to 2010. On the other hand, in Figure 16, the number was small in the period from 1971 through to 1990 and from 1991 through to 2010. Although the number of super typhoons has been increasing, it did not reach the levels in the period from 1951 to 1960 and from 1961 to 1970, which is consistent with the numbers of typhoons that developed, approached, and hit Japan. The results do not support the theory that the number of strong typhoons has been increasing. However, in recent years, the intensity of typhoons has tended to become higher even when the atmospheric pressure is not very low.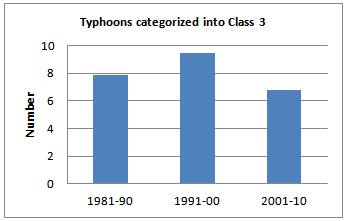 | Figure 18. Number of typhoons categorized into Class 3 |
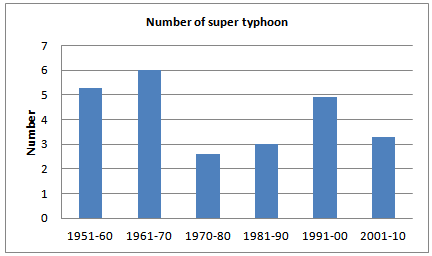 | Figure 19. Number of super typhoons that develop |
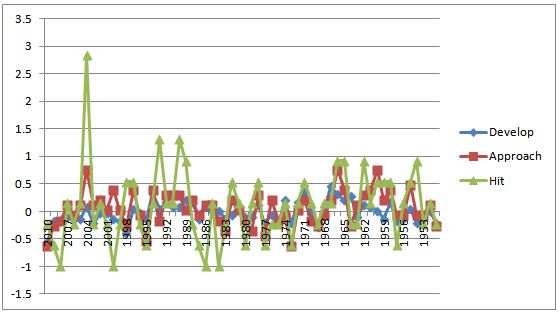 | Figure 20. Standard deviations of the numbers of typhoons that develop, approach, and hit Japan. |
6. A Summary of Data on Typhoons
Measurement data were used to examine the effects of global warming on typhoons.Although there have been changes in the characteristics of typhoons, they are not significant; there has been a decrease in the number of typhoons that developed annually, whereas there has been a decrease in those that approached and hit the country. The numbers are similar to those in the 1950s. However, since 2001, there has been a decrease in the number of typhoons that hit Japan.Data including the numbers of typhoons that developed, approached, and hit Japan suggest changes in the period between the 1950s and 1970s and since the 1980s. The movement of typhoons was stable during the 1970s. This means that their movement has cycled between stable and unstable.Standard deviations were calculated between the numbers of typhoons that developed, approached, and hit Japan during a specific period and an average year, as indicated by graphs in Figure 20.There has been no significant change in the number of typhoons that developed or increase in the standard deviation.Figure 17 shows that the numbers of typhoons that approached and hit Japan did not significantly vary between 1951 and 1970, or their absolute values were large. The numbers were stable between 1971 and 1980, or their absolute values were small, and the numbers have been stable since 1980, or their absolute values have been large. Regarding the number of typhoons that approached Japan, the absolute value of the standard deviation in the period between 1951 and 1970 was larger than that after 1980. On the other hand, the absolute value of the standard deviation for the number of typhoons that hit Japan was larger in the period between 1980 and now, compared to the period between 1951 and 1970.Although the number of typhoons that hit Japan in 2004 was significantly larger, all the years in which the standard deviation was -1 (no typhoon hit Japan) were after 1980. Therefore, the theory that global warming increases the number of typhoons that hit Japan is unfounded.Although there has been a decrease in their monthly development, the number did not vary significantly depending on the month.Although the number of typhoons approaching Japan in August was the largest before 1980, the number has been the largest in August and September in recent years. The number of typhoons approaching Japan increased between July and October as in an average year, and there was no change in the length of the typhoon season.The monthly number of typhoons that hit was the largest in August and September in a ten-year cycle. The curve indicating the monthly number of typhoons that hit Japan during the recent ten years is shallower, and the number for October was larger than an average years. There was no increase in the number of typhoons that hit the country during the period between October and December, suggesting that the typhoon season has not become longer.Data on the monthly numbers of typhoons that developed, approached, and hit also suggest that there has been no significant prolongation of the typhoon season or delay in its start.Changes in the intensity of typhoons that occurred after 1950 were examined based on minimum atmospheric pressures and maximum wind velocities. The results do not support the theory that the intensity of typhoons has become higher due to global warming.Although there was a decrease in the number of typhoons with a low minimum pressure, the number of typhoons with a high maximum wind velocity did not decrease. In recent years, the intensity of typhoons has become higher even when the atmospheric pressure is not very low; there has been a change in the relation between the minimum atmospheric pressure and maximum wind velocity.There was also no increase in the minimum atmospheric pressure.
7. Conclusions
The validity of the theory “typhoon-related abnormal phenomena increase as global warming proceeds” was examined, focusing on the numbers of typhoons that develop and hit Japan and their intensities. Since 1980, there has been a decrease in the number of typhoons that developed during the year, whereas there has been an increase in those that approached and hit Japan. The annual number developing since 1980 is the same as in the period between 1951 and 1960. The numbers of typhoons that approached and hit Japan were the highest during the period from 1951 to 1970, and started to decline in the period between 2001 and 2010. When compared to the data on the numbers of typhoons that developed, approached, and hit Japan during the period from 1951 to 1970, there have been no significant changes since 1980. Data on the monthly numbers of typhoons that developed, approached, and hit also suggest that there has been no significant prolongation of the typhoon season or delay in its start. Regarding the intensity of typhoons, there has been no significant change in the mean minimum pressure of typhoons, a decrease in the number of typhoons with a very low minimum pressure, and no significant increase in the number of typhoons with a very large maximum wind velocity. There has been no change in the intensity of typhoons, and the minimum pressure has not been in inverse proportion to the maximum wind velocity in recent years.The results suggest that typhoons have not been influenced by global warming. In conclusion, global warming has not significantly changed the characteristics of typhoons, and there is no close relationship between the two.
References
| [1] | Japan Meteorological Agency, RSMC Best Track Data, 2000-2009, Accessed 9 May 2013.http://www.jma.go.jp/jma/jma-eng/jma-center/rsmc-hp-pub-eg/besttrack.html |
| [2] | Asahi Shimbun (News Paper), 2008, An ominous lull, no typhoon hit Japan, 27 September. |
| [3] | K. Murayama, “Taihugaku nyumon (Japanese),” Yama to Keikoku-Sha, Tokyo, 2006, p. 9. |
| [4] | Japan Meteorological Agency, RSMC Best Track Data, 1951-2010, Accessed 11 May 2013.http://www.jma.go.jp/jma/jma-eng/jma-center/rsmc-hp-pub-eg/besttrack.html |
| [5] | Typhoon21, Accessed 9 May 2013.http://homepage3.nifty.com/typhoon21/index.html |
| [6] | Japan Meteorological Agency, What is typhoon?, Accessed 11 May 2013.http://www.jma.go.jp/jma/kishou/know/typhoon/1-1.html |
| [7] | Digital typhoon: The Birth and Death of Typhoons (Tropical Cyclones), Accessed 13 May 2013.http://agora.ex.nii.ac.jp/digital-typhoon/help/life.html.en |
| [8] | Joint Typhoon Warning Center, Accessed 13 May 2013. http://jtwccdn.appspot.com/JTWC/frequently-asked-questions-1/frequently-asked-questions#labels |
| [9] | Al Gore, “An Inconvenient Truth,” Bloomsbury Publishing PLC, London, 2006. |
| [10] | M. A. Saunders and A. S. Lea, “Large contribution of sea surface warming to recent increase in Atlantic hurricane activity,” Nature, 451, 2008, pp. 557-560. |
| [11] | Mainichi Daily News, 2010, Strong typhoon heading toward disaster-struck Animal islands, 28 October. |
| [12] | Digital-Typhoon: Definition of a Typhoon (Tropical Cyclone) and its Life, Accessed 9 May 2013.http://agora.ex.nii.ac.jp/digital-typhoon//help.life.html.en, |
| [13] | M. Yoshino, “Chikyuu-ondanka jidai no Ijoukishou (Japanese),” Kishou Books 033, Seizan-Do Shoten, Tokyo, 2010, p. 37. |
| [14] | Digital-Typhoon: Global Warming and Tropical Cyclones (Typhoons, Hurricanes),http://agora.ex.nii.ac.jp/digital-typhoon/helpglobal-warming.html.en (Accessed May 09 2013). |
| [15] | Japan Meteorological Agency, Weather, Climate & Earthquake Information, Accessed 9 May 2013. http://www.data.jma.go.jp/fcd/yoho/typhoon/statistics/landing/landing.html |
| [16] | Change of average temperature on the Earth, Accessed 9 May 2013. http://daily-ondanka.com/basic/data_02.html |
| [17] | K. Murayama, “Taihugaku nyumon (Japanese),” Yama to Keikoku-Sha, Tokyo, 2006, p. 11. |
| [18] | Digital-Typhoon: Typhoons, Hurricanes and Cyclones, Accessed 9 May 2013.http://agora.ex.nii.ac.jp/digital-typhoon/help/world.html.en |
| [19] | K. Murayama, “Taihugaku nyumon (Japanese),” Yama to Keikoku-Sha, Tokyo, 2006, p. 19. |
| [20] | Japan Meteorological Agency, RSMC Best Track Data, 1981-2010, Accessed 11 May 2013.http://www.jma.go.jp/jma/jma-eng/jma-center/rsmc-hp-pub-eg/besttrack.html |
| [21] | Digital-Typhoon: The Intensity and Size of Typhoons –Units of Pressure and Wind, Accessed 9 May 2013. http://agora.ex.nii.ac.jp/digital-typhoon/help/unit.html.en |


 As the formula shows, the central pressure of a typhoon is related to the maximum wind velocity.This chapter examines the relationship between the central pressure and maximum wind velocity. An increase in the number of powerful typhoons due to global warming has been reported. The present chapter has examined whether or not there have been increases in the numbers of typhoons with a low atmospheric pressure or high maximum wind velocity.
 Therefore, typhoons broadly categorized into Class 4 or higher are defined as strong typhoons.Figure 16 shows the number of typhoons in ten-year periods with a minimum pressure of 900 hPa or lower, as determined based on the formula.The figure reveals that the number of typhoons with a minimum pressure of 900 hPa or lower was the largest between 1961 and 1970, and the number has been decreasing since 1971. There has been a significant decrease in the number since 1991 in particular; there was only one typhoon with a minimum pressure of 900 hPa or lower during the ten-year period between 2001 and 2010.


 Abstract
 Reference
 Full-Text PDF
 Full-text HTML