-
Paper Information
- Next Paper
- Paper Submission
-
Journal Information
- About This Journal
- Editorial Board
- Current Issue
- Archive
- Author Guidelines
- Contact Us
Resources and Environment
p-ISSN: 2163-2618 e-ISSN: 2163-2634
2013; 3(1): 1-9
doi:10.5923/j.re.20130301.01
The Effect of Deforestation on Water Quality: A Case Study in Cienda Micro Watershed, Leyte, Philippines
 Abstract
 Reference
 Full-Text PDF
 Full-text HTML
Assefa Dessie 1, Michael Bredemeier 2
1Department Name of Natural Resource Management, University of Gondar, Gondar, P.o.B. 196, Ethiopia
2Forest Ecosystems Research Centre, Georg-August University, Goettingen, D-37077, Germany
Correspondence to: Assefa Dessie , Department Name of Natural Resource Management, University of Gondar, Gondar, P.o.B. 196, Ethiopia.
| Email: |  |
Copyright © 2012 Scientific & Academic Publishing. All Rights Reserved.
Deforestation has an impact on the quality of water flowing through the watershed and alters the discharge, chemical and physical properties of water. This paper presents the effect of deforestation on water quality, in particular on physical and chemical characteristics of water and evaluates the community based watershed management schemes in Buyhang micro watershed. The quality of water is assessed on the basis of laboratory analysis of various parameters by using weekly grab sampling technique from three alternative land uses and in depth assessment of farmers’ needs, priorities, and conservation practices. The farmers’ primary concerns are food security and sustained productivity. Soil erosion is not seen as a problem in the Cienda community and currently still seems to reflect stable conditions. The perception and appreciation of people towards the function of forest ecosystems is limited. People are continuously changing the forest area for abaca plantations, rice fields, and other agricultural crops in very steep slopes. There is only 0.97 ha of reforestation activity in the watershed. Most people judge the quality of water by its aesthetic properties of colour, taste, odour and turbidity. Except the agricultural water samples, the other two samples appeared colourless through visual observations. The water from undisturbed forest area is palatable and all are free of odour. The pH values of the water samples ranged within standard values. Total hardness was trace except one sample from agricultural land. Turbidity was found to be less and ranging from 5 to 22 FTU. Sediment is recorded from agricultural water samples and higher during peak flow. The highest concentrations of PO4- were measured from the forest water samples. The mean Ca++ concentrations ranged from 10 to 11.6 mg/L. There is no significant difference between the three water samples in Mg++ concentration. Total K+ was also found below 6.6 mg/L. Na concentrations were ranging from 6.5 to 8.7 mg/L. Generally, the results from this study show no significant difference between waters from forest and deforested area in terms of chemical analysis but clear contrast in physical properties. The nutrient concentration of water from the forested site is relatively higher and untypical in the case of nitrate concentrations than deforested and agricultural water samples.
Keywords: Watershed Management, Water Quality, Deforestation, Erosion, Land Use
Cite this paper: Assefa Dessie , Michael Bredemeier , The Effect of Deforestation on Water Quality: A Case Study in Cienda Micro Watershed, Leyte, Philippines, Resources and Environment, Vol. 3 No. 1, 2013, pp. 1-9. doi: 10.5923/j.re.20130301.01.
Article Outline
1. Introduction
- Forests and water are highly important resources which provide many socioeconomic functions and services to human societies and the environment. However, the occurrence of disturbance on forests modifies and alters the discharge, chemical quality and physical properties of water[1]. Due to its nature as a solvent, all water contains organic and inorganic matter and dissolved gases derived from its environment or the activity of living organisms. According to[2], the concentrations of substances and their biological, physical and chemical effects are the basic criteria in the determination of water quality. Forest in upstream watersheds is the best land cover to maximize water quality and support constant yield for agricultural and domestic uses, preventing floods in downstream areas, regulate seasonal flows and ensure high water quality. Some common assumptions on the other hand have revealed that forests are not the best land cover to increase downstream water yield in arid and semi arid ecosystems ([3],[4]). The reason is that forest ecosystems are a major user of water. Tree canopies reduce ground water and stream flow, through interception of precipitation and evapotranspiration from foliage as in ([5-9]). Studies in the UK have found that between 25 and 45% of annual rainfall is typically lost by interception from conifer stands, and 10 – 25% for broadleaves stands under a wide range of rainfall[10]. Other study[11] found that higher annual transpiration losses (360–390 mm) from trees in broadleaves stand in southern England. On the contrary, losses of forest have been blamed for problems of land slide, flooding hazards for down streams and intermittent water discharge. Therefore, partial removal of forest increases downstream water yields[12-13]. Reference[4] shows forested watersheds generaly offer high quality of water and examples of stable hydrological system than watersheds under alternative land uses because agriculture, industry and settlement are likely to increase the amounts of pollutants entering headwaters in addition to regulating erosion and reducing sediment load ([14],[6]). The quality of water depends mainly on its source of origin and its subsequent exposition to pollution sources. For example, a study in Finland about water chemistry in undisturbed forest catchments[15] shows that nitrate concentrations and leaching were 430 μg L−1 and 140 kg km−2, respectively where as phosphorus concentration and annual leaching were 15 μg L−1 and 5.4 kg km−2, respectively. Other investigations in southern Chile[7] showed that the canopy was a net source for nitrate and base cations. It was estimated that the montane forests received 2.4 kg ha-1 year-1 of inorganic- N via occult deposition, and base cations (10.7 kg ha-1 year-1 for Na+, 8.8 kg ha-1 year-1 for K+, 7.0 kg ha-1 year-1 for Ca2+ and 1.9 kg ha-1 year-1 for Mg2+). On the other hand, felling of trees have resulted an increase in NO3- and K+ concentrations as in[16]. During implementation of watershed management activities, one should consider integration of indigenous knowledge and conservation practices, the decision making power of farmers in selecting technologies, planning and scheduling operations, budgeting, financial advantage and management rights. Assuring responsibilities to the local level can give communities the rights and incentive to manage and use forest resources sustainably. Hence the primary objective of this study was to determine the effect of deforestation on water quality, in particular on physical and chemical characteristics of water. A further investigation was to evaluate the community based watershed management schemes in Buyhang micro watershed.
2. Materials and Methods
2.1. The Study Area
- The Buyhang watershed is located at 124048'39" longitude and 10043'15" latitude and encompasses a portion of the Barangay Gabas and Barangay Kilim farmer associations in Leyte state, Philippines. The elevation of the watershed ranges from 5 to 1060 meters above sea level (m.a.s.l.). In these areas a community-based forest management (CBFM) project is working with the Cienda-San Vicente Farmers Association (CSVFA) as participatory watershed management systems in three land use classifications such as protected zone, buffer zone and multiple use zone (Figure 1). The former one is protected against human interventions while in the buffer zone regulated use is permitted. The watershed (study area) is 968 ha in size with a slope ranging from 30 to 80 percent in the upper catchment. The climate is classified as humid mesothermal with temperatures averaging from 20.9℃ to 34.3℃ since 1978. Rainfall is distributed fairly evenly throughout the year, with June to February as slightly wetter months and March to April relatively dry. The highest rainfall record is 757.5 mm per month and 4014.6 mm per year since 1976. Ridges are sharp-crested and the valleys are V-shaped for up drainages to broad U-shaped in the lower parts of the watershed. The upper part of the watershed is uneven, mountainous and undulating but covered by vegetation. Because of the humid climate, vegetation at the upper part of the watershed is diverse with multi-stories in the undisturbed forest. Trees, shrubs, herbaceous, palmae, lianas, grasses and ferns are the most common plant categories grown in the watershed area. According to[17] metamorphic, volcanic and highly crystallized rocks are the dominant geological formations in the study area.
2.2. Sampling Procedure and Data Analysis
- The collection of base line information was restricted to technical field surveys coupled with laboratory analysis and secondary data. The study includes land use analysis and map preparations of the watershed by using GPS with in depth assessment of farmers’ needs, perceptions and priorities, and evaluation of traditional resource use and conservation practices.The first essential step in assessing the water quality was collecting a representative sample that highlights the exact condition of existing water systems. Observation and analysis were conducted at the site and in the laboratory in order to provide an adequate basis for designing the watershed management systems, to assess the degree of watershed management, monitor and control activities and management facilities in the study area. Hence, experimental sites for water quality were consisting of three land-use systems. The sampling sites were located in (i) an undisturbed forest area, (ii) a deforested site and (iii) an agricultural field. These sample points were selected based on the assumptions that the samples taken are representative of water sources for each land use system. Weekly grab sampling technique was applied for collecting water samples within a particular time and place. It represents the condition of water or streams at the time of sampling. This method was also preferred because it is flexible, as it allows taking samples under base flow conditions and also when there is unusual discharge or peak flow in a particular time[2]. Most of the chemical analyses were carried out in the laboratory for major dissolved ion content such as total Ca2+, Mg2+, Na+, K+ and P. Total Hardness, Nitrate-N and turbidity were also water quality variables analyzed in the laboratory. The pH, or the "potential of hydrogen", is a measure of the activity of hydrogen ions in the water and was measured to indicate the acidity or alkalinity of the water. Techniques of descriptive statistical analysis were applied for the resulting small dataset by using STATISTICA 7 software package to interpret the results.More than thirty years of rainfall data from the nearest metrological station was collected. The amount of discharge of water and runoff was not measured because of time limitations, but assessed from other studies in the same study area.
3. Results and Discussion
3.1. Water Analysis
- Water quality standards and parameters may vary among countries. For this reason, there is no universal standard convention for water quality. Some countries such as USA and Canada established their own standards and parameters. World health organizations (WHO) and Food and agriculture organization (FAO) tried to establish water quality guidelines based on few country studies but not complete. The water quality is highly depending on the soil type and its nutrient elements, the source of water and type of contaminations. As a result, people adapt their own local water behaviour and response differently to water quality parameters. Hence, a country should set up and develop its own water quality guidelines. The following physical and chemical parameters were studied in Buyhang watershed to determine the impact of deforestation on the quality of water.
3.1.1. Physical Properties
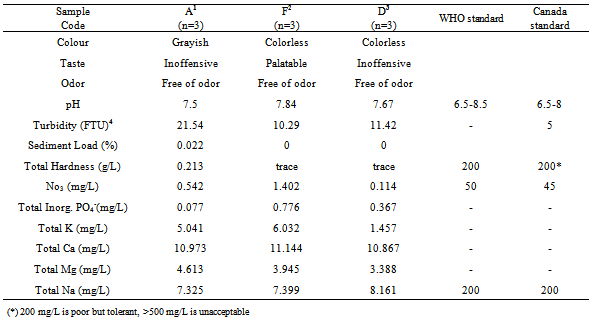
- The physical characteristics of water are the oldest and fastest method used by people to check the water quality. Most people judge the quality of water by its aesthetic properties of colour, taste, odour and turbidity. However, it depends on the simulation of human receptor cell. The grayish colour in agricultural field shows coloured inorganic and organic dissolved compounds in the water. Ideally, it should appear colourless if there are no foreign substances in the water. The sense of taste is useful in detecting dissolved constituents of water in a state of free of odour. It is a particular sense mediated by the taste buds on tongue that perceives the sweet, bitter, sour or salty quality of dissolved substances. Compared to the abundance of turbidity and sediment yield, there is no big difference/ much information between the water samples of the three land uses. However, the water from undisturbed forest area is palatable. This may be due to some dissolved mineral elements in the water like iron. According to Canadian water drinking guidelines[18], a numerical limit for taste has not bean established because there is considerable variation among consumers and countries as to which tastes are acceptable. However, this guidline mention a taste study conducted in California develop a relationship between the perceived taste quality of a water supply and its total dissolved solid (TDS) content as follows: excellent, less than 300 mg/L; good, 301–600 mg/L; fair, 601–900 mg/L; poor, 901–1200 mg/L; and unacceptable, greater than 1200 mg/L.Odour in water is a sensation due to the presence of substances that stimulates human sensory organs in the nasal cavities. It is useful in detecting organic constituents. Hence the odours of all water samples were unobjectionable. The maximum acceptable limit of odour for water has not been specified because it cannot be measured objectively. Usually, it is reported as inoffensive if there is no detectable odour in the water.
|
3.1.2. Chemical Properties
- The major watershed components are hydrology, soil types, geology and vegetation. They affect biological activities in the ecosystem, chemical weathering processes and exchange of elements from soils that contribute to the chemical compositions of water. Especially deforestation and land use activities can evidently affect water chemistry in the watershed. The following relevant water quality parameters are analyzed in the laboratory.The pH is measured immediately after arrival at the laboratory with a digital pH meter. Hence, all pH values of the water samples were ranged within standard values (Table 1) and indicated slightly alkaline condition. There is no significant difference of pH between the three water quality samples. The acceptable range of most raw water sources lies within the range of 6.5 to 8.5[19]. Hardness is a measure of the presence of significant concentration of salts of metallic cations mainly Ca+2 and Mg+2 ions dissolved in water. Average hardness levels computed from each water samples shows that total hardness was trace except one sample from agricultural land. It was taking after peak flow and this may be because of some dissolved Ca+2 and Mg+2 ions seepage and runoff from the soil. A survey of Baybay water district around the watershed in 2006 and 2007 showed that waters from this watershed had total hardness ranging from 23.15 to 55.56 ppm5 and 48 to 64 mg/L respectively. The waters of this watershed can be considered as soft at the present condition and the Cienda community draws water directly from the forested area enjoyed with nearly ideal water in terms of low content of hardness. According to guidelines for Canadian drinking water quality , the degree of hardness of water is classified in terms of its calcium carbonate concentration as: soft, 0 to <60 mg/L; medium hard, 60 to <120 mg/L; hard, 120 to <180 mg/L; and very hard, 180 mg/L and above. In this survey, nitrate levels in the water samples were below the required standard in all sites. The highest level was recorded in forested area water samples on average which seems to be unrealistic compared to other studies. Usually, nitrate concentration was recorded minimal in the forest ecosystem than other alternative land uses. Probably, this forest ecosystem is efficient enough in trapping nutrients in the case of nitrogen and base cations. This may be due to the oxidation of nitrogen by microorganisms, decaying of plant and animal materials and geological formations containing soluble nitrogen compounds in the forest ecosystem. Plants use nitrates as an essential nutrient. They are soluble and mobile in soil. If the concentration in the soil is excess of plant uptake, they migrate readily to the water table and increase nitrate concentrations of the water. Nitrate concentrations in agricultural field water samples are 50% higher than deforested area. The main sources of nitrate here may be agricultural fertilizers, manure and domestic sewage. The differences in nitrate levels between each water samples were significant. The range of nitrate levels from laboratory analysis conducted as in[17] and Baybay water district in 2006 in the same watershed but different sampling point were 0.82 mg/L to 1.67 mg/L and 1.6 mg/L to 2.6 mg/L respectively. The maximum acceptable concentration for nitrate in drinking water is 45 mg/L according to canadian drinking water guidelines[18]. Turbidity is measured in nephelometric turbidity units (NTU) or formazin turbidity unit (FTU), by a device called a turbid meter using the intensity of scattered light. At most of sampling points, turbidity was found to be less and ranging from 5.35 to 21.97 FTU. During the study period, turbidity of agricultural water samples had more than double values of the undisturbed forest water samples. Similarly, turbidity of water from undisturbed forest was much lower than that of water from the deforested area (Table 1). This situation could be explained by the lower rate of soil erosion and leaching of dissolved solid particles in the forest. Levels vary at individual locations over time. WHO established the maximum allowed turbidity in drinking water that it shouldn’t be more than 5 NTU. Of course there is no harmful health effect associated with this parameter however; it can influence the wellbeing and acceptability of drinking water to consumers. The sediment yield from water samples without peak flow is insignificant. Only small percentage of sediment is recorded from agricultural water samples (Table 1). This is directly connected to agricultural activities, leaching of suspended particulate matters and erosion.The high concentrations of phosphorus (PO4-) were measured from the forest water samples which are more than 1000% higher than PO4- concentrations from waters in the agriculture site in Buyhang watershed (Table 1). The chronological order of PO4- concentration was F>D>A. The reason for the high concentration in the forest may be high soil P content from parent materials released as phosphate ions which are soluble in water, direct input by wild animals such as birds and high organic matter accumulations from decaying of plants and animal remains. This ranking indicates sites where the risk of P movement through leaching may be relatively higher than that of other sites. In other studies in the watershed[17] were reported that total phosphorus concentrations from protected forest water samples were slightly higher than other sites. There is no report for concentration of P on direct toxicity of human beings unless present in very high level.Measurements of water samples collected from the three land uses area showed that the mean calcium concentrations were almost similar and ranged from 10 to 11.6 mg/L. Calcium is the fifth most abundant natural element and one of the principal cations associated with hardness enters the fresh water through the weathering of rocks, soil seepage, leaching and runoff. According to Canadian drinking water quality guideline[18], CaCO3 concentration ranged below 75 mg/L considered as soft water and above this as hard water. Magnesium is the eighth most abundant natural element and a major contributor to water hardness. The highest concentration was found from agricultural field water samples about 5.17 mg/L. However, there is no significant difference between the three water samples in magnesium concentration. The main source of magnesium in water may be the weathering of magnesium containing rocks. In surveys of surface water quality in Canada[18], the highest concentrations of magnesium were 28 mg/L where as concentrations in most other locations were below 5 mg/L.Total potassium (K) was also found within the desirable limit of below 6.6 mg/L. It was observed that K concentrations at deforested area were quite low (1.5 mg/L) compared to other land use water samples which are above 5 mg/L. This may be due to loss of K nutrient through leaching and erosion. In this area, there is no K input except weathering from parent material. The highest K concentration is recorded from the undisturbed forest area. Probably, plants uptake this element form deep soil and return back to the soil through litter fall. Therefore, soils under this area are relatively rich in nutrients than deforested area which are exposed to erosion. K is soluble in water and increases its cation concentrations in the water. This situation holds true when the forest development is young until the forest soil changes to acidic situation from basic characters through leaching.There is no significant difference between the three sites of water samples in sodium concentration. Similar studies in the watershed[17] and Baybay water district report in 2007 showed that sodium concentrations were found below 3 mg/L. A maximum acceptable concentration for sodium in drinking water has not been established however, in the guidelines for Canadian drinking water quality[18], the aesthetic objective for sodium in drinking water is ≤200 mg/L and above this the test is considered as offensive.
3.2. Land Use Analysis
- The top of the watershed area is protected from human intrusion. The area seems to be well covered by rainforest except some landslides from the very steep slopes (> 80%). However, there are numerous forest degradations in the middle part of the watershed especially in multiple use and buffer zones of the forest. The main derives behind this degradation is the agricultural interventions such as abaca plantation, small and fragmented agricultural practices in addition to selective logging and charcoal productions which significantly affect the forest structure and the quality of the forest. This forest degradation is more associated with shortage of agricultural lands in lower irrigated area because of high population growth. On the other hand, agricultural investors convert the future uses of forest land to maximize their annual economic benefit from the area. The problem is not only competing the forest land but also there is no appropriate conservation measures associated with cash crop production. Some evidences inside the forest showed that the increasing local populations pushed to convert forests to farmlands such as highland rice fields and farmers travel up two hours walk inside the forest to get their piece of farm land.The respected officials for the area were not aware of the serious trend destruction and land use change. The rehabilitation schemes and the degradation and/or the deforestation rates are not comparable. CBFM project in collaboration with the local community planted only 0.97 ha of reforestation activity in the watershed and about a half hectare in the neighboring village. The authors of this paper observed that the main river has a chance of over flooding over rice fields and villages when there is heavy rainfall. The evidence is that the river changed its flowing direction towards the weak and fragile soil embankments (Figure 1). The current land use condition with respected area coverage is described in the following figure.
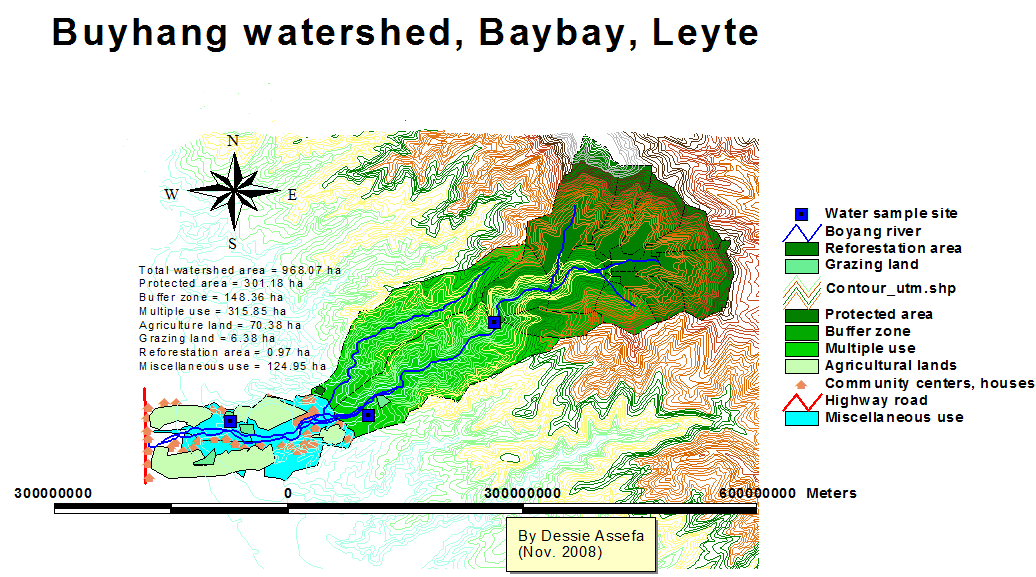 | Figure 1. Topographic map of Buyhang watershed |
|
3.3. Soil and Water Conservation
- The CBFM project members are responsible to protect the soil and water resources as well as keep the vegetation from illegal loggers. Farmers’ participation is vital in contributing to success in soil conservation and watershed management interventions. However, the local communities are largely dependent on outsiders’ decisions, which led to low adoption rate and poor maintenance. Farmers’ perception and participation in watershed management such as selecting suitable technology, scheduling management activities, sharing of economic benefits is inadequate. For effective and sustainable watershed management, the involvement and active participation of local people on all stages such as planning, deciding on activities, monitoring and reporting all conditions of the watershed, carrying out maintenance are very essential. Most communities rely and respect local leaders elected to lead their common interest and it is an advantageous to address and communicating the group members, ensures sustainable and participatory watershed management.
|

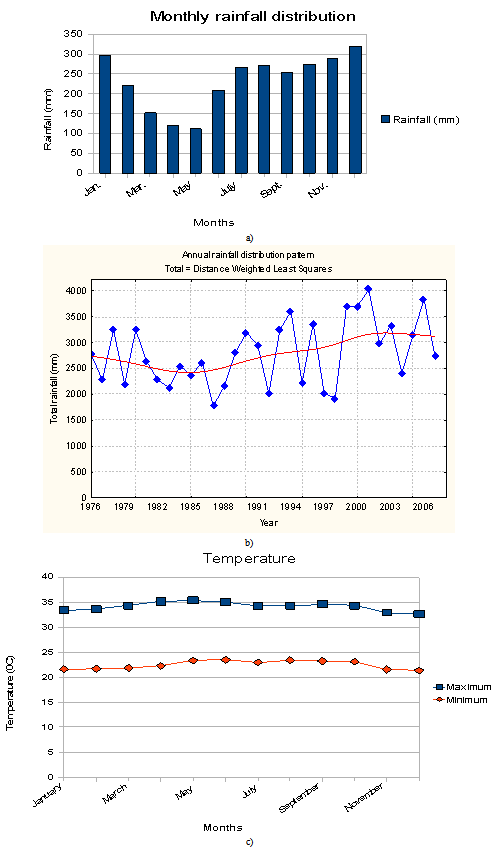 | Figure  Rainfall distribution pattern of the watershed: a) annual distribution and trend b) monthly distribution; and c) annual temperature Rainfall distribution pattern of the watershed: a) annual distribution and trend b) monthly distribution; and c) annual temperature |
4. Conclusions
- The quality of water has to be assessed from the source before providing to the community for various uses. Since water is a natural solvent for many organic and inorganic constituents, it cannot be absolutely free from dissolved elements which affect the quality to some extent. Deforestation and human activities contributed much to reduce water quality in the catchment. This can be described by analyzing disease causing organisms, taste, odor, color, turbidity, excessive minerals, gases and the pH value. The local water district is responsible for the quality assurance and should consider raising awareness, active participation and involvement of local communities to maintain the forests in the watershed which regulate the water source and quality. Preventive measures are easier, cheap and advantageous than treatments of unclean water.This analysis confirmed that forests regulate soil erosion, reduce sediment load, turbidity, the need for treatment and costs to supply clean water to the local community. Therefore, forests should be managed for a wide range of their benefits in the watershed such as wood and non wood products, medicines, ecotourism, climate, and soil and water conservation apart from forest hydrology. Of course, people can benefit sustainable utilization and better quality of water by protecting the forest from being deforested. Even though many studies show that forests have an impact on water quality in the watershed, the results from this study shows no significant difference between waters from forest and deforested area in terms of chemical analysis but clear contrast in physical properties. The nutrient concentration of water from the forested site is relatively higher and untypical in the case of nitrate concentrations than deforested and agricultural water samples. This approved that forests have a capacity to trap nutrients from the atmosphere and the soil in case of nitrogen, phosphorous and base cations. Developing and promoting an alternative approach for income generations other than agricultural system may keep people from migrating to the forest. In a watershed management, integrating the indigenous knowledge and enhancing farmers’ role in planning, design, implementation, monitoring and maintenance of watershed activities should be adopted by the government agencies and NGO’s working in the study area. Erosion control structures such as contour bunds, check dams and embankment stabilizations should be first erected in newly expanded agricultural areas and gullies. Family planning to keep population growth together with forest extension system may also help for the success of forest rehabilitation activities.
ACKNOWLEDGEMENTS
- We thank Prof. Dr. Justino M. Quimio, Dr. Arturo Passa, and the laboratory staff members of Leyte State University, and Renato Pernitez Poliquit (P.dong) for their support during data collection in Leyte, Philippines.
Notes
- 1. A = Agriculture site2. F = Forest site (undisturbed)3. D = Deforested site4. Formazin Turbidity Unit5. Parts per million6. Data source from Arturo (2006)7. Thirty three years data is obtained from Leyte state university, Philippines.