-
Paper Information
- Previous Paper
- Paper Submission
-
Journal Information
- About This Journal
- Editorial Board
- Current Issue
- Archive
- Author Guidelines
- Contact Us
Resources and Environment
p-ISSN: 2163-2618 e-ISSN: 2163-2634
2012; 2(6): 306-316
doi: 10.5923/j.re.20120206.09
On the Doubtful Validity of Bio-ethanol as an Environmental Measures: Can CO2 be reduced by this Method?
 Abstract
 Reference
 Full-Text PDF
 Full-Text HTML
Masakazu Yamashita , Hiroyuki Aimoto
Department of Environmental Systems Science, Doshisha University, Kyo-tanabe, Kyoto, 610-0394, Japan
Correspondence to: Masakazu Yamashita , Department of Environmental Systems Science, Doshisha University, Kyo-tanabe, Kyoto, 610-0394, Japan.
| Email: |  |
Copyright © 2012 Scientific & Academic Publishing. All Rights Reserved.
The purpose of this study was to conduct a quantitative assessment of the CO2-reducing effects of bio-ethanol in its lifecycle, including CO2 emissions generated in the process of ethanol production, and examine its efficacy as an environmental measure. In the study, the significance of the Biomass Nippon Strategy, which has been implemented by the Japanese government, as well as the feasibility and economic efficiency of its plan were also discussed. Although the government has set the revitalization of agriculture, forestry, and fisheries, including farming, mountain, and fishing villages as a goal for the Biomass Nippon Strategy, the results of the study, judging from the amount of the subsidy, suggest that the domestic production of ethanol using fallow fields only increases the financial burden on Japanese taxpayers rather than revitalizing the agriculture industry. The results indicate that an emphasis should be placed on the expansion of food production to revitalize the agricultural sector, instead of providing financial support for an ineffective reduction project. If burning by-products from the production of ethanol generates energy, it will increase the rate of CO2 reduction. However, the domestic production of ethanol and its use proposed in the government's plan are expected to have only limited CO2-reducing effects.
Keywords: Bio-Fuel, Bio-Ethanol, CO2 Reduction, Revitalization of Agriculture, Subsidies
Cite this paper: Masakazu Yamashita , Hiroyuki Aimoto , "On the Doubtful Validity of Bio-ethanol as an Environmental Measures: Can CO2 be reduced by this Method?", Resources and Environment, Vol. 2 No. 6, 2012, pp. 306-316. doi: 10.5923/j.re.20120206.09.
Article Outline
1. Introduction
- The principle of carbon neutrality is based on the idea that “the combustion of biomass, a plant resource, does not increase the amount of CO2 in the atmosphere”. The reason, according to the principle, is that although CO2 is emitted by burning bio-ethanol, as in the case of fossil fuels, these greenhouse gas (GHG) emissions are assumed to be recaptured by newly growing plants, the raw material of bio-ethanol. The principle has been evaluated as an effective environmental measure since its adoption in the “Kyoto Protocol Target Achievement Plan”. In response to the current trend, Japan has been producing and using bio-ethanol based on its policy: “The Biomass Nippon Strategy”[1].However, the principle of carbon neutrality was defined only focusing on parts of the entire system, i.e., the growth stage of plants as materials and the process of fuel consumption. In reality, a large amount of CO2 is emitted from a massive amount of fossil fuels consumed in the process of ethanol production. To define bio-ethanol as an ecological fuel, it is necessary to assess the CO2-reducing effect in the entire lifecycle while taking into account these CO2 emissions.Previously, we reported the assessment of the effect of reducing oil use[2]. The present study examined the efficacy of bio-ethanol as an environmental measure for CO2 reduction in the entire lifecycle, including the process of growing plants and bio-ethanol production. The study also discussed the significance of “The Biomass Nippon Strategy”, a strategy that has been promoted by Japan, as well as the feasibility and economic efficiency of the plans.
2. Research Methods
- The following methods and formulas were used for the assessment, as adopted from previous study[2].In the assessment of the CO2-reducing effects of bio-ethanol as an alternative to gasoline while taking into account its entire lifecycle, the actual CO2 reduction rate “α” is calculated using the following formula:
 | (1) |
 | (2) |
 | (3) |
 | (4) |
3. Status and Assessment of Domestic Bio-ethanol
3.1. The Scale of Plants and Feasibility of Securing Raw Materials
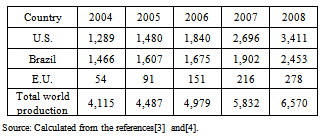
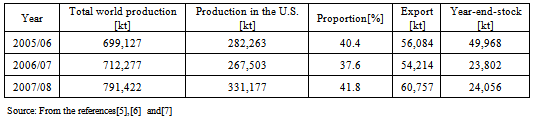
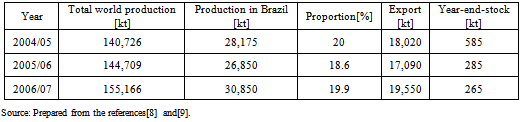
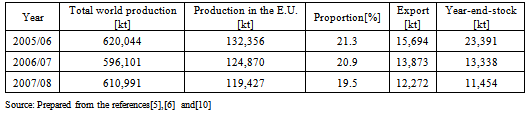
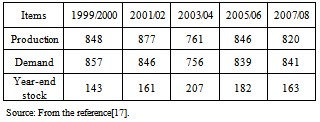
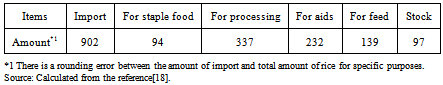
- In the U.S., Brazil, and the E.U. (27 countries), bio-ethanol production was steadily increasing as of 2008 (Table 1). The U.S., Brazil, and the E.U. use corn, sugar cane, and wheat as the primary ingredient, respectively, to produce ethanol. They are the world’s largest producers of each crop, and have a large amount of stock that exceeds domestic consumption (Tables 2, 3, 4). In fact, the E.U. started to use surplus wheat to produce ethanol as a measure to stabilize its price.
|
|
|
|
|
|
|
|
|
3.2. Production Costs and Economic Efficiency of Imported Ethanol
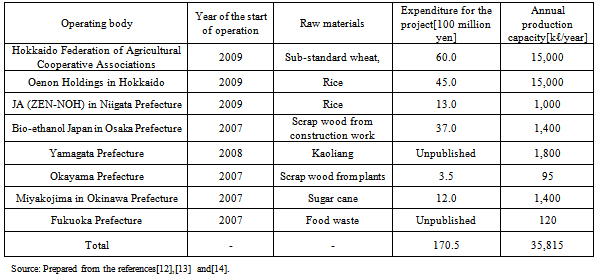
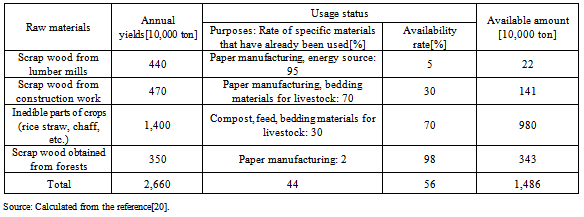
- The government plans to substantially increase the domestic production of bio-ethanol that can compete with other fuel products in Japan and other countries in terms of the price and quality until 2030. Figure 1 shows the price structures of gasoline and bio-ethanol imported from Brazil, and the estimated production cost of domestic bio-ethanol.As of the end of November 2009, the wholesale price of gasoline was 67.2 yen/ℓ, and the price of ethanol imported from Brazil was 76.4 yen/ℓ. The cost of producing bio-ethanol using American corn was 32 to 38 yen/ℓ, and 60 to 85 yen/ℓ when wheat from the E.U. was used as the raw material. Regarding ethanol from Brazilian sugar cane, its lowest production cost was reported to be 17 yen/ℓ[21], because energy generated by combusting bagasse, a byproduct of ethanol production, was used to substantially reduce energy costs. On the other hand, the production costs (including raw material costs) of domestic bio-ethanol from molasses, sub-standard wheat, and edible wheat were 90.4, 98.0, and 415 yen/ℓ, respectively. In particular, the cost of edible wheat (369 yen/ℓ) was seven times higher than that of sub-standard wheat (52 yen/ℓ). Common agricultural crops have an economic disadvantage as raw materials because their costs are very high. The production cost of domestic bio-ethanol is significantly higher than that of other fuels and foreign bio-ethanol, and it was calculated on the assumption that the project would be partially supported by the government.Figure 2 shows the estimated production costs of domestic cellulosic bio-ethanol according to the scale of the plant, calculated by NEDO. As the scale of a plant becomes larger, and with subsequent reductions in equipment depreciation and personnel expenses, production costs are expected to decrease. However, even the largest bio-ethanol plant in Japan using cellulosic resources as raw materials produces only 1,400 kℓ of bio-ethanol annually (Table 5).According to the results of an interview survey involving Bio-ethanol Japan in Kansai, the cost of producing bio-ethanol in the company was higher than 100 yen/ℓ. As a reference, the target cost of producing cellulosic bio-ethanol set by related ministries and agencies, including the Ministries of “Agriculture, Forestry and Fisheries”, “the Environment”, and “Economy, Trade, and Industry”, is 100 yen/ℓ[11].As the production cost of domestic bio-ethanol is 57.3 yen/ℓ, when produced at a plant with a production capacity of 20,000 kℓ/year, it can compete with the current (as of the end of November 2009) prices of gasoline (67.2 yen/ℓ) and imported ethanol (76.4 yen/ℓ) (Figure 1). Therefore, if domestic bio-ethanol can be actually produced at this estimated cost, its large-scale production should not be difficult. However, the amount of raw materials required for its production is calculated at 68.97 million tons/year (≈ 20,000[kℓ/year]/0.290[ℓ/t]), which is more than four times the estimated amount of cellulosic biomass materials currently available (14.86 million tons/year) (Table 9). It is difficult to secure a sufficient amount of cellulosic raw materials, which is expected to be an obstacle in expanding the scale of plants and reducing their production costs in the future.Japan plans to import bio-ethanol from Brazil until the stable supply of domestic bio-ethanol is secured. As there is a shortage of around 750,000 kℓ of ethanol supply to accomplish the Kyoto Protocol target, if the shortfall is imported from Brazil, 57.3 billion yen (≈ 76.4 yen/ℓ × 750,000 kℓ) will be required, based on the current cost (CIF: cost, insurance, and freight) of importing ethanol from Brazil (Figure 1).When 450,000 kℓ (≈ 750,000 kℓ × 0.603 (5,067[kcal/ℓ] / 8,399[kcal/ℓ]) of gasoline is replaced by 750,000 kℓ of bio-ethanol[2], 30.2 billion yen (≈ 67.2 yen/ℓ × 450,000 kℓ) is required for importing it, if the distribution cost (cost of shipping from refinery) is 67.2 yen/ℓ (Figure 1). A loss of 27.1 billion yen is estimated to be caused by importing ethanol as an alternative to gasoline.The current CO2 reduction rate of bio-ethanol imported from Brazil is approximately 1.39[kg-CO2/ℓ][2]. Therefore, the CO2 reduction rate of 750,000 kℓ of imported ethanol, calculated using a quantitative assessment method, is around 1.04 million[t-CO2] (≈ 1.39[kg-CO2/ℓ] × 750,000 kℓ). The CO2 reduction rate of ethanol imported from Brazil is 0.0982%, when it is calculated based on the total amount of domestic CO2 emissions in 1990, which is stipulated as the base year in the Kyoto Protocol: 1.0591 billion[t-CO2]. The rate is 0.0854% when the calculation is based on the total amount of domestic CO2 emissions in 1990: 1.218 billion[t-CO2][23], and 0.415% if the estimation is based on transportation-related CO2 emissions in Japan in 2008: 250.90 million[t-CO2]. At any rate, the CO2-reducing effects of imported ethanol are very low. It is necessary to reconsider the appropriateness of its promotion because it may cause a substantial trade deficit.
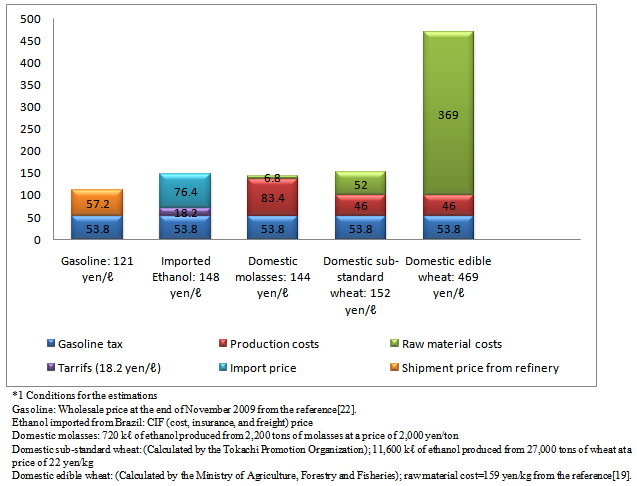 | Figure 1. Price structures of gasoline and bio-ethanol[yen/ℓ]*1 |
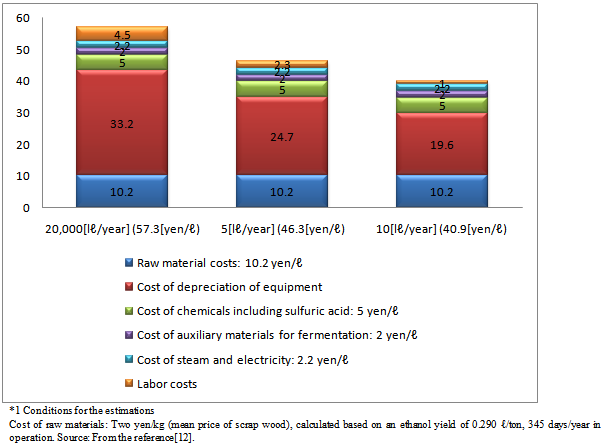 | Figure 2. Production costs[yen/ℓ] of domestic cellulosic ethanol according to the scale of plants*1 |
|
|
3.3. Amount of Subsidies in a Demonstration Project in Niigata Prefecture
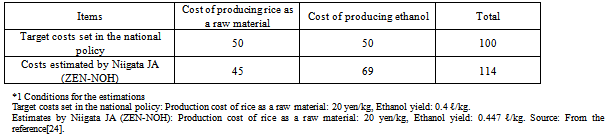
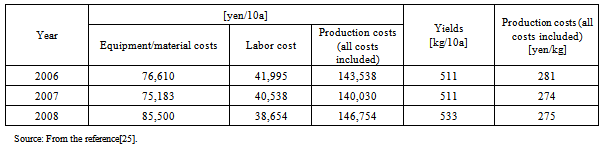
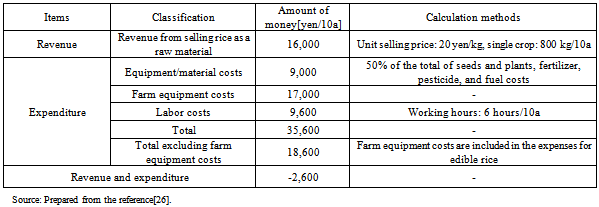
- In 2007, the National Federation of Agricultural Cooperative Associations (ZEN-NOH/JA) in Niigata Prefecture started a demonstration project in which they produce bio-ethanol from high-yielding rice grown on idle agricultural land, and distribute E3 fuel. Table 10 shows the estimated costs of producing bio-ethanol from domestic rice; the target cost set in the government policy is 100 yen/ℓ, whereas the cost was estimated to be 114 yen/ℓ by Niigata JA (ZEN-NOH) - the operating body. According to the breakdown of the production cost, the raw material cost is 20 yen/kg. However, the cost of producing rice as a raw material was calculated while taking into account government subsidies. For reference, Table 11 shows changes in the production costs of domestic rice, published by the Ministry of Agriculture, Forestry, and Fisheries. The mean production cost of domestic rice during the past three years was 277 yen/kg, which means that the above-mentioned raw material cost of 20 yen/kg is less than one thirteenth of the actual rice production cost. Since the mean retail price of edible rice is 350 yen/kg[24], it is obvious that its production will be unprofitable without government subsidies.Table 12 shows the revenue and expenditure of growing rice as a raw material of bio-ethanol, proposed by Niigata ZEN-NOH (JA) to farmers. There is a difference of approximately 60,000[yen/10a] between the equipment and material costs estimated by Niigata ZEN-NOH (JA), 26,000[yen/10a] including the costs of farm equipment, and the national mean (2008), 85,500[yen/10a] (Table 11). The equipment and material costs calculated by ZEN-NOH (JA) are 50% of the total costs of seeds and seedlings, fertilizers, pesticides, and fuels, and exclude the costs of other materials, land improvement and water use, borrowing and lending, public dues, buildings, farm equipment, and production control, as the expenditure of growing edible rice. There is also a difference of approximately 30,000[yen/10a] between the labor cost calculated by ZEN-NOH (JA) based on working hours per area of six[hours/10a], 9,600[yen/10a], and the national mean (2008) based on working hours per area of 27[hours/10a], 38,654[yen/10a] (Table 11).The farmers produce the high-yielding rice for the raw material (yield per area: 800[kg/10a]) during the period when edible rice is not produced without purchasing new farm equipment, materials, and devices for its production. In other words, they produce rice for the raw material of ethanol as a sideline business at a low production cost. Despite their cost-saving efforts, they run a deficit of 2,600[yen/10a], according to the above-mentioned estimate. Although they can produce the raw material at a lower cost, compared to edible rice, because it does not require a drying process, its production is far from making profits.Currently, farmers growing rice as a raw material of ethanol receive subsidies of 30,000[yen/10a] from the government. This translates into 37.5 yen per 1 kg of rice (≈ 30,000[yen/10a]/800[kg/10a]), calculated based on the yield per area of 800[kg/10a]. Since the current ethanol yield from rice is 0.447 ℓ/t, the amount of subsidies to farmers is estimated at 83.9 yen/ℓ (≈ 37.5[yen/kg]/0.447[ℓ/kg]).The budget for the demonstration plant in Niigata that produces 1,000 kℓ/year of ethanol is 1.3 billion yen (Table 5). The annual cost of depreciation on equipment (excluding the interest) will be 86.7 yen/ℓ (≈ 1.3 billion yen/1,000[kℓ/year]/15 years), if the cost is depreciated over a period of 15 years. An estimate of 43.4 yen/ℓ is supported by the government, as it provides subsidies to cover half of the expenditure of the project. In addition, 3% (1.6 yen/ℓ), which is the percentage of ethanol included in gasoline, of the gasoline tax (53.8 yen/ℓ) is subsidized by the government.Table 13 summarizes the subsidies provided to support the demonstration project. The government provides subsidies of 128.9 yen/ℓ for the project of Niigata ZEN-NOH (JA), which is imposing a heavy burden on the public. The 4th goal for “The Biomass Nippon Strategy” is the “revitalization of agriculture, forestry, and fisheries, including farming, mountain, and fishing villages”. However, the promotion of domestic bio-ethanol production using idle land, as stated in the policy, causes an adverse effect: “an increase in the economic burden on the public”, rather than revitalizing agriculture. The subsidies provided for the production and use of bio-ethanol have not generated, and will not generate, the expected CO2-reducing effects (refer to[3.4]).
|
3.4. CO2-reducing Effects in the E10 Plan
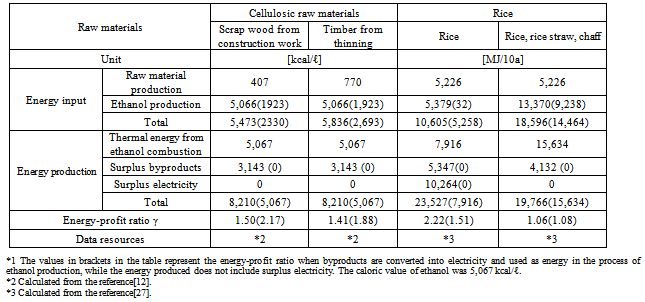
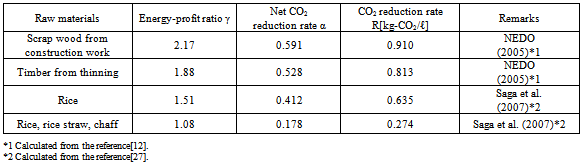
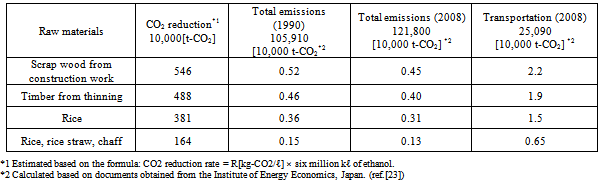
- In ethanol production using cellulosic materials (scrap wood, timber, rice straw, and chaff), lignin is produced in the process of pretreatment, and rice straw and chaff in raw material production when using rice. If energy generated by combusting these byproducts is used, in the form of electricity, in the process of ethanol production, it will reduce the required energy input from the outside, leading to an improvement in the energy-profit ratio.Table 14 shows the energy-profit ratio of domestic bio-ethanol when energy is generated by combusting its byproducts and used. In calculation of the energy-profit ratio, the energy of byproducts was not included in the amount of energy production, and the lower caloric value (5,067 kcal/ℓ-ethanol) was used, as described in the preceding paragraphs. The values in the brackets in the table represent the energy-profit ratio when byproducts are converted into electricity and used as energy in the process of ethanol production, while the energy produced does not include surplus electricity. Even if energy is produced from byproducts and used, the energy-profit ratio of bio-ethanol is lower than that of gasoline (6.57) - a fuel to be replaced[2]. Bio-ethanol is not an efficient fuel, with its energy-profit ratio being higher than two.Table 15 shows the net CO2 reduction rate α and CO2 reduction rate R (excluding CO2 emissions in ethanol production), calculated using Formulas (1) and (3), respectively, based on the ratio of CO2 emissions generated from primary energy sources to gasoline (Ep/Eg: 0.888) (refer to 3.2) and “γ” (the energy-profit ratio in the brackets in Table 14).According to the estimation results, the net CO2 reduction rate α was higher than zero, which suggests that CO2-reducing effects are expected to some extent. Specifically, the net CO2 reduction rate for wood (classified into cellulosic materials including scrap wood and timber) and corn (a material rich in starch as with rice) produced in the U.S. was lower than zero[2], and CO2-reducing effects are not expected. However, these results are not actual measurements, and the validity of the energy-profit ratio should be critically discussed.The amount of ethanol required for the E10 plan is approximately six million kℓ, although the proportions of raw materials to be used have not been determined. Table 16 shows the CO2-reducing effects of each raw material that the E10 plan is expected to produce, estimated based on the reduction rate R (excluding CO2 emissions in ethanol production) for each material (Table 15).
|
|
|
|
- According to the estimation results, the E10 is expected to reduce CO2 emissions by only up to 0.52%, on the basis of the total domestic CO2 emissions in 1990 (the base year stipulated in the Kyoto Protocol). The effects are even smaller (a 0.45% reduction at best) if based on the total domestic CO2 emissions in 2008. The plan is expected to reduce GHG by less than 3%, even on the basis of the total CO2 emissions related to transportation in 2008. Although technological innovation may increase the CO2-reducing effects of bio-ethanol to some extent, they are expected to remain low. This means that Japan continues to invest substantial subsidies in an effort to accomplish the ineffective E10 plan.
4. Assessment of the Cost-effectiveness of CO2 Reduction
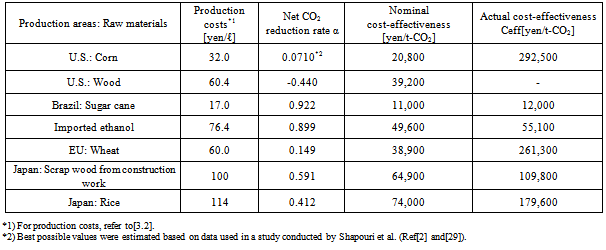
- Table 17 shows the actual cost-effectiveness of CO2 reduction in the lifecycle of ethanol while taking into account CO2 emissions in the process of its production, calculated using Formula 4 and based on ethanol production costs (refer to[3.2]) and the net CO2 reduction rate α (refer to Reference 21 and Table 15). The nominal cost-effectiveness was calculated by employing the principle of carbon neutrality (based on the assumption that the net CO2 reduction rate α=1) adopted by the government. In other words, the value was calculated by excluding CO2 emissions produced in the process of ethanol production.The table shows significant differences between the nominal and actual cost-effectiveness of bio-ethanol-based CO2 reduction, which has been implemented in a number of countries, revealing perception gaps. The reduction rate α was lower than zero for some types of corn and wood (a cellulosic material) produced in the U.S., which does not support the effectiveness of the production and use of bio-ethanol as a CO2 reduction measure. Regarding American corn in particular, the reduction rate α was very low (α was around 0.0710 or lower), and so was the cost-effectiveness. This also applied to wheat produced in EU countries.The table also shows the cost-effectiveness of CO2 reduction using bio-ethanol imported from Brazil - part of “The Biomass Nippon Strategy”. In the EU’s Emission Trading - an international market for trading GHG emission rights, the closing price in December 2008 was 2,713 yen/t-CO2 or 20.87 euro/t-CO2 (conversion rate: 130 yen/euro)[28]. From the viewpoint of the cost-effectiveness of CO2 reduction, the price of bio-ethanol imported from Brazil is more than 20 times as high as the emission trading market rate; CO2 reduction using bio-ethanol imported from Brazil is expected to result in significant economic loss. The cost-effectiveness and economic efficiency of bio-ethanol-based CO2 reduction are markedly lower than those of other GHG reduction measures.
5. Discussion
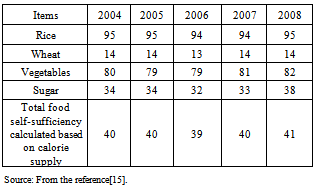
- The efficacy of bio-ethanol as an environmental measure is currently assessed based on the principle of carbon neutrality, which has been adopted by the Japanese government. However, such assessment does not take into account CO2 emissions in ethanol production. In the present study, quantitative assessment of the net amount of CO2 reduction was conducted, taking into consideration the amount of CO2 emitted in the process of ethanol production, and the significance of the “Biomass Nippon Strategy”, a national policy, as well as the feasibility and economic efficiency of the plans were discussed.As a mid- and long-term strategy, Japan plans to substantially increase the domestic production of bio-ethanol that can compete with other fuel products in Japan and other countries in terms of the price and quality until 2030. However, its production cost is relatively high, when compared to gasoline and imported ethanol, and domestic bio-ethanol production is not profitable without government subsidies. According to data of the demonstration project published by ZEN-NOH (JA) in Niigata Prefecture, the government provides 128.9 yen per 1ℓ of bio-ethanol as subsidies, which has been incurred by the public. One of the goals for “The Biomass Nippon Strategy”, a national policy, is the “revitalization of agriculture, forestry, and fisheries, including farming, mountain, and fishing villages”. However, the promotion of domestic bio-ethanol production using idle land, as stated in the policy, causes an adverse effect: “an increase in the economic burden on the public”, rather than revitalizing agriculture. It is not expected to generate substantial CO2-reducing effects. In fact, the bio-ethanol policy may only serve to increase the economic burden on the public, and waste funds that should be spent to revitalize the Japanese agricultural industry.Agriculture in Japan had long been supported by rice production. However, now that the Japanese export industry has regained its strength, the country can afford to import food from other countries, which has been weighing on the domestic agricultural industry. In addition to a reduction in tariffs responding to the international trends of free trade, a decrease in the consumption of rice among the Japanese due to changes in their food preferences led to a decline in its price and extensive areas of idle agricultural land. As a measure to address this problem, bio-ethanol production using idle land was proposed, and the “Law concerning Biofuels in Agriculture, Forestry, and Fisheries” was established. However, to revitalize agriculture in Japan, priority should be placed on efforts designed to improve the low food self-sufficiency rate - 41% on a supplied calorie basis. It would be wiser to grow crops on idle agricultural land, and allocate part of the sales of the products, which otherwise would have been used to import foreign agricultural produce, for promotion of the Japanese agricultural industry.With a bio-ethanol production goal of six million kℓ for the year 2030, Japan has been involved in the effort to promote “E10 Fuel” - a hybrid of gasoline and 10% bio-ethanol. However, as of today, the annual bio-ethanol production capacity is estimated at 36,000 kℓ based on the domestic production scale. It is very difficult to use food crops to produce biofuels in Japan, whose food self-sufficiency rate is very low, compared to other countries with high agricultural production capacities where biofuels are produced using surplus crops. Even if surplus rice and cellulose are used as raw materials, the production capacity is estimated at 5.47 million kℓ - six million kℓ less than required in the E10 plan. Its feasibility is also low in terms of the scale of plants, procurement of raw materials, and production costs.Energy production by combusting byproducts and its use in the process of ethanol production would improve the energy-profit ratio and CO2-reducing effects. However, even if these technologies become available, the domestic production and use of bio-ethanol are expected to have only limited CO2-reducing effects (a reduction of up to 0.52% when compared to CO2 emissions in 1990).It should be noted that all of the environmental measures that are currently being implemented are not necessarily eco-friendly. You should not describe the effects of bio-ethanol ambiguously, using a word suggestive of environmental conservation - carbon neutrality. Environmental issues require thorough scientific discussions. The government should understand the nature of an environmental issue, design a feasible plan for effective and economically efficient environmental measures, and invest in it.
References
| [1] | Ministry of Agriculture, Forestry and Fisheries, Japan, The Biomass Nippon Strategy, available online at: http://www.maff.go.jo/j/biomass/pdf/h18_senryaku.pdf (accessed 26 October 2012). |
| [2] | M. Yamashita and H. Aimoto, Resources and Environment, 2, 240-247 (2012). |
| [3] | Renewable Fuels Association, World Fuel Ethanol Production, available online at:http://www.ethanolrfa.org/pages/World-Fuel-Ethanol-Production (accessed 26 October 2012). |
| [4] | Y. Ohijiri, Zukai Bio-ethanol Saizensen, Kogyo Chosakai, Tokyo (2008) 49. |
| [5] | NOCS, Corn in the world, available online at: http://nocs.myvnc.com/study/geo/corn.htm (accessed 26 October 2012). |
| [6] | NOCS, Wheat in the world, available online at: http://nocs.myvnc.com/study/geo/wheat.htm (accessed 26 October 2012). |
| [7] | T. Koizumi, Bio-ethanol to Sekai no Shokuryo Jukyu, Tsukuba Shobo, Tokyo (2007) 45. |
| [8] | Ministry of Agriculture, Brazil, Livestock and Food Supply, Sugar and Ethanol in Brazil, 25 (2008). |
| [9] | J. Shimizu, Brazil sato sangyo no tenkai (Development of the sugar industry in Brazil), available online at: http://www.maff.go.jp/j/kokusai/kokusei/kaigai_nogyo/k_syokuryo/h16/pdf/h16_america_05.pdf (accessed 26 October 2012). |
| [10] | Ministry of Agriculture, Forestry and Fisheries, Japan, Kokusaitekina komugi jukyu no gaiyo (Summary of the International wheat supply and demand), available online at: http://www.maff.go.jp/j/zyukyu/jki/j_rep/monthly/pdf/wheat_1209.pdf (accessed 26 October 2012). |
| [11] | The Council of Biomass Nippon Strategy, Kokusan bio-nenryo no Ohabana seisankakudai (Large production expansion of the domestic bio-fuels), available online at: http://www.maff.go.jp/j/press/2007/pdf/20070227press_1b.pdf (accessed 26 October 2012). |
| [12] | Japan Alcohol Association, Zukai Bio-ethanol Seizo Gijutsu, Kogyo Chosakai, Tokyo (2007), 46-47, 122-123. |
| [13] | DINS Sakai Inc., Bio-ethanol Facility, available online at: http://dins-sakai.jp/business/baio-business/index.html (accessed 27 October 2012).. |
| [14] | Ministry of the Environment, Government of Japan, Yusoyo eco-nenryo no fukyu kakudai ni tsuite (On the spread of eco-fuels for transportation), 2-3, (2009), available online at: http://www.env.go.jp/earth/ondanka/biofuel/materials/rep_h2101.html (accessed 27 October 2012).[15] Ministry of Agriculture, Forestry and Fisheries, Japan, Shokuryo jikyuritsu no suii (Change of the food self-sufficiency ratio), available online at:http://www.maff.go.jp/j/zyukyu/zikyu_ritu/pdf/sankou4.pdf (accessed 27 October 2012). |
| [15] | T. Yamada, Kagaku Kogaku, 71, 79 (2007). |
| [16] | Ministry of Agriculture, Forestry and Fisheries, Japan, Beikoku no jukyu oybi kakaku no anntei ni kansuru kihonshishin (Basic guidance about the stability of the supply and demand and the price of rice) , 9-11 (2008), available online at:http://maff.go.jp/j/seisan/keikaku/beikoku_sisin/h200731/pdf/kihon_sisin.pdf (accessed 27 October 2012). |
| [17] | Ministry of Agriculture, Forestry and Fisheries, Japan, Report on the minimum access rice, 17 (2009), available online at:http://www.maff.go.jp/j/council/seisaku/syokuryo/0903/pdf/ref_data2.pdf (accessed 27 October 2012). |
| [18] | T. Yamada, Kagaku Kogaku, 71, 86-87 (2007). |
| [19] | Japan Organic Recycling Association, Shokan kouekihoujin nitaisuru kinsen kofugakutou nikansuru shiryo (Document about the amount of money grant for the public service corporation), 2 (2008), available online at: http://www.cao.go.jp/bunken-kaikaku/iinkai/kaisai/dai46/46shiryou15.pdf (accessed 27 October 2012). |
| [20] | T. Inoue, bio-nenryo no donyujittai to kongo no mitooshi (The introduction actual situation of the biofuel and future prospect), 4-5 (2008), available online at: http://www.teikokushoin.co.jp/journals/geography/pdf/200704/geography200704-04-05.pdf (accessed 27 October 2012). |
| [21] | Market Perspectives, Genyu CIF yoso to gasoline oroshi (CIF expectation of crude oil and gasoline wholesale), available online at: http://www.shikyo.ecweb.jp/c-cif.htm (accessed 27 October 2012). |
| [22] | The Institute of Energy Economics, Japan, EDMC Handbook of Energy & Economic Statistics in Japan, 44-45 (2009). |
| [23] | S. Yamagishi, Production of bio-ethanol from rice as raw materials, available online at:http://www.sce-net.jp/energypdf/biorice.pdf (accessed 27 October 2012). |
| [24] | Ministry of Agriculture, Forestry and Fisheries, Japan, 85th Statistical Table (2009), available online at: http://www.maff.go.jp/j/tokei/nenji/85nenji/index.html (accessed 27 October 2012). |
| [25] | JA (ZEN-NOH) Niigata, Bio-ethanol ni kannsuru torikumi (Action about the bio-ethanol)(2007), available online at: http://www.nt.zennoh.or.jp/contents/tsukuru/einou/pdf/20071112no2.pdf (accessed 27 October 2012). |
| [26] | K. Saga, S. Yokoyama, and K. Imou, Journal of Japan Society of Energy and Resources, 29,30-35 (2007). |
| [27] | T. Ikuta, Economic Review, 12, 116-117 (2008). |
| [28] | H. Shapouri, J. A. Duffield and M.Wang, Agricultural Economic Report, 814, 28 (2002). |