S. M. El Shazly , Kh. O. Kassem , A. A. Hassan , Hala. E. A.
Atmospheric physics group, Physics Dep., Faculty of science, S.V.U., Qena, Egypt
Correspondence to: Kh. O. Kassem , Atmospheric physics group, Physics Dep., Faculty of science, S.V.U., Qena, Egypt.
| Email: |  |
Copyright © 2012 Scientific & Academic Publishing. All Rights Reserved.
Abstract
Radiosonde and surface meteorological data have been carried out in south valley university meteorological station at Qena / upper Egypt for estimation of maximum and minimum mixing height MH during the periods (2006 - 2008) and (October 2004 - September 2005), respectively. The effect of some meteorological parameters such as temperature (T 0C), wind speed (WS m/s), and relative humidity (RH%) on maximum MH has been studied. It is found that average daily maximum MH ranges from (700 m) to (2367 m) in winter, and from (567 m) to (2700 m) in autumn and from (1133 m) to (4860 m) in spring, and from (1200 m) to (3750 m) in summer. Seasonal average value of maximum MH reaches its maximum (2425 m and 2481 m) during spring and summer, respectively, while, it attains its minimum ( 1418 m and 1504 m) during winter and autumn, respectively. Minimum MH has generally a value between 100 and 200 m. Seasonal average of minimum MH is characterized by small fluctuation. Where, it varies from (166 m and 197 m) during spring and summer, respectively to (161 m and 173 m) during winter and autumn, respectively. Monthly averages of maximum MH is associated forwardly with T and WS and associated backwardly with RH. A model relates monthly average values of maximum MH at afternoon with T, WS and RH has been constructed and can be used locally for estimation of monthly average MH.
Keywords:
Mixing Height, Daily Variation, Seasonal Variation, Weather Parameters
Cite this paper:
S. M. El Shazly , Kh. O. Kassem , A. A. Hassan , Hala. E. A. , "Assessment of Mixing Height at Qena/Upper Egypt Based on Radiosonde Data", Resources and Environment, Vol. 2 No. 6, 2012, pp. 275-280. doi: 10.5923/j.re.20120206.05.
1. Introduction
Air pollution models (Lagrangian, Eulerian or Gausian) are useful tools for evaluating emission rates and quantifying adverse pollutant effects in certain region. Stability and MH are two important dispersion parameters for those models. Hence, the need is raised for estimation of these two parameters. MH is a fundamental parameter characterising the structure of the lower troposphere. It can be defined as the height of the layer adjacent to the ground over which pollutants or any constituents emitted within this layer or entrained into it become vertically dispersed by convection or mechanical turbulence[1]. Air that is not moving smoothly is termed turbulent. Turbulence is described as eddies in a local air parcel that produce mixing via two mechanisms. The first of these is purely mechanical turbulence, which is caused by irregular air movement over terrain such as trees or around obstructions such as buildings. Thermal turbulence, the second mechanism occurs as the result of radiation from the sun heating various objects. Differential surface heating occurs, which leads to small parcels of air moving upward. The maximum mixing height is the height of the convective layer associated with the maximum surface temperature. The maximum mixing height exhibits both local and seasonal variations. In addition it is affected significantly by topography and large scale air movements. Minimum values of mixing height will be observed in the late hours of the night or in the early morning hours and may be the result of a surface based inversion[2]. The pollutants which released into the air from any source of pollution are being continually mixed. On hot days, they are taken up extremely high away from the ground. In contrast to that, in cool days, the mixing height is very low and pollutants remain close to the ground.There is an enormous uncertainty in estimation of mixing height since it is not a directly measurable variable [3, 4]. Holzworth method is the most commonly used one for calculating MH from temperature profile which can be obtained from radiosonde data[5]. Radiosonde is a balloon borne measurements of the vertical profiles of meteorological parameters, i.e., pressure, temperature and relative humidity, it is the most common source of data for operational determination of the MH [6]. Qena is a small city in upper Egypt. It is a place of many factories such as Aluminium factory, two factories of sugar and a factory of cement. There is strong need for estimation of MH in this city to be used in pollution modelling in the future. So that, the main purpose of this study is to estimate afternoon (12 Z) and early morning (0 Z) MH in Qena during the periods from 2006 to 2008 and from October 2004 to September 2005, respectively. The effect of some meteorological parameters such as temperature, wind speed, and relative humidity on maximum MH has been studied and an empirical model relates monthly values of maximum MH with T, WS and RH has been constructed.
2. Location description
Qena City (26°17' N, 32°43' E, 97 m asl) is located in Upper Egypt, about 600 Km south of Cairo and 60 Km north of Luxor (Figure 1). It located mainly within the narrow Nile valley which separates Egypt to two unequal dessert parts, the western and the eastern deserts. Climate of Qena is very hot, dry in summer and cold in winter. It rarely rains. Also, it receives large quantity of solar radiation, especially in summer [7].  | Figure 1. map of Egypt, location of studied area |
3. Materials and Methods
Data has been collected from South valley university station at Qena, in the eastern desert part, about 6 Km north east of Qena city. The data included surface hourly and daily values of T oC, RH % and WS m/sec, during the period (2004-2008). Within this period, upper air data (Pressure, WS, WD, T and RH as functions of altitude) have been conducted using radiosonde at afternoon ( 12 Z, 2 pm) during the period from 2006 to 2008, and at morning (00 Z, 2 am) during the period from October 2004 to September 2005. Radiosonde data at (12 Z) represented 1041 records during the total period (1095dayes), while that at (00 Z) represented 346 records during the total period (365 days).The complete radiosonde system consisted of 1- A balloon-borne radiosonde instrument package, 2- A radio receiver, 3- A tracking unit, and 4- A recorder .The balloon-borne radiosonde instrument package is the main component of the radiosonde, Model M2k2-DC. complete specifications can be found inhttp://www.meteomodem.com/rproduit.php?nom=M2K2-DC. The following weather sensing instruments are located within or attached to this package. resistance thermistor for measuring temperature, hygristor sensor for measuring humidity and an aneroid barometer for measuring pressure. The radiosonde package is carried aloft by a spherically shaped balloon. The balloon is made of a film of natural or synthetic rubber (neoprene). A radio receiver model SR2K2 Modem is used for receiving the telemetry signal transmitted from the radiosonde. Complete specifications can be found in http://www.meteomodem.com/gproduit.php?nom=SR2K2. Highly directional radio direction finding antenna is used also to obtain the wind speed and direction at various levels in the atmosphere by tracking the radiosonde and determining the azimuth and elevation angles. The data are recorded automatically during the flight and then processed.For determining MH, three preliminary categories are distinguished by vertical temperature profiles: an elevated inversion layer, a ground based inversion layer, and no inversion layer. The following describe the three cases:For an elevated inversion layer, the mixing height is taken as the base of the lowest inversion[8, 9].If a ground-based inversion has been detected in the radiosonde temperature profile, the mixing height has been identified with the ground based top height [10].If an inversion is not present, the mixing height is taken as the altitude of level defined by the first intersection of the temperature profile with dry-adiabatic line this method is called Holzworth method or dry adiabatic method [11, 12, 13, 14, 15, 16].
4. Results and Discussion
4.1. Maximum Mixing Height
Daily variation of average maximum MH at afternoon in Qena during the period (2006 - 2008) is shown in figure 2. From this figure one can see that average values of maximum MH during winter and autumn are relatively lower than that during spring and summer. It ranges from (700 m) to (2367 m) in winter, and from (567 m) to (2700 m) in autumn and from (1133 m) to (4860 m) in spring, and from (1200 m) to (3750 m) in summer.Seasonal average, maximum, minimum and standard deviation values of maximum MH during the same period have been investigated. It is clear that seasonal average values of maximum MH ranged from low values (1418 m) and (1504 m) to relatively high values (2425 m) and (2481 m) during winter, autumn, spring and summer, respectively. By the same seasonal consequences, seasonal maximum values of maximum MH ranged from (2367) and (2700) to (4860) and (3750). While, seasonal minimum values of maximum MH ranged from (700) and (567) to (1133) and (1200) . Also, standard deviation ranged from relatively low values (353) and (458) to relatively high values (668) and (604) as shown in figure (3). This may be attributed to the relatively high day to day variability of temperature and wind speed in spring and summer seasons.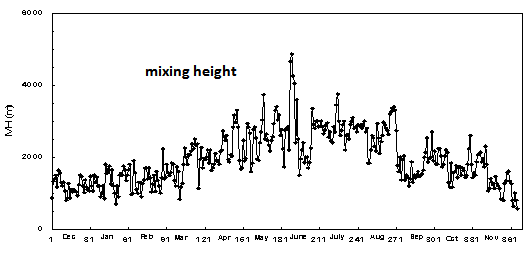 | Figure 2. Daily variation of average maximum MH at afternoon time in Qena, during the period (2006 - 2008) |
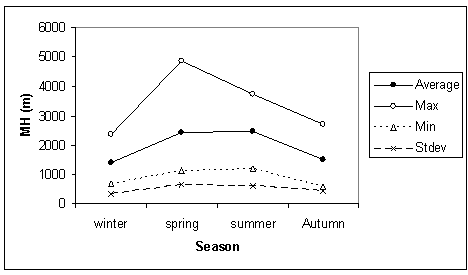 | Figure 3. Seasonal average, maximum, minimum, and standard deviation variation of maximum MH at afternoon time in Qena ( 2006- 2008) |
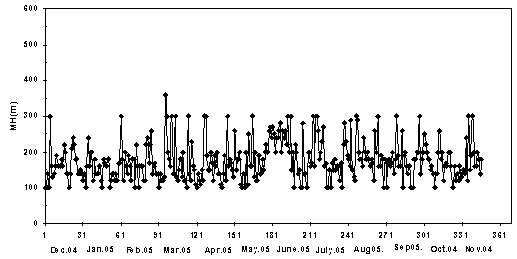 | Figure 4. Daily variation of minimum MH in Qena, during the period (October 2004 – September 2005) |
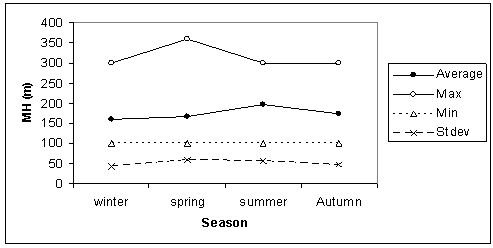 | Figure 5. Seasonal average, maximum, minimum, and standard deviation variation of minimum MH at early morning in Qena, during the period (October 2004 – September 2005) |
4.2. Minimum Mixing Height
Daily variation of minimum MH during the period (October 2004 – September 2005) is illustrated in figure 4. About (80%) of the total number of the recorded data (346) are characterized with values of minimum MH range from (100 m) to (200 m). The number of nights that characterized by minimum MH between (200 and 300 m) represented only (19 %), most of them (95%) observed during spring and summer seasons.Seasonal variation of average, maximum, minimum and standard deviation of minimum MH during the same period is studied. It is found that seasonal average values of minimum MH ranged from low values (161 m) and (166 m) during winter and spring, respectively, to (173 m) and (197 m) during autumn and summer, respectively. Seasonal maximum values of minimum MH range from (300 m) during winter, autumn and summer to (360 m) during spring. Seasonal minimum values are the same (100 m) during all seasons. Standard deviation ranges from relatively low values (42 m) and (48 m) during winter and autumn, respectively to relatively high values (59 m) and (58 m) during spring and summer seasons, respectively, as shown in figure 5. This may be attributed to the relatively high day to day variability of temperature and wind speed in spring and summer seasons.At night time, the radiation inversion is the most common form of surface inversion and occurs when the earth's surface cools rapidly. As the earth cools, so does the layer of air close to the surface. If this air cools to a temperature below that of the air above, it becomes very stable, and the layer of warmer air impedes any vertical motion. Radiation inversions usually occur in the late evening through the early morning under clear skies with calm wind.
4.3. Effect of Some Meteorological Parameters on Afternoon MH
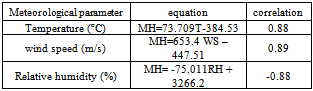
Figure 6 and Table 1 illustrate monthly average variation of maximum MH and corresponding values of T, RH and WS estimated at afternoon time in Qena during the period ( 2006- 2008). It is clear that minimum monthly average values of maximum MH occurred in cold months especially in December (1193 m), while maximum values occurred in hot months especially in July (2809 m). There is positive association between monthly averages of maximum MH and both of T and WS, in the same time, there is negative association with RH. Where, T monthly average value reaches its minimum value in cold months, January (19.8oC) and December (22.4oC), and reaches its maximum in hot months, June (40.1 oC) and August (39.8oC). RH monthly average value reaches its minimum value in June (9.1%) and May (9.5 %), and its maximum in January (29.9 %) and December (27,9 %). WS monthly average value reaches its minimum value in December (2 m/s), and January (2.9 m/s), and its maximum in July (5 m/s), and June (5.7 m/s). The highest MH occurrence in summer, and spring months may be attributed to increasing the frequency of unstable and slightly unstable atmospheric stability conditions in summer and spring in Qena[17], also, high atmospheric temperature associated with strong solar radiation and significant atmospheric turbulence lead to high MH. Higher wind speeds lead to strong mechanical turbulence and therefore high MH. In winter and autumn, low temperature and high frequencies of inversion result in stable atmospheric conditions and less turbulence and hence lead to low MH. High RH also limits MH development and leads also to low MH [15,16]. Table 2 shows the equation and correlation coefficient between monthly average values of maximum MH and each of T, WS, and RH. It is clear that there are strong correlation between them. These strong correlation Coefficients lead us to suggest an empirical model for calculating monthly average values of maximum MH using data of monthly average values of T, WS and RH% measured at (2 pm). Multiple regression analysis has been used and a model in the form: | (1) |
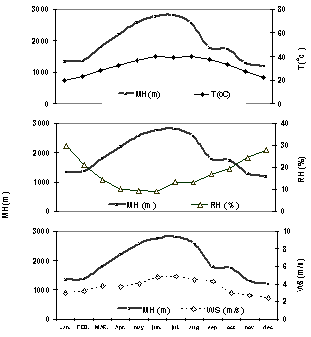 | Figure 6. Monthly variations of average maximum MH and corresponding values of T,RH, and WS at afternoon time in Qena during the period ( 2006- 2008) |
| Table 1. Monthly average values of maximum MH and corresponding values of T, RH, and WS at afternoon time in Qena during the period ( 2006- 2008) |
| | Month | MH(m) | T(oC) | RH(%) | WS(m/s) | | January | 1347 | 19.8 | 29.9 | 2.98 | | February | 1375 | 23.6 | 21.1 | 3.20 | | march | 1816 | 28.6 | 14.4 | 3.75 | | April | 2214 | 32.8 | 10.2 | 3.69 | | May | 2581 | 36.8 | 9.50 | 4.02 | | June | 2774 | 40.1 | 9.10 | 4.79 | | July | 2809 | 39.1 | 13.3 | 5.00 | | August | 2565 | 39.8 | 13.2 | 4.50 | | September | 1785 | 37.5 | 17.0 | 4.31 | | October | 1740 | 33.5 | 19.4 | 2.96 | | November | 1292 | 27.2 | 24.5 | 2.71 | | December | 1193 | 22.4 | 27.9 | 2.00 |
|
|
Table 2. The equation and correlation coefficient between monthly average values of maximum MH and each of T, WS, and RH
 |
| |
|
Has been constructed. Where A, B, and C are the coefficients of the, T, WS and RH variables, respectively. D is a constant involves any other not used effective parameters. The obtained regression model takes the form:  | (2) |
With multiple correlation coefficient (r = 0.94). For studying the efficiency of this model, It has been used for calculating monthly average values of maximum MH during the period from (October 2004 to April 2005). Figure 7 illustrates variation of monthly average values of measured and calculated maximum MH. It is clear that the model performs qualitatively good.Figure 8 represents the relation between measured and calculated values of maximum MH. The correlation coefficient between the two variables is (0.74) which indicates that this model is quantitatively rather good. The relation between the calculated and measured values of MH takes the form | (3) |
Where, MHcal is the calculated mixing height and MHm is the measured mixing height. It is clear that there is over estimation for the calculated MH values represented in average by 249.16 m. The coefficient of MHm is 1.1035 represents the ratio between the calculated and measured MH. this value is not so far from unit and reflects reasonable agreement between measured and calculated values.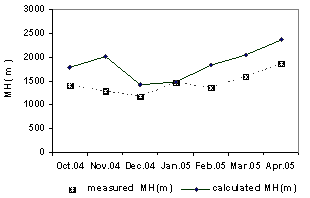 | Figure 7. Measured and calculated monthly average maximum MH variation in Qena / Upper Egypt during the period from October 2004 to April 2005 |
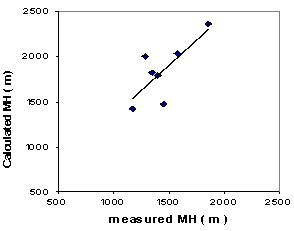 | Figure 8. Relationship between measured and calculated monthly average maximum MH in Qena / Upper Egypt during the period from October 2004 to April 2005 |
5. Conclusions
Radiosonde and surface meteorological data have been carried out in south valley university meteorological station at Qena / upper Egypt for estimation of maximum and minimum (MH) during the periods (2006 - 2008) and (October 2004 - September 2005), respectively. It is found that average daily maximum (MH) ranges from (700 m) to (2367 m) in winter, and from (567 m) to (2700 m) in autumn and from (1133 m) to (4860 m) in spring, and from (1200 m) to (3750 m) in summer. While, seasonal average values of maximum MH varies from relatively low values (1418 m) and (1504 m) during winter and autumn, respectively, to relatively high values (2425 m) and (2481 m) during spring and summer respectively. Seasonal average values of minimum MH are characterized by small fluctuation, (161 m) and (173 m) during winter and autumn respectively, and (166 m) and (197 m) during spring and summer respectively. Monthly average values of maximum MH varies forward with both of T and WS and backward with RH. A model estimating monthly average values of maximum MH using T, WS and RH data has been constructed and can be used locally for estimation of Monthly averages of maximum MH.The relatively high values of maximum (MH) during day time and low values during night time should be taken into account for arranging the working hours of the different factories emit pollutants to the atmosphere of Qena.
References
| [1] | Seibert, P., Beyrick, F., Gryning, S. E., Joffre, S., Ramussen, A. and Tercier, P. "Review and intercomparison of the operational methods for the determination of the mixing height." Atmos. Environ., 34, 1001 – 1027, 2000. |
| [2] | Roger D. Griffen. "Principales of air quality management." seconde edition. Taylor &Francis group LLC. P 111.-113. 2007. |
| [3] | Nath, S., Patil, R.S. "A simple model to determine in situ mixing height growth from surface measurement." Environmental Fluid Mechanics 3 (3), 195–219. 2003. |
| [4] | Nath. S., Patil. R. S. "Prediction of air pollution concentration using an in situ real time mixing height model." Atmospheric Environment 40, 3816–3822. 2006. |
| [5] | Ulke, A. G., Mazzeo, N. A. "Climatological aspects of the daytime mixing height in Buenos Aires City." Argentina. Atmospheric Environment Vol 32, No. 9, PP. 1615 – 1622, 1998. |
| [6] | Kim, S.-W., Yoon, S.-C., Won, J-G., Choi, S-C. "Ground-based remote sensing measurements of aerosol and ozone in an urban area: A case study of mixing height evolution and its effect on ground-level ozone concentrations." Atmospheric Environment 41, 7069–7081, 2007. |
| [7] | El-Shazly, S. M., Mohamed Abuel-Kassem, M. and Abdel-Azeem M. A.. " A statistical study on weather impaction concerning human well-being in the region of Qena, Egypt." Bull. Fac. Sci., Assuit Univ., 24(1-A), P-P. 189-206. 1995. |
| [8] | Robert B. "Determination of mixing heights from data collected during the 1985 SCCCAMP field program." Journal of Applied Meteorology, 30, 598-606. 1991. |
| [9] | Coulter R. L. "A comparison of three methods for measuring mixid layer height." Journal of applied meteorology. 18, 1495 – 1499, 1979. |
| [10] | Hassanein, A. .A., Abdel-Wahab, M. M., Metwally, Z. "Preliminary study of the lower tropospheric inversion statistics in Cairo." Meteorological research Bulletin. Vol. 8, No. 2, October 1976. |
| [11] | Holzworth, G. C. " Estimates of mean maximum mixing depths in the contiguous United States." Monthly Weather Review, Vol. 92, No. 5, pp. 235-242. 1964. |
| [12] | Holzworth, C. G. "Mixing depths, wind speeds and air pollution potential for selected locations in the United States." Journal of Applied Meteorology, 6, 1039 – 1044. 1967. |
| [13] | Holzworth, C. G. "Mixing depths, wind speeds and potential for urban pollution throughout the contiguous United States." EPA. Office of Air Programs Publication No. AP – 101, 118 pp. 1972: |
| [14] | Vittal Murty, K. P. R.; Viswanadham, D. V. and sadhuram, Y., "Mixing heights and ventilation coefficients for urban centres in India." Boundary layer meteorology, 19, 441 – 451. 1980. |
| [15] | Cheng, S. Y., Huang, G. H., Chakma A., Hao, R. X., Liu, L., Zhang, X. H. "Estimation of atmospheric mixing heights using data from airport meteorological stations." J. ENVIRON. SCI. HEALTH, A 36 (4), 521 – 532. 2001. |
| [16] | Cheng, S. Y, Jin, Y. Q., Liu, L., Huang, G. H., Hao, R. X., Jansson, C. R. E. " Estimation of atmospheric mixing height over large areas using data from airport meteorological stations." J. ENVIRON. SCI. HEALTH, A 37 (6), 991 – 1007 , 2002. |
| [17] | Adam, M. El-Nouby, Sayed, M. Elshazly. "Diurnal variation of atmospheric stability at Qena (Upper Egypt). MAUSAM, 59, 1, 69-76. January 2008. |
 Abstract
 Reference
 Full-Text PDF
 Full-Text HTML