Masakazu Yamashita , Hiroyuki Aimoto
Department of Environmental Systems Science, Doshisha University, Kyoto, 610-0394, Japan
Correspondence to: Masakazu Yamashita , Department of Environmental Systems Science, Doshisha University, Kyoto, 610-0394, Japan.
| Email: |  |
Copyright © 2012 Scientific & Academic Publishing. All Rights Reserved.
Abstract
The present study examined the efficacy of the use of bio-ethanol as an environmental protection measure by conducting quantitative assessment of the amount of CO2 emitted in its lifecycle, including the process of growing plants used as materials for bio-ethanol production. As a conclusion, it was suggested that the use of bio-ethanol does not reduce CO2 emissions, as it stands now, because a large amount of energy is required to produce it, i.e., bio-ethanol production consumes fossil fuels in a large quantity and emits a massive amount of CO2. Actually, the use of bio-ethanol varieties made from corn or wood as an alternative fuel to gasoline increased CO2 emissions. Furthermore, the production and use of bio-ethanol was less cost-effective than other CO2 reduction measures. This means that, in terms of both its effectiveness and economic efficiency, bio-ethanol would not contribute to promoting Japan’s “Biomass Nippon Strategy” and accomplishing its primary goal, the “prevention of global warming”.
Keywords:
Bio-Ethanol, CO2 Reduction, Life Cycle Assessment
1. Introduction
In 1997, the Kyoto Protocol was adopted at the Third Conference of the Parties to the United Nations Framework Convention on Climate Change (UNFCCC COP3) held in Kyoto. The protocol set Japan’s greenhouse gas reduction target for 2008 to 2012 at 6% from 1990 levels. At the convention, some rules were proposed and adopted, including: “CO2 emissions from the combustion of biomass are excluded from the energy-related CO2 emissions based on the principle of carbon neutrality”, to make it easier for participating countries to accomplish their goals.The principle of carbon neutrality is based on the idea that the combustion of biomass, a plant resource, does not increase or affect the amount of CO2 in the atmosphere. The reason, according to the principle, is that although CO2 is emitted by burning bio-ethanol, as in the case of fossil fuels, these GHG emissions are assumed to be recaptured by newly growing plants, the raw material of bio-ethanol, because they use CO2 in photosynthesis.In response to the current trend, Japan developed the “Biomass Nippon Strategy” in December 2002, and has been producing and using bio-ethanol based on it.In April 2006, the “Kyoto Protocol Target Achievement Plan” was adopted at a Cabinet meeting to introduce 500,000 kℓ of bio-fuel in crude oil equivalent (800,000 kℓ of bio-fuel in crude oil equivalent) for transportation in 2010. As raw materials, molasses, imperfect wheat, and other agricultural crops were selected. Of the 800,000 kℓ of bio-ethanol, 50,000 kℓ would be produced in Japan, and the remaining amount would be imported from Brazil and other countries.1In February 2007, relevant ministries, including “Agriculture, Forestry and Fisheries”, “Environment”, and “Economy, Trade, and Industry”, worked together to create a “schedule chart to markedly enhance the domestic production of bio-fuels”. According to the plan, as mid- and long-term goals by 2030, the development of technologies is promoted to produce bio-ethanol efficiently from rice straw, wood, and other cellulosic materials as well as crop resources including rice. The ministries also planned to enhance the domestic production of internationally competitive (in terms of price) bio-fuels. Specific efforts have already been made to promote E10, a fuel mixture of 90%gasoline and 10% bio-ethanol. The relevant ministries estimated that six million kℓ of bio-fuel (10% of the current gasoline consumption, 60 million kℓ) in ethanol equivalent could be produced in 2030.1 However, the principle of carbon neutrality was defined only focusing on parts of the entire system, i.e., the growth stage of plants as materials and the process of fuel consumption. In reality, the state of carbon neutrality in a strict sense cannot be achieved in the entire system because a large amount of CO2 is emitted from a massive amount of fossil fuels consumed in the process of ethanol production. To define ethanol as an ecological fuel, it is necessary to assess the CO2 reduction effect in the entire lifecycle while taking into account these CO2 emissions.Recently, people have started to pay attention to these points, including raw materials and production methods, and studies on the sustainability of bio-fuels are underway.2-5 However, assessment of the efficacy of bio-ethanol as an environmental measure is still based on only the principle of being carbon neutral in most cases, and quantitative assessment of the net amount of CO2 reduction, including CO2 emissions in ethanol production, is not conducted. To define ethanol as an ecological fuel, it is important to assess the CO2 reduction effect in the entire lifecycle, taking into consideration the above-mentioned CO2 emissions.For these reasons, the present study examined the efficacy of bio-ethanol as an environmental measure by conducting quantitative assessment of the net amount of CO2 reduction in the entire lifecycle, including the process of growing plants and CO2 emissions in bio-ethanol production.
2. Methods for Evaluation of CO2 Emissions Reduction Effects
To evaluate the CO2 reduction effects of bio-ethanol through its entire cycle, including CO2 emissions in ethanol production, when it is used as an alternative fuel to gasoline, the reduction rate α (actual CO2 reduction rate) was calculated using Formula (1): | (1) |
“A” indicates the amount of CO2 emissions reduction [kg- CO2/ℓ] when bio-ethanol is used instead of gasoline, i.e., CO2 emissions that can be reduced in accordance with the principle of carbon neutrality (CO2 emissions generated in the process of ethanol production are not included). “B” indicates CO2 emissions produced [kg- CO2/ℓ] when energy is consumed in ethanol production, and, therefore, “(A-B)” indicates the amount of CO2 reduction [kg- CO2/ℓ] through the lifecycle of ethanol, taking into account CO2 emissions generated in ethanol production.If the principle of carbon neutrality is applied, CO2 emissions produced using bio-ethanol are not counted, and the amount of CO2 emissions equivalent to the quantity that could be produced from the gasoline that would have been used is regarded as the amount of CO2 reduction. When “Qg” is the calorific value of gasoline [kcal/ℓ], “k” is the calorific value ratio of gasoline to bio-ethanol, and “Eg” is CO2 emissions per unit calorific value of gasoline [kg-CO2/kcal]: | (2). |
Since gasoline and ethanol have different properties, comparison of CO2 emissions from the two substances must be based on the calorific value, and corrections should be performed using the calorific value ratio “k”.When “Qe” is the calorific value of ethanol [kcal/ℓ]: | (3). |
Substituting Formula (3) into (2), we obtain: | (4). |
The CO2 emissions [kg-CO2/ℓ] when energy is input to produce ethanol (B) are expressed using the following formula: | (5) |
“Qp” represents the amount of energy [kcal/ℓ] input to produce ethanol, and “Ep” is CO2 emissions per unit amount of energy input [kg-CO2/kcal].By substituting Formulas (4) and (5) into (1) and rearranging yields: | (6) |
The energy profit ratio of bio-ethanol is “Qe/Qp” if it is substituted by the coefficient γ: | (7) |
Therefore, the actual CO2 reduction rate (when bio-ethanol is used) is calculated using the energy profit ratio: “γ”, and “Ep/Eg”: the ratio of CO2 emissions generated from primary energy sources in ethanol production to gasoline.As “Ep” represents the total of CO2 emissions generated from multiple primary energy sources in ethanol production: | (8) |
“Xi” is the component ratio of primary energy sources: “i”, and “Epi” is CO2 emissions per unit calorific value of primary energy sources (i) [kg-CO2/kcal].Therefore, by substituting Formula (8) and rearranging yields, the following formula is obtained: | (9) |
The larger this value, the larger the amount of fossil fuels used in ethanol production and CO2 emissions generated.Quantitative assessment of the CO2 reduction rate “R” [kg-CO2/ℓ] when bio-ethanol is used as an alternative to gasoline (taking into account the entire lifecycle including CO2 emissions in ethanol production) yields the following formula: | (10). |
When “Ceff” represents the actual cost-effectiveness of CO2 reduction in the entire lifecycle of bio-ethanol, and “Ce” [yen/ℓ] is the cost of bio-ethanol production, the following formula is obtained: | (11). |
If α>0 in Formulas (7), (10), and (11), the use of bio-ethanol as an alternative to fuel has CO2 reduction effects and its economic efficiency is high. When α=1, a carbon neutral state is adopted. If α<0, the use of bio-ethanol as an alternative to fuel increases CO2 emissions.
3. Assessment of the CO2 Reduction Effects of Bio-Ethanol
3.1. Amount of CO2 Reduced by the use of Bio-Ethanol as an Alternative to Gasoline
Table 1. Thermodynamic Data used
 |
| |
|
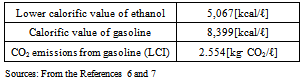
Based on Formula (4), the amount of CO2 [kg-CO2/ℓ] (A) reduced using bio-ethanol as an alternative to gasoline was calculated. This CO2 reduction rate represents the amount of CO2 reduced when the principle of carbon neutrality is adopted, ignoring CO2 emissions in ethanol production. Table 1 shows data used in the calculation.The CO2 emissions from gasoline (LCI), 2.554[kg-CO2/ℓ], include those produced in the processes of mining raw material resources, transportation to import them, purification, and combustion of gasoline. Based on these values, “Eg” (CO2 emissions per unit calorific value of gasoline [kg-CO2/kcal]) in Formula (4) is calculated as 3.041×10⁻⁴[kg-CO2/kcal](≒2.554[kg-CO2/ℓ]/8,399[kcal/ℓ]). When multiplying this value by “Qe” (the lower calorific value of ethanol), A is approximately 1.541[kg- CO2/ℓ](≒3.041×10-4[kg-CO2/kcal] ×5,067[kcal/ℓ]). This value means that 1.541 kg of CO2 emissions would be reduced if 1 ℓ of bio-ethanol was used instead of gasoline. The “lower calorific value” of ethanol and “higher calorific value” of gasoline were used in the study. The difference in a “lower” and “higher” calorific value would result in 5 to 10% differences in calculated values.
3.2. Ratio of CO2 Emissions from Primary Energy Sources to Gasoline
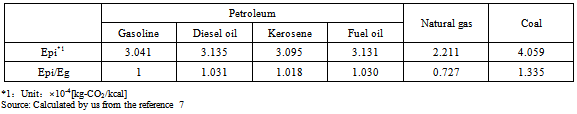
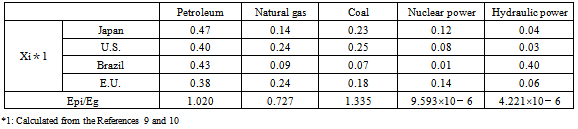
Based on Formula (9), “Ep/Eg” (the ratio of CO2 emissions from primary energy sources in ethanol production to gasoline) was calculated. In this study, petroleum, natural gas, coal, nuclear energy, and hydraulic power were selected because each of them accounts for a large proportion of the total of primary energy sources.Table 2 shows CO2 emissions per unit calorific value of petroleum-based fuel, natural gas, and coal (Epi) [kg-CO2/kcal]. These values represent CO2 emissions (LCI) produced in the processes of mining raw material resources, transportation to import them, purification, and combustion of gasoline. Table 5 also shows the ratios of CO2 emissions from each primary energy source to gasoline, or “Epi/Eg” (“Epi” values for each energy source divided by the CO2 reduction rate of gasoline, 3.041[kg-CO2/kcal]).It is believed that nuclear and hydraulic powers do not emit CO2, at least, to generate electricity. If this is true, CO2 is emitted only in the processes of facility construction and decommission in their lifecycles. According to an estimate published on the website of Kansai Electric Power Co., Inc., CO2 emissions produced in the processes of facility construction and decommission are 25 and 11 g/kWh for nuclear and hydraulic powers, respectively. As 1 kWh≒857 kcal, based on the above-mentioned estimates, “Epi/Eg” (the ratio of CO2 emissions to gasoline) is calculated as:9.593×10⁻⁶ (≒0.025[kg-CO2/kWh]/857[kcal/kWh]/ 3.041[kg-CO2/kcal]) for nuclear power, and, 4.221×10⁻⁶ (≒0.011[kg-CO2/kWh]/857[kcal/kWh]/3.041[kg-CO2/kcal]) for hydraulic power.These values only relate to CO2 emissions to generate electricity, and not the entire process of hydraulic or nuclear power generation.8Table 3 shows “Xi” (the component ratio of primary energy sources) along with “Epi/Eg” (the ratio of CO2 emissions from primary energy sources to gasoline) in Japan, the U.S., Brazil, and the E.U. (27 countries). “Epi/Eg” for petroleum was calculated as 1.020 using the mean value of petroleum-based fuels (gasoline, light oil, and kerosene in Table 5).Based on the results of Table 3 and Formula (9), the ratio of CO2 emissions from the primary energy source to gasoline (“Ep/Eg”) was 0.888, 0.916, 0.597, and 0.802 for Japan, the U.S., Brazil, and the E.U., respectively. The larger the value, the larger the proportion of fossil fuels to produce ethanol and, subsequently, the higher, the amount of CO2 emissions. The value is large in Japan, the U.S., and the E.U. whereas it is small in Brazil. In Brazil, CO2 emissions in ethanol production are smaller, compared to other countries because hydraulic power generation, which does not emit a large amount of CO2 through its entire lifecycle, accounts for 40% of the total.Table 2. The ratios of CO2 emissions from each primary energy source to gasoline
 |
| |
|
Table 3. Xi and Epi/Eg
 |
| |
|
3.3. Energy Balance Ratio in Fuel Production
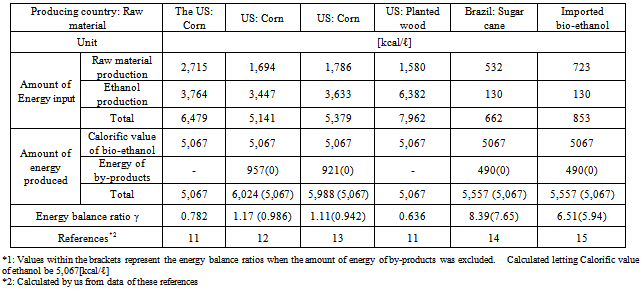
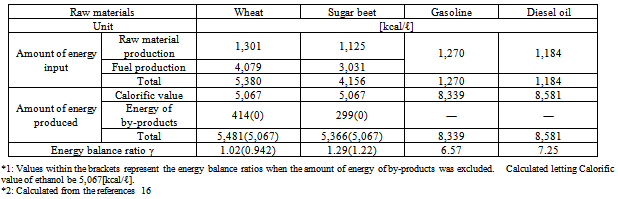
The energy balance ratio is an index calculated by dividing the amount of energy of ethanol produced and by-products by that of fossil fuel input. The higher the ratio, the larger the amount of net energy production, and the higher the energy productivity. An energy balance ratio lower than one means that the amount of net energy production is zero and that the substance is ineffective as an energy source.The energy balance ratio has been analyzed to determine energy efficiencies in agricultural production. In these calculations, the amount of energy produced is often expressed as a higher calorific value, or the calorific values of by-products created in the process of ethanol production are added to the amount of energy generated. However, when bio-ethanol is assessed as a fuel, the lower caloric value (5,067 [kcal/ℓ]) - refer to Table 4) should be used, and the energy of by-products should not be added to the amount of energy production because they are created in the process of ethanol production.The process of bio-ethanol production consists of two specific processes: raw material and ethanol production. The amount of energy input and output regarding the following items is counted, although it varies depending on the items adopted by the person who or organization that estimates it:1) Fossil fuel input directly (amount of direct energy input)2) Fossil fuels used to produce resources input into each process (pesticides, chemical fertilizers and agents, and lubricating oil) and generate electricity (amount of indirect energy input)3) Additional amounts of energy used to manufacture, assemble, and maintain necessary devices and machines as well as equipment and facilities required to produce fuel. In addition to these items, a trial calculation performed by Pimentel et al. included the amount of energy generated by persons and livestock in the process of raw material production, and that required for drainage treatment in the process of ethanol production.11 However, in this study, the amount of man- and animal-powered energy was excluded because it was not input as the energy from fossil fuels.Based on the these results, Tables 4 and 5 summarize the energy balance ratios of various types of bio-ethanol produced and used overseas. These values are based on actual cases. Values within the brackets in the tables represent the energy balance ratios when the amount of energy of by-products was excluded from the total amount of energy production.The energy balance ratios of corn and wood (cellulosic materials) grown in the U.S. and wheat grown in the E.U. were approximately one, which means that the amount of net energy production was zero.Table 5 also shows the energy balance ratios of fossil (gasoline and diesel) fuels (to be replaced by alternatives). The amount of energy input to produce bio-ethanol was 3.3 to 4.5 times larger than that required to generate fossil (gasoline and diesel) fuels. CO2 emissions from ethanol significantly increase environmental burdens because they are proportional to the amount of energy input as in the production of other fuels. The calorific value of bio-ethanol is approximately 60% of that of fossil fuels, which means that it produces only a small amount of energy. As it stands, the energy balance ratio of bio-ethanol is more than five times smaller than that of fossil fuels in the E.U.As bio-ethanol requires a large amount of energy in its dehydration process (Table 6), the energy conversion efficiency is low, and, consequently, the energy balance ratio is lower compared to fossil fuels. Just imagine the amount of effort and energy required to distill wine to produce brandy with a higher alcohol concentration. The amount of energy of bio-ethanol is equal to that of fossil fuels input to produce the ethanol. As its energy productivity is very low, the use of ethanol as a fuel is inefficient.Table 4. Energy balance ratios of bio-ethanol
 |
| |
|
Table 5. Energy balance ratios of fossil fuels in the EU.*1, *2
 |
| |
|
Table 6. Amount of energy required for dehydration process
 |
| |
|
| Table 7. Assessment of an actual CO2 reduction rate by bio-ethanol |
| | Producing country: Raw material | Energy balance ratio γ | Actual CO2 reduction rate α | CO2reduction rate R [kg-CO2/ℓ] | References | |
| US: Corn | 0.782 | -0.171 | -0.264 | 11 | | US: Corn | 0.986 | 0.0710 | 0.109 | 12 | | US: Corn | 0.942 | 0.0276 | 0.0425 | 13 | | US: Planted wood | 0.636 | -0.440 | -0.678 | 11 | | Brazil: Sugar cane | 7.65 | 0.922 | 1.42 | 14 | | Imported ethanol | 5.94 | 0.899 | 1.39 | 15 | | EU: wheat | 0.942 | 0.149 | 0.229 | 16 | | EU: Sugar beet | 1.22 | 0.343 | 0.528 | 16 |
|
|
3.4. The CO2 Reduction Effects of Bio-Ethanol as it Stands
Based on the ratios of CO2 emissions generated from primary energy sources in ethanol production to gasoline (“Ep/Eg”) in various countries (0.916 for the U.S., 0.597 for Brazil, and 0.802 for the E.U.: refer to 3.2) and the energy balance ratio of bio-ethanol: “γ” (refer to 3.3), the CO2 reduction effects of bio-ethanol were assessed. As the energy balance ratios “γ” relate to bio-ethanol production, the amount of energy of by-products was excluded from the total amount of energy production (values within the brackets in Tables 4 and 5). Table 7 shows the actual CO2 reduction rate (“α”) calculated based on Formula (7), and the CO2 reduction rate “R” based on Formula (10).The results show that the actual CO2 reduction rates (“α”) of bio-ethanol varieties made from corn or wood grown in the U.S. (cellulosic materials) were lower than zero. This means that the use of bio-ethanol as an alternative fuel to gasoline would increase CO2 emissions. The actual CO2 reduction rates (“α”) of other bio-ethanol varieties were also low except that of the bio-ethanol made from sugarcane grown in Brazil, indicating only small CO2 reduction effects. Since the amount of CO2 reduction based on the principle of carbon neutrality was approximately 1.541[kg- CO2/ℓ], and, as a comparison to the CO2 reduction rate “R” in the table shows, CO2 reduction effects were considered to be low. This was because, as “Ep/Eg” values showed, a large amount of CO2 was emitted in the process of ethanol production (refer to 3.2).Table 8. Amount of energy input required to prepare bio-ethanol from corn in the U.S
 |
| |
|
Table 9. Amount of energy input required to prepare bio-ethanol from sugar cane in Brazil
 |
| |
|
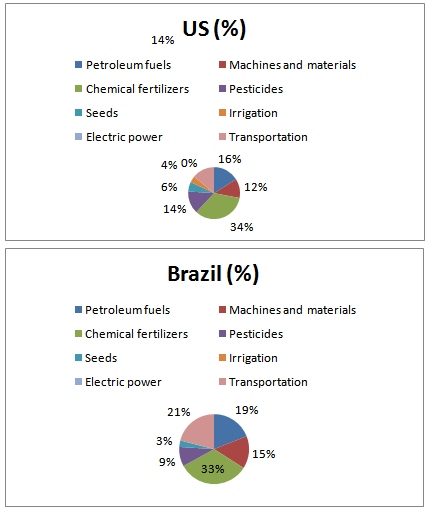 | Figure 1. Ratios of energy input in the preparation of bio-ethanol from corn in the U.S. and from sugar cane in Brazil |
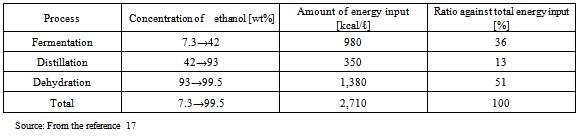
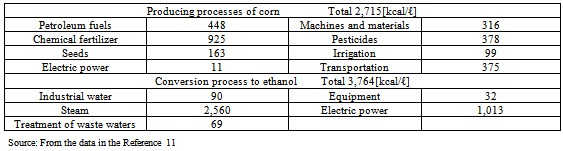
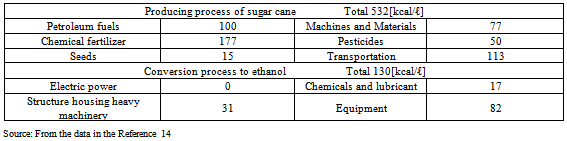
According to the literature provided in Tables 8 and 9, the amount of energy input into chemical fertilizers and pesticides required to grow corn in the U.S. accounted for 48% (calorie basis) of the total amount of energy input in material production. Regarding sugar cane grown in Brazil, the amount of energy input accounted for 42% (Fig. 1).These results show that the amount of energy input into chemical fertilizers and pesticides in material production is particularly large, which has a marked influence on CO2 emissions. In the production of corn in the U.S., the amount of energy input into chemical fertilizers and pesticides is almost six times larger, compared to sugarcane grown in Brazil.The CO2 reduction effects of sugarcane grown in Brazil are high. This is presumably because, in Brazil, they convert bagasse, a by-product produced during sugar processing, into electric power to supply all of the electricity required in ethanol production (according to a published document, no electricity is purchased from outside: refer to Table 9). This increases the energy balance ratio and reduces the CO2 emissions to minimum levels in ethanol production because the amount of energy input from outside is very small.Bio-ethanol is produced through the processes of fermentation, distillation, and dehydration; bio-ethanol production using cellulosic or starch materials requires glycation prior to fermentation. A large amount of energy is input in the dehydration process (Table 6). Half (51%) of the energy input to concentrate fermentation ethanol into dehydrated ethanol is consumed in the process of dehydration (azeotropic distillation). More than one quarter (27%) of the calorific value of one liter of ethanol, 5,067 [kcal/l] (Table 4), is consumed in the dehydration process. CO2 is mainly emitted when materials are produced using chemical fertilizers and pesticides as well as the process of dehydration in ethanol production, which consumes a large amount of fossil fuels.In the first place, the idea that if you used bio-ethanol instead of gasoline, you would reduce the amount of CO2 emissions equivalent to the quantity that could be produced from the gasoline that would have been used is believed based on the principle of carbon neutrality. However, only a small amount of CO2 emissions is actually reduced because fossil fuels are consumed and CO2 is subsequently emitted in the process of ethanol production. For these reasons, bio-ethanol has not yet exerted its expected effects. I have to question the government’s policy with an emphasis on bio-ethanol for the “prevention of global warming” - the principal purpose of the “Biomass Nippon Strategy".
4. Conclusions
Currently, the efficacy of bio-ethanol as an environmental measure is supported by the principle of carbon neutrality adopted by the government. However, in previous assessment studies, the amount of CO2 emitted in the process of bio-ethanol production was not included in reduced CO2 emissions. The present study aimed to examine the effects of bio-ethanol by conducting the quantitative assessment of a net reduction in CO2 emissions.As the results show, the energy balance ratios of various types of bio-ethanol were significantly low because a massive amount of energy is required to produce them, i.e., bio-ethanol production consumes fossil fuels in a large quantity and emits a large volume of CO2. This means that the use of bio-ethanol does not effectively reduce CO2 emissions, as it stands now. Using bio-ethanol varieties made from corn or wood grown in the U.S. (cellulosic materials) even increased CO2 emissions (CO2 reduction rate of zero or lower). It has been pointed out that the production and use of bio-ethanol was less cost-effective than other CO2 reduction measures. As a conclusion, in terms of both its effectiveness and economic efficiency, bio-ethanol cannot be an alternative fuel used to promote Japan’s “Biomass Nippon Strategy” and accomplish its primary goal, the “prevention of global warming”. One of the problems with Japan’s energy policy is that the amount of CO2 emitted in the process of bio-ethanol production is not included in the quantitative assessment of reduced CO2 emissions.The environmental measures that are currently being implemented are not necessarily effective. Although the sound of the term, “carbon neutral”, may deceive you, it is questionable whether bio-ethanol is really eco-friendly. Thorough evidence-based examinations are required to solve environmental problems, and you should avoid letting emotions interfere with your judgment. It is important for the government to evaluate the feasibility of plans and invest in cost-efficient and effective environmental protection measures.
References
| [1] | Japan Alcohol Association, Zukai Bio-ethanol Seizo Gijutsu, Kogyo Chosakai, Tokyo (2007), 15-25. |
| [2] | L. Luo, E. v. d. Voet, and G. Huppes, Renew. Sustain. Energ. Rev. 13, 1613 (2009). |
| [3] | Y. Moriguchi, J. Environ. Inform. Sci. 38, 63 (2009). |
| [4] | T. Hayashi, available online at:http://www.maff.go.jp/primaff/koho/seika/project/pdf/biofuel-1.pdf (accessed 27 June 2011). |
| [5] | K. Hedegaard, K. A. Thyo, and H. Wenzel, Environ. Sci. Tech. 42, 7992 (2008). |
| [6] | Bio-fuel Database in East Asia, available online at: http://www.asiabiomass.jp/biofuelDB/japan/index.htm (accessed 22 February 2012). |
| [7] | The Institute of Energy Economics, Japan, EDMC Handbook of Energy & Economic Statistics in Japan 2009, The Energy Conservation Center, Japan (2009). |
| [8] | M. Z. Jacobson, Energ. Environ. Sci. No.2, 148 (2009). |
| [9] | Agency for Natural Resources and Energy, FY2008 Annual Energy Report (Outline), available online at: http://www.enecho.meti.go.jp/english/report/outline.pdf (accessed 22 February 2012). |
| [10] | N. Tanaka, Kokusaiboeki to Toshi Summer, 68, 7 (2007). |
| [11] | D. Pimentel and T. W. Petzek, Nat. Resour. Res. 14(1), 65, 72 (2005). |
| [12] | H. Shapouri, J. A. Duffield, and M. Wang, Agricultural Economic Report, 814, 28 (2002). |
| [13] | D. Lorenz and D. Morris, available online at: http://www.carbohydrateeconomy.org/library/admin/uploadedfiles/How_Much_Energy_Does_it_Take_to_Make_a_Gallon_.html (accessed 27 June 2011) |
| [14] | Government of the State of Sao Paulo, Assessment of greenhouse gas emission in the production and use of fuel ethanol in Brazil, 37 (2004). |
| [15] | Y. Ohijiri, Zukai Bio-ethanol Saizennsenn, Kogyo Chosakai, Tokyo(2008) 28-36. |
| [16] | M. A. Santos, Energy Analysis of Crops Used for Producing Ethanol and CO2 Emissions (2002), available online at: http://www.ivig.coppe.ufrj.br/docs/alcofoen.pdf (accessed 27 June 2011). |
| [17] | Faculty of Engineering, Niigata University, Kagakukougakushiryou no page (2008), available online at: http;//chemeng.in.coocan.jp/memb/et.html (accessed 22 February 2012). |
 Abstract
 Reference
 Full-Text PDF
 Full-Text HTML