-
Paper Information
- Next Paper
- Previous Paper
- Paper Submission
-
Journal Information
- About This Journal
- Editorial Board
- Current Issue
- Archive
- Author Guidelines
- Contact Us
Resources and Environment
p-ISSN: 2163-2618 e-ISSN: 2163-2634
2012; 2(5): 216-227
doi: 10.5923/j.re.20120205.05
An Empirical Model to Estimate UV index in Some Upper Egypt Regions
 Abstract
 Reference
 Full-Text PDF
 Full-Text HTML
S. M. El Shazly , Kh. O. Kassem , A.A. Hassan , Eman F. EL-Nobi
Department of Physics, Faculty of Science, South Valley University, Qena, Egypt
Correspondence to: Kh. O. Kassem , Department of Physics, Faculty of Science, South Valley University, Qena, Egypt.
| Email: |  |
Copyright © 2012 Scientific & Academic Publishing. All Rights Reserved.
Empirical models to estimate the ultraviolet index (UVI) for all sky conditions in ten locations in Upper Egypt have been developed. Multiple linear regression technique has been used for linking each of the UVI as a dependent variable, and all of the declination (δ), cosine solar zenith angle at noon (cosSZAn), total ozone column (TOC) in DU, reflectivity (reflc) in % and aerosol index (AI) as independent variables. A dataset corresponding to the period (1978-1999) was used to develop the models and an independent dataset (year 2000) was used for validation purposes. The data set for each location, including erythemal ultraviolet (EUV) at noon in mW/m2 , (TOC) in DU, reflectivity (reflc) in % and (AI), was retrieved from Total Ozone Mapping Spectrometer (TOMS) remote sensing instrument. For all locations, the empirical models explain more than 93% of UVI variability due to changes in all independent variables. In addition, one single model for all the locations has been constructed. Model performance was determined for each location by calculating the mean bias error (MBE %) and the root mean square error (RMSE %). In addition, mean absolute error (MAE %), modelling efficiency (ME), modelling index (d), and t-statistics have been computed. The empirical model provides reliable forecast UVI in order to inform the public about the possible harmful effects of UV radiation over-exposure.
Keywords: An Empirical Model, Ultraviolet Index (UVI), Declination, Noon Solar Zenith Angle, Total Ozone Column, Reflectivity, Aerosol Index and Upper Egypt
Article Outline
1. Introduction
- In the last years, the UV Index (UVI) has been introduced as a useful vehicle to inform the public about the potentially harmful effects of the UV irradiation and it is directly calculated using erythemal ultraviolet (EUV) [26,30]. Long-term ground-based datasets have been utilized for detecting trends in EUV and for establishing its climatology [13], and references therein). In addition, radiative transfer (RT) and empirical methods are useful tools for estimating EUV where there are no measurements available.RT models describe the physical interaction between UV irradiation and the atmosphere. These models offer better accuracy in calculated UV irradiances than empirical models, but they need information about meteorological variables which are not commonly measured in ground-based stations. In contrast, empirical models are formulated by simple expressions with the available meteorological variables in each location as independent variables. This type of estimation methods have been broadly used for different goals such as: UVI forecast [4,17,29] estimation of total ozone column [5,27] and reconstruction of UV irradiation series [6, 9, 15, 21]. The independent variables introduced in the empirical model have to characterize the modulation of UV radiation through the atmosphere. In this direction, the most important factors influencing UV radiation reaching ground level are solar elevation, total ozone column, clouds and aerosols. Due to the complexity of the interaction between UV irradiation and the atmosphere, a great number of UV empirical models focus on the relationship between UV and a single factor such as: global solar radiation [7, 8, 10, 12, 23, 31], ozone [32, 33] and the optical air mass [11,18,20,22]. In contrast, few studies analyze the joint relationship between the UV irradiation and its main attenuation factors [4,14,16,17,19].The objective of this work is proposing empirical models for all-sky conditions in order to estimate the UVI at some Upper Egypt regions, using five independent variables which characterize the main atmospheric attenuation factors of the UV radiation. In addition, an empirical model for calculating UVI over all Upper Egypt regions will be presented.The studied locations in this paper are described in Sect. 2. Section 3 describes the satellite data followed by methodology and the proposal of the empirical model. Section 4 presents and discusses the results obtained in this work and, finally, Sect. 5 summarizes the main conclusions.
2. Description of The Studied Locations
- Upper Egypt is known as southern Egypt because it is upstream, closer to the source of the Nile, extends from the cataract boundaries of Aswan to the area south of Cairo. This work divided Upper Egypt to three geographical regions as western desert region, river Nile region and red sea region. The coordinate of the locations used for this study is presented in table (1) farther more figure (1). Western desert region, the New Valley Governorate, is one of the governorates in Egypt that covers about 376 km² in the Western Desert. In our study we select the most famous oases. Farafra is the second biggest depression by size and the smallest by population. El-Kharga is the largest of the oases in the Libyan Desert. It is located about 200 km to the west of the Nile valley, and is some 150 km long. It is the capital of New Valley Governorate. River Nile region, is including six governorates. In our study we selected four locations, as well as famous city Abu-Simbel. The locations from north to south are: El-Minya, which is located approximately 245 km south of Cairo on the western bank of the Nile River. Asyut, which is sandwiched between two mountain ranges of about 600m. Qena is a city in central Egypt, with an area of 1,800 km², situated on the east bank of the Nile in the southern part of Egypt. Aswan is stands on the east bank of the Nile at the first cataract and is a busy market and tourist centre. Abu-Simbel is a small town located on the Western Bank of Lake Nasser, a city in Nubia, about 290 km southwest of Aswan and only 50 km away from the southern borders with Sudan.In general, these cities lie within the subtropical region and its terrain is semi-desert. The climate is characterized by cold winter, and very hot but non-humid summer, a hot season from March to October and a cold season from November to February. During summertime, temperatures could reach 40oC and increasing southward, while winter sees temperatures drop to sub-zero levels at night. While hail or snow is extremely rare due to low precipitation averages, frost will occasionally form on cold winter nights. In addition, a phenomenon of the hot spring wind that blows across the all Egypt. The winds, known to Europeans as the Sirocco and to Egyptians as the Khamsin, usually arrive in April. The Red Sea is one of the coastal governorates that locate between the Nile and the Red Sea in the southeast of the country and its southern border forms part of Egypt's border with Sudan. In our study we select the most famous city. Hurghada is second largest city (after Suez) located on the Red Sea coast. Qusair is located 205 km south of Hurghada, 103 km north of Marsa Alam. Shalatein is the southern most village on Egypt's Red Sea Coast, marks the administrative boundary between Egypt and Sudan. It is located 240 km south of Marsa Alam. The Red Sea governorate has a subtropical-desert climate, with mild-warm winters and hot to very hot summers. Temperatures in the period December, January and February is moderate warm, while November, March and April comfortable warm. May and October is hot and the period from June to September is very hot. Sunshine hours are average 9 hours of day in December to average 13 hours in July. Average annual temperature of sea is 24°C, from 21°C in February and March to 28°C in August.
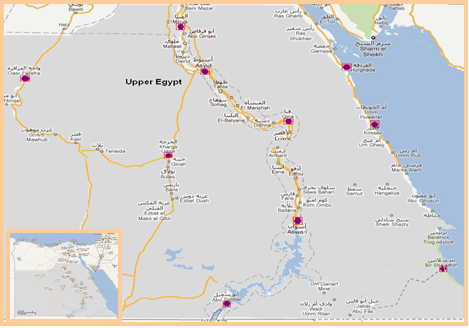 | Figure 1. Map of Egypt, illustrate the studied locations (gray area) |
3. Description of Data
- EUV at noon in mW/m2 , total ozone column (TOC) in DU, reflectivity (reflc) in % and aerosol index (AI) from Total Ozone Mapping Spectrometer (TOMS) remote sensing instrument were used, (http://toms.gsfc.nasa.gov). The TOMS remote sensor has been operative on board two satellites: Nimbus-7 (1978–1993) [1] and Earth Probe (EP) (1996–2000) [2]. This satellite instrument measures the backward-scattered Earth solar radiance. The TOMS' data have a daily global coverage over 1° x 1.25° (latitude by longitude) grids. The TOMS’ instruments provide one measurement per day near local noon. For more detailed descriptions of the different sources of uncertainty the reader is referred to [24, 26].
3.1. Erythemal Ultraviolet (EUV)
- The erythemal exposure data product is an estimate of the daily integrated UV irradiance, calculated using a model for the susceptibility of Caucasian skin to sunburn (erythema) [3].The Erythemal exposure is defined by the integral
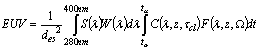 | (1) |
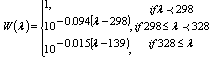 | (2) |
3.2. Total Ozone Column (TOC)
- A radiative transfer model is used to calculate back scattered radiance as a function of total ozone, latitude, viewing geometry, and reflecting surface conditions. Ozone can then be derived by comparing measured radiance with theoretical radiance calculated for the conditions of the measurement and finding the value of ozone that gives a computed radiance equal to the measured radiance [24, 26].
3.3. Reflectivity (reflc)
- Reflectivity is determined from the measurements at 360 nm. For a given TOMS measurement, the first step is to determine calculated radiance at 360 nm for reflection off the ground and reflection from cloud, based on the tables of calculated 360-nm radiance. For reflection from the ground, the terrain height pressure is used, and the reflectivity is assumed to be 0.08. For cloud radiance, a pressure corresponding to the cloud height from the International Satellite Cloud Climatology Project (ISCCP) based climatology is used, and the reflectivity is assumed to be 0.80 [24, 26]. The ground radiance Iground and cloud radiance Icloud are then compared with the measured radiance Imeasured. If Iground ≤ Imeasured ≤ Icloud, and snow/ice is assumed not to be present, an effective cloud fraction f is derived using
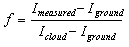 | (3) |
3.4. Aerosol Index (AI)
- The TOMS technique of aerosol detection and characterization is based on spectral contrast in the UV that results from the interaction between the processes of Rayleigh scattering, particle scattering and absorption. This interaction produces spectral variations of the back scattered radiance at the top of the atmosphere that can be used to separate aerosol absorption from scattering effects discuss in detail the physical basis of the near UV technique of aerosol sensing [25]. The TOMS aerosol index is a measure of how much the wavelength (λ) dependence of back scattered UV radiation from an atmosphere containing aerosols (Mie scattering, Rayleigh scattering, and absorption) differs from that of a pure molecular atmosphere (pure Rayleigh scattering). AI for TOMS is defined as:
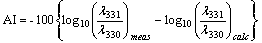 | (4) |
4. Results and Discussion
4.1. Empirical UVIsat Models in Some Upper Egypt Locations
- Empirical models to estimate the ultraviolet index (UVI) for all sky conditions in the studied locations in Upper Egypt have been developed. These models propose a multiple linear regression with the UVI as a dependent variable, and the declination (δ), cosine solar zenith angle at noon (cosSZAn), total ozone column (TOC) in DU, reflectivity (reflc) in % and aerosol index (AI) as independent variables. A dataset corresponding to the period (November 1978- December 1999) was used to develop the models. The general form of the suggested models is:
 | (5) |
4.1.1. Models Constructions and Performance
- Models coefficients and statistical analysis for Eq. (5) for different locations are presented in Tables (2). in view of the high values of the R2 and F-statistics compared to its critical values, all these models can compute the daily UVI value at noon with a good accuracy. Also the t-ratio for each coefficient has values greater than zero, reflecting the significance of their great contribution and high certainty to the fitting process. It is obvious that there is general similarly of the deduced equations, for all locations, with respect to the parameter's values and signs.
| ||||||||||||||||||||||||||||||||||||||||||||||||||||||||||||||||||||||||||||||||||||||||||||||||||||||||||||||||||||||||||||||||||||||||||||||||||||||||||||||||||||||||||||||||||||||||||||||||||||||||||||||||||||||||||||||||||||||||||||||||||||||||||||||||||||||||||||||||||||||||
4.1.2. Models Validation
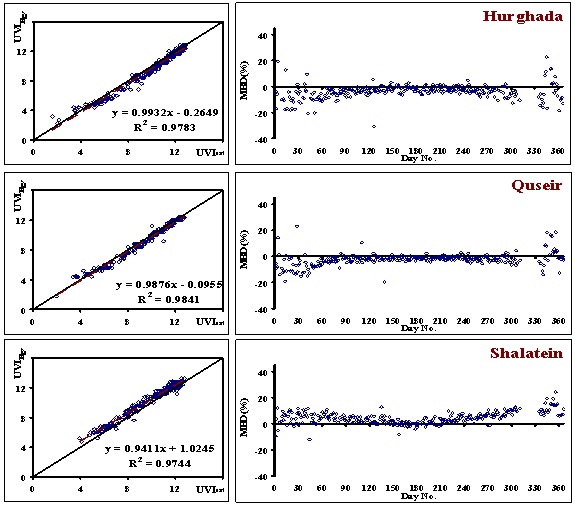
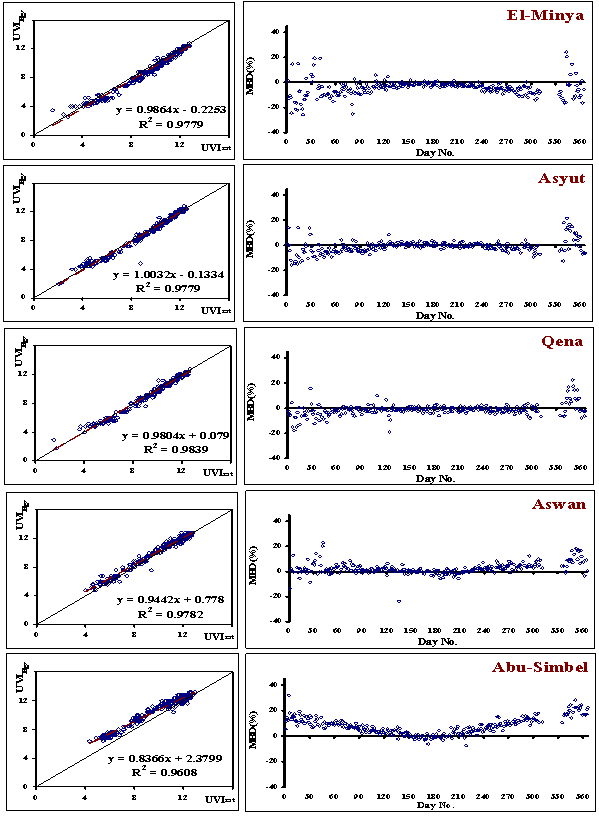
- To verify whether the models, allow a reliable estimate of UVI, Mean Bais Deviation (MBD) in % of the estimated values (UVIest) from the measured ones (UVIsat) for a new period (year 2000) are computed, ideally a zero of MBD should be obtain[35]. MBD is an indication of the average deviation of the estimated value from the measured value, if n is the number of observations, MBD is defined by:
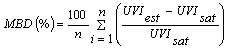 | (6) |
| ||||||||||||||||||||||||||||||||||||||||||||||||||||||||||||||||||||||||||||||||||||||
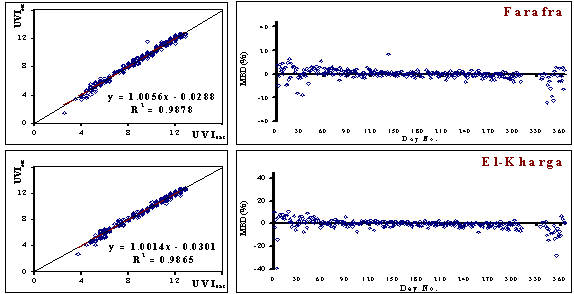 | Figure 2. Comparison between the values of UVIest and UVIsat in the left as well as MBD (%) in the right (west desert region) |
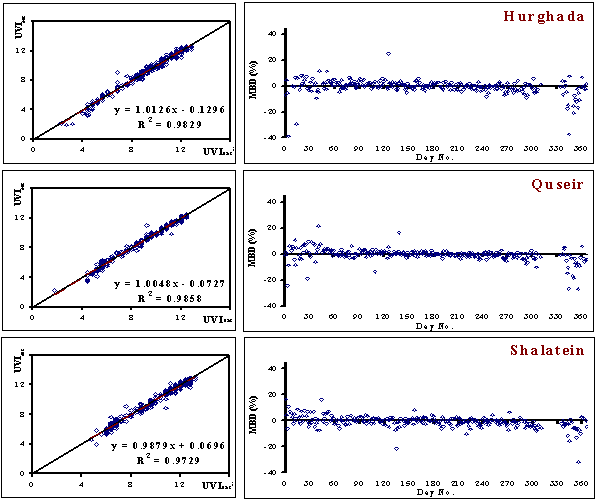 | Figure 3. Comparison between the values of UVIest and UVIsat in the left as well as MBD (%) in the right (red sea region) |
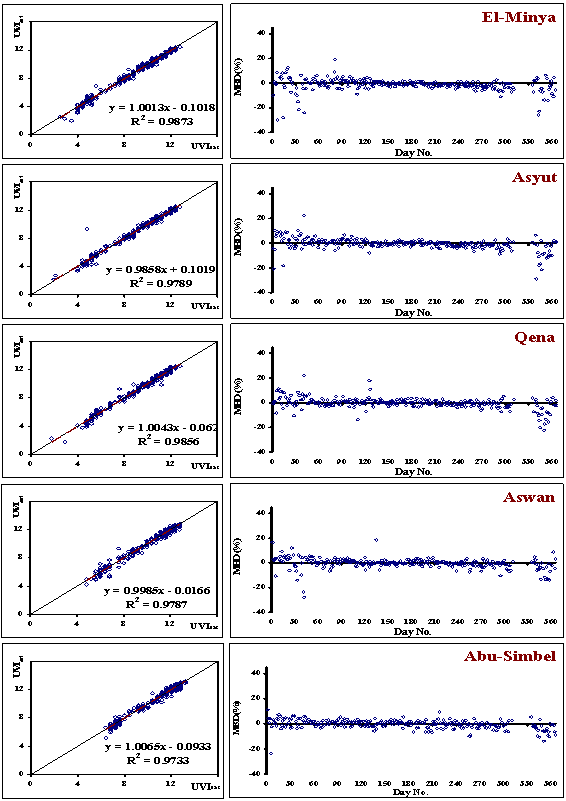 | Figure 4. Comparison between the values of UVIest and UVIsat in the left as well as MBD (%) in the right (river Nile region) |
4.2. General UVIsat Empirical Model in Upper Egypt
- An empirical model to estimate UVI for all sky conditions in Upper Egypt has been developed for the same period. The model takes the form:
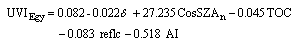 | (7) |
4.2.1. Model Performance
- Statistical analysis of the formula (5) has been studied, summerized in table (4). In view of the high values of the R2 ( 96.3 %) and F-statistics (289380) compared to its critical value (54917), formula (7) for Upper Egypt can compute the daily UVIEgy at noon with good accuracy. Also the t-ratio for each coefficient has values greater than zero, reflecting the significance of their great contribution and high certainty to the fitting process.
| |||||||||||||||||||||||||||||||||||
4.2.2. Model Validation
- To verify whether the obtained relationship (7), allows a reliable estimate of UVIEgy, Mean Bais Deviation (MBD) In % of its estimate values (UVIEgy) from the measured ones (UVIsat) for a new period (year 2000) are computed, according to Eq (5), The results were given in figure (5), the most points in this figure lie in the range of MBD less than ±10 % while little ones lie in the range from ±10% to ±20%, indicating the accuracy of the calculation in the most days of the year in all studied locations. These results support the accuracy of the calculation. Also, it can be observed from this figure that there is a very strong correlation between the estimated (UVIEgy) and measured (UVIsat) values of ultraviolet index (0.99). From this figure, it was found agreement between the UVIEgy value and the observation one UVIsat, these agreements were checked statistically. Statistical treatment with the aim of supporting the validity of the used model in calculating UVI in the new period has been done by calculating the statistical errors. The RMSE value (0.4919) and MAE value (0.3683) show that the simulations overestimate the measurements. The model achieved an acceptable level of accuracy; since the MBE (0.0525).The model achieved better performance; since the smaller values of t-statistic (6.657), ME (0.964) and d (0.99) were close to 1 in all studied locations.
5. Conclusions
- The objective of this work is to propose an empirical model for all sky conditions in order to estimate the UVIsat at some Upper Egypt regions. In addition, analyzes the use of the empirical model for reporting UVI over Upper Egypt. This model proposes a multiple linear regression with the UVIsat as a dependent variable, and the declination (δ), cosine solar zenith angle at noon (cosSZAn), total ozone column (TOC) in DU, reflectivity (reflc) in % and aerosol index (AI) as independent variables which characterize the main atmospheric attenuation factors of the UV radiation. A dataset corresponding to the period (1978-1999) was used to develop the model and an independent dataset (year 2000) was used for validation purposes. Statistical treatment with the aim of supporting the validity of the used model in calculating UVI in the new period has been done by calculating the following parameters: the mean bias error (MBE) and the root mean square error (RMSE), which measure systematic and nonsystematic error, respectively. Since the (MBE) cancel significant positive and negative biases, the mean absolute error (MAE), modeling efficiency (ME), modeling index (d), and t-statistics. The following points are summarized:The RMSE values show that the simulations overestimate the measurements by a value vary from 0.282 to 0.303, from 0.310 to 0.395 and from 0.306 to 0.373 at western desert region, river Nile region and red sea region respectively.The MAE values show that the simulations overestimate the measurements by a value vary from 0.214 to 0.233, from 0.221 to 0.256 and from 0.217 to 0.274 at western desert region, river Nile region and red sea region respectively. The model achieved an acceptable level of accuracy; since the MBE vary from -0.017 to 0.058, from -0.090 to -0.021 and from -0.010 to 0.048 at western desert region, river Nile region and red sea region respectively.The model achieved better performance; since the smaller value of t-statistic, ME and d values were closer to 1 in all studied locations. For Upper Egypt, it was found agreement between the UVIEgy value and the observation one UVIsat, these agreements were checked statistically. The RMSE value (0.4919) and MAE value (0.3683) shows that the simulations overestimate the measurements. The model achieved an acceptable level of accuracy; since the MBE (0.0525).The model achieved better performance; since the smaller value of t-statistic (6.657), ME (0.964) and d (0.99) values were closer to 1 in all studied locations.
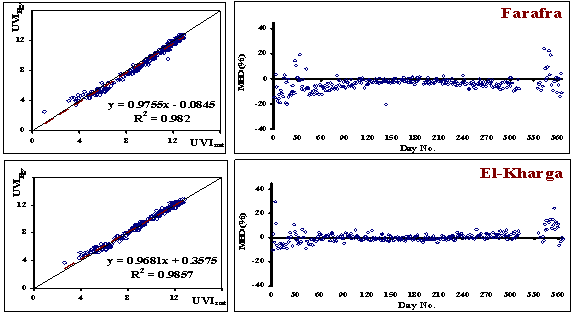 | Figure 5. Comparison between the values of UVIEgy and UVIsat in the left as well as MBD (%) in the right (west desert region) |
 | Figure 6. Comparison between the values of UVIEgy and UVIsat in the left as well as MBD (%) in the right (red sea region) |
 | Figure 7. Comparison between the values of UVIEgy and UVIsat in the left as well as MBD (%) in the right (river Nile region) |
References
| [1] | Online Available at: fttp://toms.gsfc.nasa.gov/pub/nimbs7 /data/ |
| [2] | Online Available at: fttp://toms.gsfc.nasa.gov/pub/eptoms /data/ |
| [3] | Online Available at: fttp://toms.gsfc.nasa.gov/pub/eptoms /data/erynotes.pdf |
| [4] | Foyo-Moreno, I., Alados, I., and Alados-Arboledas, L., Adaptation of an empirical model for erythemal ultraviolet irradiance., Ann. Geophys., 25, 1499–1508, 2007. |
| [5] | Kerr, J. B. and Davis, J. M., New methodology applied to deriving total ozone and other atmospheric variables from global irradiance spectra., J. Geophys. Res., 112, 2007. |
| [6] | Eerme, K.., Veismann, U., and Lätt, S., "Proxy-based reconstruction of erythemal UV doses over Estonia for 1955–2004", Ann. Geophys., 24, 1767–1782, 2006. |
| [7] | El-Nobi Eman, F., "Surface ultraviolet radiation measurements in Qena / Upper Egypt". M.Sc., South Valley University, 2006. |
| [8] | Den Outer, P. N., Slaper, H., and Tax, R. B. , "UV radiation in the Netherlands: Assessing long-term variability and trends in relation to ozone and clouds", J. Geophys. Res., 110, 2005. |
| [9] | Lindfors, A. and Vuilleumier, L., "Erythemal UV at Davos (Switzerland), 1926–2003, estimated using total ozone, sunshine duration, and snow depth", J. Geophys. Res., 110, 2005: |
| [10] | Robaa, S. M., "A study of ultraviolet solar radiation at Cairo urban area", Egypt Solar Energy, 77, 251-259. 2004: |
| [11] | Murillo, W., Cañada, J., and Pedrñs, G., "Correlation between global ultraviolet (290–385nm) and global irradiation in Valencia and Córdoba (Spain) ", Renew. Energy, 28, 409–418, 2003. |
| [12] | Ramírez, L., Polo, J., Mora, L., Sidrach, M., and Blanco, J., "Fuzzy inference system applied to the daily ultraviolet radiation evaluation (295-385 nm) from daily global radiation", Sol. Energy, 75, 447–454, 2003. |
| [13] | WMO (World Meteorological Organization), "Scientific assessment of ozone depletion: 2002", global ozone research and monitoring project, Technical Report 47, 2003. |
| [14] | De La Casinière, A., Toure, M., Masserot, D., Cabot, T., and Pinedo, J. L. , "Daily doses of biologically active UV radiation retrieved from commonly available parameters", Photochem. Photobiol., 76, 171–175, 2002. |
| [15] | Fioletov, V.E., Kerr, J.B., Wardle, D.I., Krotkov, N. and Herman, J.R., "Comparison of Brewer ultraviolet irradiance measurements with Total Ozone Mapping Spectrometer satellite retrievals", Opt. Eng., 41, 3051-3061, 2002. |
| [16] | Fioletov, V. E., McArthur, L. B. J., Kerr, J. B., and Wardle, D. I., "Long term variations of UV-B irradiance over Canada estimated from Brewer observations and derived from ozone and pyranometer measurements", J. Geophys. Res., 106, 2309–2307, 2001. |
| [17] | Krzyścin, J. W., lawski, J. J. and Sobolewski, P., "On an improvement of UV index forecast: UV index diagnosis and forecast for Belsk, Poland, in Spring/Summer 1999", Journal of Atmospheric and Solar-Terrestrial Physics, 63, 1593–1600, 2001. |
| [18] | Cañada, J., Pedrós, G., López, A., and Boscá, J., "Influences of the clearness index for the whole spectrum and of the relative optical air mass on UV solar irradiance for two locations in the Mediterranean area, Valencia and Córdoba", J. Geophys. Res., 105, 4799– 4766, 2000. |
| [19] | Diaz, S., Deferrari, G., Martinioni, D., and Olberto, A., "Regression analysis of biologically effective integrated irradiances versus ozone, cloud and geometric factors", J. Atmos. Sol. Terr. Phys., 62, 629–638, 2000. |
| [20] | Dubrovsky, M., "Analysis,of UV-B irradiances measured simultaneously at two stations in the Czech Republic", J. Geophys. Res., 105, 4907–4913, 2000. |
| [21] | Gantner, L., Winkler, P., and Kohler, UA, "method to derive long-term time series and trends of UV-B radiation (1968–1997) from observations at Hohenpeissenberg (Bavaria) ", J. Geophys. Res., 27, 4879–4888, 2000. |
| [22] | Foyo-Moreno, I., Vida, J., and Alados-Arboledas, L., "A simple all weather model to estimate ultraviolet solar radiation (290– 385nm) ", J. Appl. Meteorol., 38, 1020–1026, 1999. |
| [23] | Martínez-Lozano, J. A., Tena, F., and Utrillas, M. P. , "Ratio of UV to Global broad band irradiation in Valencia", Spain, Int. J. Climatol., 19, 903–911. 1999: |
| [24] | McPeters Richard, D., Bhartia, P. K., Krueger Arlin, J., and Herman Jay, R., "Earth Probe Total Ozone Mapping Spectrometer (TOMS) Data Products User's Guide", 1998. |
| [25] | Torres, O., Bhartia, P.K., Herman, J.R., et al., "Derivation of aerosol properties from satellite measurements of backscattered ultraviolet radiation: theoretical basis". Journal of Geophysical Research, 103, 17,099–17,110, 1998. |
| [26] | WMO (World Meteorological Organization), "Report of the WMO-WHO meeting of experts on standardization of UV indices and their dissemination to the public", Technical Report 127, WMO/Global Atmosphere Watch, 1998. |
| [27] | Fioletov, V.E., Kerr, J.B., and Wardle, D.I., "The relationship between total ozone and spectral UV irradiance from Brewer observations and its use for derivation of total ozone from UV measurements", Geophys. Res. Lett., 24, 2997-3000, 1997. |
| [28] | McPeters Richard, D., Bhartia, P. K., Krueger Arlin, J., and Herman Jay, R., "Nimbus–7 Total Ozone Mapping Spectrometer (TOMS) Data Products User's Guide", 1996. |
| [29] | Burrows, W. R., Vallee, M., Wardle, D. I., Kerr, J. B., Wilson, L. J., and Tarasick, D. W., "The Canadian operational procedure for forecasting total ozone and UV radiation", Meteorol. Appl. 1, 247–265, 1994. |
| [30] | WMO (World Meteorological Organization), "Report of the WMO meeting of experts on UV-B measurements data quality and standardization of UV indices", WMO Rep. 95, Les Diablerets, Switzerland, 1994. |
| [31] | Feister, U. and Grasnick, K. H., "Solar UV radiation measurements at Postdam (52°22′ N, 13°5′ E)", Sol. Energy, 49, 431–544, 1992. |
| [32] | Madronich, S., "Implications of recent total atmospheric ozone measurements for biologically active ultraviolet radiation reaching the earth surface", Geophys. Res. Lett., 19, 37–40, 1992. |
| [33] | McKenzie, E. L., Matheus, W. A., and Johnson, P. V. , "The relationship between erythemal UV and ozone, derived from spectral irradiance measurements", Geophys. Res. Lett., 18(12), 2269–2272, 1991. |
| [34] | McKinlay, A.F. and Diffey, B.L., "A reference spectrum for ultraviolet induced erythema in human skin, in Human Exposure to Ultraviolet Radiation: Risks and Regulations", edited by W.R. Passchler and B.F.M. Bosnajokovic, Elsevier, Amsterdam. ,1987 |
| [35] | Willmott, C. J., "Some comments on the evaluation of model performance", Bull. Am. Meteor. Soc., 64:1309-1313, 1982. |