-
Paper Information
- Next Paper
- Previous Paper
- Paper Submission
-
Journal Information
- About This Journal
- Editorial Board
- Current Issue
- Archive
- Author Guidelines
- Contact Us
Resources and Environment
p-ISSN: 2163-2618 e-ISSN: 2163-2634
2012; 2(5): 185-192
doi: 10.5923/j.re.20120205.02
Energy and Environmental Aptitude (EEA) to Assess Solar Energy Exploitation in Cities
 Abstract
 Reference
 Full-Text PDF
 Full-Text HTML
Graciela Melisa Viegas , Gustavo Alberto San Juan
IIPAC (Built Environment Policy Research Institute). FAU (School of Architecture and Planning). UNLP (National University of La Plata). La Plata. Street 47 N °162, DC 478. (1900), Argentina
Correspondence to: Graciela Melisa Viegas , IIPAC (Built Environment Policy Research Institute). FAU (School of Architecture and Planning). UNLP (National University of La Plata). La Plata. Street 47 N °162, DC 478. (1900), Argentina.
| Email: |  |
Copyright © 2012 Scientific & Academic Publishing. All Rights Reserved.
In Argentina, the number of residential buildings (homes) has grown 20% in the last decade (2000-2010), thus increasing the level of non-renewable energy consumption of the residential area per inhabitant (0.25 TOE per capita per year in 2000, 0.3 TOE per capita per year in 2010) and lowering the construction quality. This situation has a significant impact on the GHG emissions to the environment. Within this context, this paper aims to assess the energy and environ- mental aptitude (EEA) of residential building groups in characteristic urban areas (urban mosaics), to estimate the potenti- ality of solar energy and energy efficiency exploitation. To begin with, the following urban area variables were calculated from aerial and satellite image classification techniques: i. Horizontal heat dissipation area; ii. Construction system of horizontal heat dissipation area – Roofs; iii. Vertical heat dissipation perimeter – Walls; iv. Built-up area height. Then, obtained results were exposed on two characteristic urban areas, differing in the compactness of its fabric, what allowed to evaluate that the urban area of greater compactness presented lower energy loss and similar EEA in relation to the urban area of lower compactness. This conclusion contributes to the discussion about the diffuse city and the compact city, since it reinforces the need to develop urban conglomerates with greater building compactness.
Keywords: Energy and Environmental Impact on Urban Areas, Urban Mosaics, Image Classification
Article Outline
1. Introduction
- Urban planning allows city council authorities to have a mid- and long-term vision since it influences the future de- velopment of cities. This is why it plays a key role in the creation of communities that lead this development to a more sustainable position between culture and nature.There are two key factors to consider for a sustainable urban planning: occupation and socio-territorial models and patterns, and urban energy services production (de- mand-supply), such as natural gas or electrical energy. They determine the economic and productive activities as well as mobility, production and building construction; conse- quently, they influence the volume of generated GHG emis- sions.As regards the urban occupation model, it is remarkable the role played by buildings as urban environment and not as individual technical objects. The reduction in energy con- sumption and current emissions will not be achieved unless the built-up area is considered as a whole; in particular, the existing built-up area has to be taken into account. However, the biggest efforts in the last years have been centered in the design of new efficient buildings while less attention hasbeen paid to the improvement of existing buildings and the infrastructure supporting them[1].As far as energy services are concerned, it is understood that the incorporation of solar origin renewable services (electric or thermal generation) implies a reduction in GHG emissions. In this respect, Rueda[2] stands out that it is fundamental to incorporate and sustain urban organization with renewable energies as basic resource to reduce impact over the atmosphere, understanding the city as an open sys- tem where energy planning is necessary[3]; he proposes to use them as an essential and applicable strategy to promote sustainable development[4].In Argentina, the growth of the residential buildings is still sustained (20% in the 2000-2010 decade according to data from the INDEC – National Institute of Statistics and Cen- suses, according to its acronym in Spanish)[5]. But this growth has been developed without incorporating an im- provement in the construction quality or other energy sources that allow energy savings given the current levels of consumption or interior comfort improvements. This is shown in the national energy balance[6] that presents –in the national energy matrix, non-renewable energy consumption levels in the residential sector (mainly natural gas, electrical energy and bottled gas) in the year 2000 of 0.25 TOE per capita per year, with an increase of 0.3 TOE per capita per year in 2010. It is then essential to improve this situation to avoid a greater impact on the environment and the depletion of the resources available. Now, how can we know the po- tentiality to exploit solar energy and improve energy effi- ciency in buildings?Given this situation, it is necessary to develop tools, such as energy models, for the decision-makers to help in the following aspects: (i) to manage quality improvements in the built-up environment; (ii) to determine where to invest resources to achieve greater benefits[7]; (iii) to accompany improvement processes of building energy and thermal quality with the modification of the current legislation. At present, most tools tend to consider the building as a sole entity and not from the urban scale perspective[8].Therefore, to further these aspects, it is necessary to study the relation between buildings and their energy and envi- ronmental aptitude (EEA) to use energy in a more efficient way or replace it with alternative sources. It will also be useful for the application in building massive recycling strategies, which have proved to be very successful in dif- ferent countries, getting at present up to 80% of energy savings with different technical-economic viability[10][1]. At methodological level, several research analyzing the urban block (urban fabric minimal unit that circumscribes buildings and that is limited by streets, also called four-sided square in chessboard layout) and the building envelope back up this development[11][12][13][14]. The EEA is analyzed with a methodology applied to urban mosaics previously developed[15].
1.1. Urban Mosaics
- Urban mosaics (UM) are characteristic areas which are representative of bigger ones. They have been studied by different disciplines, such as art, landscape ecology and sociology[16][17][18][19]; in this case, they strictly refer to the urban space, what poses the need to go into the morphological aspects for their classification using different variables and indicators (Figure 1). UMs main components are building units associated to recognizable building ty- pologies, located in parcels. Many of them will make up an urban block and they, in turn, associate among themselves through the public spaces of the streets, pavements and voids, at a particular distance. The disposition, characterization, shape and occupation of their components over the territory shape one kind of urban mosaic which is defined as a char- acteristic pattern[20].Its analysis and processing can be done in manual, semi-automatic or automatic way.In the manual procedure, there is qualified observation of aerial or satellite images and the survey of the areas is done in situ; then, the data collected is drawn in two and three dimensions (with CAD programs) to calculate size and shape of buildings. Finally, through direct observation, surveyed building units are assimilated to the study area historical records about recognizable building typologies. This pro- cedure is really time-consuming. {0>Ante esta situación, se observaron los avances desarrollados por la ecología del paisaje y por la teledetección.<}100{>Given this situation, the advances made by landscape ecology and remote sensing were considered.<0} {0>La primera, incorporó el análisis de la fotografía satelital y aérea, y el uso de los sistemas de información geográfica (SIG) que complementan bases gráficas y numéricas de distintas áreas extensas[21].<}94{>The former incorporates the analysis of satellite and aerial photography, and the use of geographic information systems (GIS) that complement graphic and numerical databases of extended areas[21].<0} {0>Por su parte, la teledetección en ámbitos urbanos sobre imágenes, permite numerosas aplicaciones que van desde estimación de la población, la cuantificación de cambios, la estimación de la densidad de edificación, la detección de asentamientos urbanos y rurales, en forma continuada y actualizada, lo que le confiere una indudable utilidad de cara a la gestión y planificación del desarrollo urbanístico[22].<}92{>The latter, in urban environments, has a lot of applications that range from population estimation to change quantification, building density estimation, and urban and rural detection in a continuous and updated way. This is why remote sensing is so useful for urban development planning and management.<0}
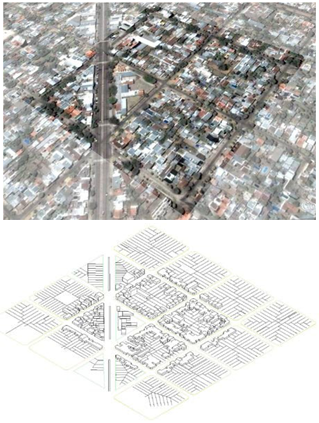 | Figure 1. Urban Mosaic: satellite image and simplified volumetry of the area |
2. Methodology
- Buildings are modelled in their exterior envelope by ap- plying segmentation techniques on urban images (details are omitted because volumetry influence exceeds the importance of details)[11]. In remote sensing, the image segmentation process is defined as the search for homogeneous regions in an image and the classification of these regions[19]. It al- lows to extract different types of characteristics from the outstanding objects. For this methodology, we are specifi- cally interested in the following characteristics –geometry (shape and size), localization (height, width, area, perimeter, shape factor, etc.), intensity and brightness of the region and neighbourhood. The different techniques are applied through the functions developed in the Image Processing Toolbox 7, MATLAB software type. For the analysis, digitalized ana- logical aerial images in scale 1:20,000[22] were used, as well as free access satellite images[23].
 | Figure 2. Volumetry of an urban block or square (urban fabric minimal unit circumscribing the buildings) with the delimitation of the analysis variables: horizontal heat dissipation area, construction system of the horizontal heat dissipation area, vertical heat dissipation perimeter, built-up area height |
2.1. Variable Calculation
2.1.1. Horizontal Heat Dissipation Area (HHDA)
- This variable is analyzed in four stages: i. thresholding segmentation on greyscale images; ii. morphological gradi- ents on the aforementioned resulting images; iii. labelling of each region on the previous image; iv. HHDA quantification. For stage i., the thresholding segmentation technique was applied (separating the objects of interest from the rest on the basis of pixel value) on digitalized analogical aerial images in greyscale in scale 1:20,000[24]. The image was segmented according to the histogram, given that the various objects of the image present different grey levels. From the histogram, a threshold was chosen since it is the point whose intensity separates, in this case, the pixels belonging to the buildings from the background (vegetation and land), with a threshold value 200. In the resulting image, the regions de- tected are very irregular, they are open o isolated little de- tections that can be deemed wrong since they do not belong to any building.For stage ii., the starting point is the resulting image where the regions are closed and the object structure is sim- plified by the application of morphological gradients (dila- tion and erosion). For this, an image sweep is performed with a 9x9 square structuring element in order to quantify the way it is confined, getting as a result a new image with the sim- plification of the objects making up the urban area in regular shapes. In this way, detections are more defined, even though small objects persist that have to be eliminated since they do not correspond to buildings.For stage iii., a labelling of each region was performed on the previous image, and those regions with a size lower than 20% of average size were eliminated. The result is a very well-defined image, with regular objects, very close to real- ity.For stage iv., binary objects are surveyed (build- ings-background) defining the HDA (white colour areas). The quantity of pixels making it up is quantified and it is turned into a metric system scale.Figure 3 shows the images resulting from i, ii, iii and iv.
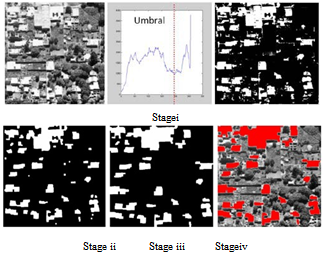 | Figure 3. From the original aerial image of an urban block, the succession of results of stage i (thresholding segmentation); ii (morphological gradients on previous resulting images), iii (labelling of each region of the previous image) and iv (resulting image to quantify the HHDA) |
 | Figure 4. Thresholding on colour satellite image to determine the construc- tive system of the horizontal area. Segmentation on the satellite image incorporating only one threshold (separating red colour of roofs from the rest) |
2.1.3. Vertical Dissipation Perimeter (VDP)
- The borders of an object in a greyscale image can be de- fined as the transitions between two regions with signifi- cantly different levels of grey. To delimit borders and measure buildings’ perimeter, the technique used is border detection from images resulting from the HHDA.Border detection was previously performed on the two types of HHDA resulting images used, greyscale aerial and colour satellite. It was observed that the results from the aerial image present greater regularity in the borders than in the satellite image; so the former was used. Results are observed in Figure 5.
 | Figure 5. From the result of HHDA, borders are detected to quantify the VPD. First image: result of Figure 3, stage iii. Second image: VDP of an aerial image. Third image: VDP of a satellite image for the very same urban block |
2.1.4. Built-up Area Height (BAH)
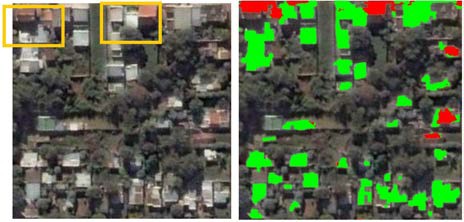
- The information about the height was obtained from the shadows shown by the shadows of the buildings. In this case, the thresholding segmentation technique and the morpho- logical gradients techniques were used on aerial images for shadow detection. An initial thresholding with a threshold value 67 made it possible to get a binary image with every type of shadow conveyed (from buildings, vegetation, common walls, or any other badly classified dark object).The next step was to eliminate those shadows of no use for this analysis by means of morphological operations. It was then necessary to have the following additional information: the binary images resulting from HHDA delimitation, and the sun position that could be determined by the operator. Then all those shadows conveyed by built-up areas were selected. For the case of this particular image (figure 6, third image), they were all those shadows (blue colour) which were below the built-up area (red colour). All the zones that did not correspond to this pattern were eliminated, that is vertical shadows corresponding to fences, common walls and the like.Then, the open irregular shadows were closed with a 5x5 rectangular structuring element with a dilation operation. Last, an image sweep is performed to eliminate shadows that did not correspond to any construction detected.In Figure 6, a succession of images combining the HHDA with its respective shadow conveyed is presented (useless shadows were eliminated).
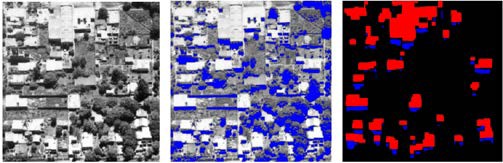 | Figure 6. Procedure to determine construction height, from left to right: original aerial image; buildings and vegetation shadows together; resulting image with the buildings (red colour) and the shadows conveyed by them (blue colour) |
2.2. EEA Indicator Calculation
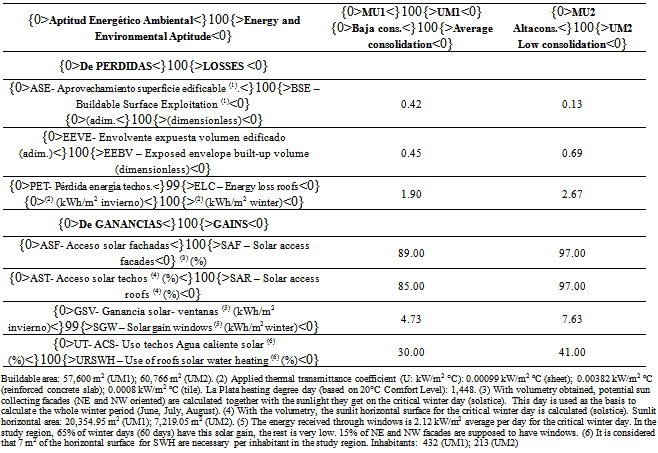
- Energy loss indicators are calculated in the following way:• Buildable surface exploitation (BSE): it indicates the proportion of land occupied with construction.BSE = built-up area (m2) / buildable area (m2)• Exposed envelope of built-up volume (EEBV): it indi- cates that to greater value, greater thermal loss due to the fact that there is more exposed envelope to the exterior in relation to the built-up volume.EEBV = exposed envelope (m2) / built-up volume (m3)• Energy loss through roofs per built m2 in winter period (ELR): product of HHDA multiplied by an average thermal transmittance coefficient (U in W/m2℃) of the closings making up said surface detected in the CSHHDA.ELR (kW m2 winter) = HHDA (m2) * U coefficient (kW/m2 ℃) * heating degree day (℃)) / built-up area (m2)Solar gain indicators are calculated in the following way:• Solar access in facades (SAF): it counts the sunny sur- faces of northeast and northwest facades, and front and rear-front of the UM blocks, and it compares them with the total surface of facades of each UM.SAF = sunny facade / total facade * 100• Solar access in roofs (SAR): it counts the sunny roof surface and compares it to the total roof surface of each UM.SAR = sunny roof surface / total roof surface * 100• Solar gain through windows per built m2 in winter period (SGW): Solar gains through windows surfaces percentage consider simple glass windows.SGW (kW m2 in winter) = energy gained through win- dows (kWh) / built-up area (m2)• Use of roof surface for solar water heating (%) (URSWH): considering only 50% of the roofs available, it indicates in a relative way the surface used to cover the hot water demand by the inhabitants of the UM.URSWH = necessary surface (m2) to produce SWH per inhabitant * total number of UM inhabitants / sunny roof surface available (m2) * 100
3. Case Study
- The methodology was applied on two urban mosaics in La Plata, Buenos Aires, Argentina.This city is located in the Northeast of Buenos Aires province, 60 km away from the City of Buenos Aires, -34°55’ latitude (South) and -57° 17’ longitude (West). Its total surface is 821 km2. Its height above sea level ranges between 0 and 15 meters, and it is geomorphologically characterized by the plain (Pampeana plain); it has temperate-humid cli- mate[24]. The city of La Plata was funded in 1882 as the capital of the province and built according to the layout of the urban engineer Pedro Benoit. It was materialized as a reflection of the hygienist urbanism of the end of the XIX century as regards street amplitude and wooded avenues, which ensured comfort, ventilation and cleanliness[25].Two sectors of the urban area were selected. They are both similar regarding: land use (mainly residential), regular urban layout (10 m frontage parcels) and orientation (NE-SW). The differences lay in the compactness of the urban fabric (the degree of compactness indicates the pre- dominance of built-up volumes over empty spaces), which is represented by the urban consolidation (see Figure 7). From this classification, it was calculated that average consolida- tion areas (20-40 homes per hectares) represent 17.30% (1332 hectares) of the urban area extension of La Plata with 154,091 inhabitants (116 inhabitants per hectare). Low consolidation areas (less than 20 homes per hectares) rep- resent 80.49% of the total (6,196 hectares), with a population of 377,107 inhabitants (65 inhabitants per hectare). High consolidation areas (more than 40 homes per hectare) rep- resenting around 2.2% of territorial extension are not con- sidered. This first diagnosis shows the disperse fabric char- acteristic of most areas in the city.
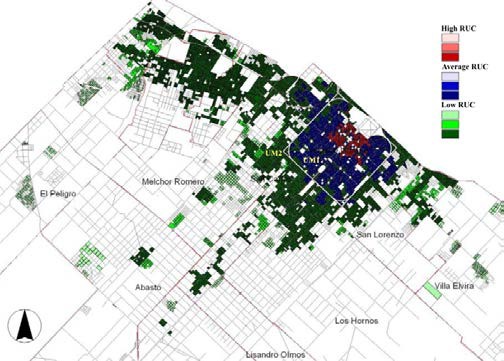 | Figure 7. La Plata divided according to residential urban consolidation (RUC). It concentrates the following variables: number of homes per hec- tare and the existence of basic infrastructure services, specifically natural gas. Delimitation in yellow of the urban areas to analize |
|
3.1. Energy and Environmental Aptitude Calculation
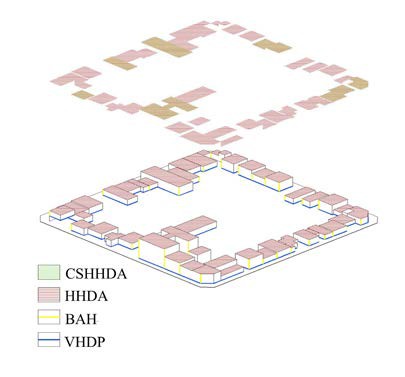
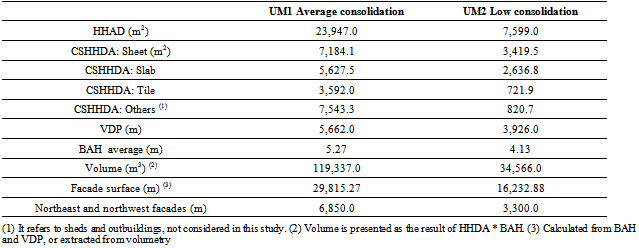
- In Table 1, the result of the variables calculated and of those resulting from the quantification of the urban sector volumetry (HHAD, CSHHDA, VDP, volume, facade surface) is observed. In Figure 8, volumetry is observed.From results in Table 1, Table 2 shows the calculus of EEA indicators for both areas.
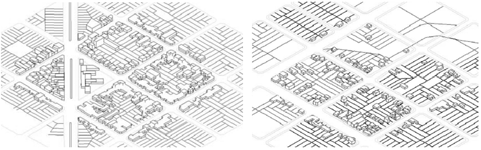 | Figure 8. Urban mosaics volumetry (UM1 and UM2) developed from the analysis variables |
4. Discussion
- From the EEA indicators applied to the two sectors, we can observe:• The average consolidation mosaic (UM1) has a higher BSE indicator (0.41) than the low consolidation mosaic (UM2) (0.12). This means that the buildable surface is used more efficiently in the former.• The average consolidation mosaic has a lower EEBV indicator (0.45) than the low consolidation one (0.69), which translates into fewer losses per envelope.• The average consolidation mosaic (UM1) has fewer losses through roofs (1.90 kW m2 winter) in comparison with the other mosaic (UM2) (2.67 kW m2 winter). This shows that the former has the best thermal quality of all the roof constructive systems.• Both mosaics present similar values in the SAF and SAR indicators (between 85% and 97%), which means that the solar obstruction degree due to self-portrayed shadow is not significant in either of them.• The average consolidation mosaic (UM2) has a lower SGW indicator (4.73 kW/m2 winter) in comparison with the low consolidation mosaic (UM1) (7.63 kW/ m2 winter). This evidences that the surfaces of potential sun collecting facades are proportionally bigger in the low consolidation mosaic.• Both mosaics present low URSWH indicators (30% and 40% in UM1 and UM2, respectively). This shows that roofs, as potential surfaces to incorporate solar water heaters, give the possibility to be also used for other applications, such as photovoltaic power generation.To sum up and to relate thermal loss indicators with thermal gain ones, we can conclude:• In comparison with the low consolidation mosaic (UM2), urban areas represented by the average con- solidation mosaic (UM1) present better exploitation of the buildable area, smaller exposed envelope area, fewer energy losses through roofs, similar percentages of solar blocking in facades and roofs, significantly lower solar gain through windows, and larger surface of available roofs to incorporate power generation solar systems.• Consequently, these urban areas represented by the UM2 have a better EEA for the exploitation of renewable energies.• Considering population and territorial extension of the areas studied, it is possible to conclude that 17% of the total territory of La Plata (home to 27% of the population) present better EEA indicators. Likewise, approximately 80% of the territorial extension has a lower EEA, even though there is better potential for energy gain exploitation due to the lower building compactness.
5. Conclusions
5.1. Instrumentation
- The results exposed show that semiautomatic object in- terpretation procedures are suitable for UM’s requirements.These procedures have simplified urban survey, minimized field study and reduced operator’s time. They significantly contribute to the improvement in the efficiency of the interpretation of urban areas, combining measuring speed with the operator’s interpretation ability.The application of this UM processing technique allowed to know the characteristics of both UMs and, with such in- formation, perform the spatial modelling and the shape and quantitative synthesis of its variables to calculate EEA in- dicators.As regards the images used for this work in particular, some considerations about the pros and cons of aerial and satellite photography. The advantage of aerial photography is its good spatial resolution and, consequently, good border definition. It also allows to know the date and time of the photo taking and thus estimate sun position. Within its disadvantages, we may say aerial photography has fallen into disuse due to its high costs –so the information surveyed becomes easily out of date, and the grey scale does not allow to positively spot the constructive system of the horizontal surfaces (roofs).On the other hand, satellite photography does allow to discriminate the constructive system of horizontal surfaces thanks to the existence of different color bands (RGB). However, as the images are made up of several takings (different dates and times), sun position cannot be determined. Moreover, free-access satellite images do not have appropriate spatial resolution and border definition, what leads to imprecise detections.
5.2. Energy Planning and Management
- By means of this methodology, areas can be evaluated to improve their energy and environmental conditions and to know those residential gatherings more appropriate to pro- mote more sustainable occupation models.Likewise, it allows to propose measures to improve en- ergy management in the city according to the potentialities of each sector.
5.3. Energy and Environmental Aptitude (EEA)
- As regards indicators devising, we can conclude that it has allowed us to establish the differences between both sectors and to elaborate conclusions for their improvement.Thanks to them, more sectors can be studied with the same methodology, broadening the knowledge of such a vast and complex area as the residential sector of the city is.Moreover, more specific indicators can be incorporated: energy loss through all the elements of the envelope (win- dows, floors, walls, and so on); gains from other energy generation sources, such as thermal storage walls, solar hot air collector, or photovoltaic systems, among others. They will be studied for future application.
ACKNOWLEDGEMENTS
- This research has been partly financed by the CONICET. Special thanks to Verónica Artola from the LIDI - UNLP[IT Reseach Institute - National University of La Plata, ac- cording to their acronyms in Spanish], at the first stage of subject approach. Special thanks to Agustina Gomez for her contribution in the translation of the text.
References
| [1] | G. Verbeeck, H. Hens, “Energy Savings in Retrofitted Dwel- lings: economically viable?”, Elsevier, Energy and Buildings, v. 37, n. 5, p. 747-754, 2005. |
| [2] | Online available: http://habitat.aq.upm.es/cs/p2/a009.html |
| [3] | Virgilio Vettini. Elementos de ecología urbana. Editorial Trotta, Madrid, España, 1998. |
| [4] | A. K. Athienitis, M. Santamouris, Thermal Analysis and Design of Passive Solar Buildings, The Cromwell Press, UK, 2002. |
| [5] | Online available:http://www.censo2010.indec.gov.ar/resultadosdefinitivos_tot alpais.asp |
| [6] | Online available:http://energia3.mecon.gov.ar/contenidos/verpagina.php?idpa gina=3366. |
| [7] | P. Jones, J. Patterson, S. Lannon, “Modelling the Built En- vironment at an Urban Scale: energy and health impacts in relation to housing”, Elsevier, Landscape and Urban Plan- ning, v. 83, n. 1, p. 39-49, 2007. |
| [8] | C. Ratti, N. Baker, K. Steemers, “Energy Consumption and Urban Texture”, Elsevier, Energy and Buildings, v. 37, n. 7, p. 762-776, 2005. |
| [9] | Online available: http://www.energieinstitut.at/Retrofit/ |
| [10] | Ana Belén Rodríguez González, Juan José Vinagre Díaz, Antonio J. Caamaño, Mark Richard Wilby, “Towards a uni- versal energy efficiency index for buildings”, Elsevier, Energy and Buildings, V. 37, n. 4, p 980-987, 2011. |
| [11] | C. Compagnon, “Solar and Daylight Availability in the Ur- ban Fabric”, Elsevier, Energy and Buildings, v. 36, n. 4, p. 321-328, 2004. |
| [12] | M. Arboit, A. Mesa, M. Basso, J. C. Fernández, C. De Rosa, “Morfología Urbana y Potencial Solar del Ambiente Cons- truido en Ciudades Andinas de Trazado Hispánico: avances en la evaluación de entornos de baja densidad del área me- tropolitana de Mendoza”, Inenco, Avances en Energías Re- novables y Medio Ambiente, v. 9, p. 55-60, 2005. |
| [13] | N. A. Mesa, C. De Rosa, “La dinámica del crecimiento ur- bano disperso, en ciudades de zonas áridas andinas. Evalua- ción del impacto energético ambiental”, Inenco, Avances en Energías Renovables y Medio Ambiente, v. 10, 2006. |
| [14] | Robinson Darren, Computer modelling for sustainable urban design. Physical Principles, Methods and Applications, Edi- torial Earthscan. Londres, UK.G., 2011. |
| [15] | Viegas, “Evaluación del Potencial Energético e Intervencio- nes de Mejoramiento del Entorno Edilicio en Áreas Urbanas de Media y Baja Consolidación: la ciudad de La Plata como caso de estudio”, Tesis de Doctorado en Ciencias-área energías renovables, Universidad Nacional de Salta, Argen- tina, 2010. |
| [16] | Duncan Timms. El mosaico Urbano: hacia una teoría de la diferenciación residencial. Editorial IEAL, Madrid, 1976. |
| [17] | R. T. T. Forman. Mosaico Territorial para la Región Metro- politana de Barcelona, Editorial Gustavo Gili, España, 2004. |
| [18] | Diputación De Barcelona. Sistema Municipal de Indicadores de Sostenibilidad. Edita: Diputación de Barcelona, España, 1996. |
| [19] | Elio R. Di Bernardo, “Mosaico Interconectado de Naturaleza: una manera de restituir la dimensión natural en las áreas me- tropolitanas”, Revista A&P, n. 11, p. 4-7, 1996. |
| [20] | G. Viegas, “Desarrollo metodológico a partir de mosaicos urbanos para evaluar la eficiencia energética y el aprove- chamiento de la energía solar en el marco de la sustentabili- dad urbana”, Antac, Ambiente Construido, v. 11, n. 2, p. 139-155, 2011. |
| [21] | Silvia D. Matteucci, Jorge Morello, Andrea F. Rodriguez, Nora E. Mendoza. El Alto Paraná Encajonado Argenti- no-Paraguayo: mosaicos de paisaje y conservación regional. Ediciones FADU, Argentina, 2004. |
| [22] | Ministerio de Infraestructura, Subsecretaria de Obras Públicas, Departamento Fotogramétrico, provincia de Bue- nos Aires, Argentina, 1998. |
| [23] | Online available:http://www.google.com/intl/es/earth/explore/products/deskto p.html. |
| [24] | Martín Hurtado, Jorge Gimenez, Mirta Cabral. Análisis Am- biental del Partido de La Plata: Aportes al Ordenamiento Te- rritorial. Instituto de Geomorfología y Suelos. Centro de In- vestigaciones de Suelos y Aguas de uso agropecuario CISAGUA-. Municipalidad de La Plata., 1º Edición, Editor: Buenos Aires- Consejo Federal de Inversiones, Argentina, 2006. |
| [25] | Alberto S.J. De Paula. La Ciudad de La Plata, sus tierras y su arquitectura. Ediciones del Banco de la Provincia de Buenos Aires, Argentina, 1987. |