Edward Ching-Ruey LUO
Department of Civil Engineering, National Chi-Nan University, Nanto County, 545, Taiwan
Correspondence to: Edward Ching-Ruey LUO , Department of Civil Engineering, National Chi-Nan University, Nanto County, 545, Taiwan.
| Email: |  |
Copyright © 2012 Scientific & Academic Publishing. All Rights Reserved.
Abstract
In order to achieve the purposes of environmental protection, such as flood control, sustainable development on water utilization and increasing of water demand with the decreasing of conservative water resources, to find new supplementary water resources and effective utilization those resource becomes a very significant topic. Rainwater, which is caught by reservoir at upstream while flowing down into sea through the middle or downstream, a best blessed gift and it has no water right problem without falling down the ground. Considering from the view point of environmental, economic, and social impacts, the utilization on water harvesting and flood mitigation with the benefit-cost ratio analysis and the effective function of gutter snipe design keeping water clean evoke us to study in paying much attention. In this study, high B/C ratio and wide application are presented.
Keywords:
Flood Mitigation, Water Harvesting, B/C Ratio, Water Right, Gutter Snipe, Sustainable Development
1. Introduction
The damage from rainwater flood with its quantity and intensity,[1],[2],[3],[4], and[5] with pictures 1 and 2, and the essential necessity from its effective use,[6] with pictures 3, 4, and 5, always make us confuse. The detailanalysis of a given rainwater cistern-supply system (RWCS), with pictures 6, 7 and 8, will affect the economic efficiency. The resultant gutter snipe design (RGSD) will determine the water quantity for utilization, and this magnitude depends on the flow situation, laminar or turbulent, so eventually. In this study, flood routing and analysis, rainwater cistern-supply system construction from a given catchment system, and characteristics and design criteria of gutter snipe will be the main issues for discussion and application.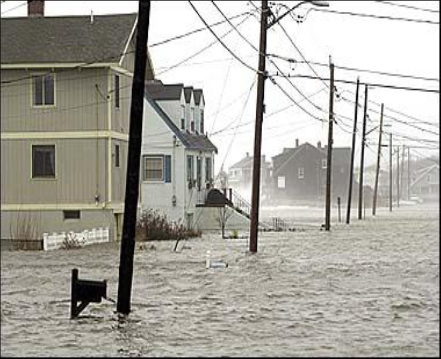 | Picture 1. Natural Storm Hazard |
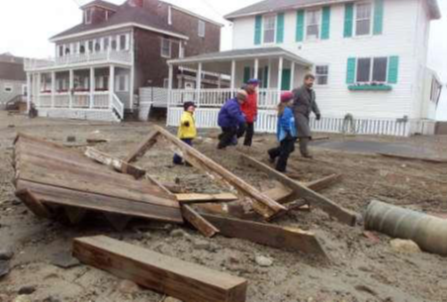 | Picture 2. Damage after Storm Hazard |
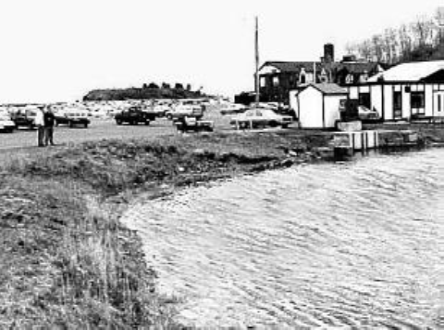 | Picture 3. Pond Drainage |
 | Picture 4. Pumping Station |
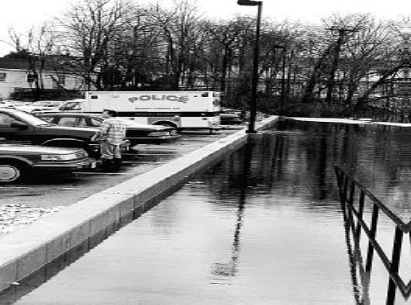 | Picture 5. Flood Protection |
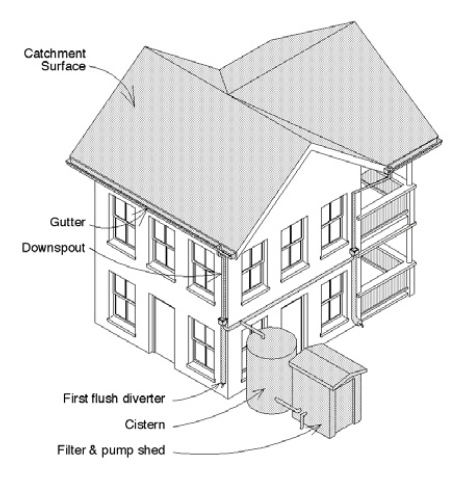 | Picture 6. Typical rainwater harvesting installation |
2. Flood Routing and Analysis
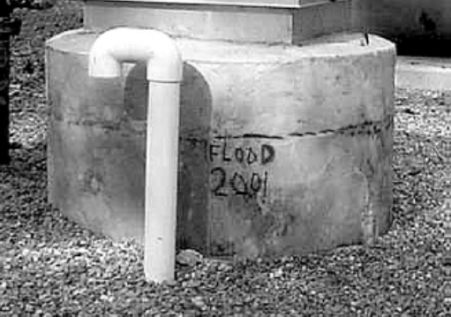
In order to have the plan of flood-control for natural hazard mitigation, the following steps are made: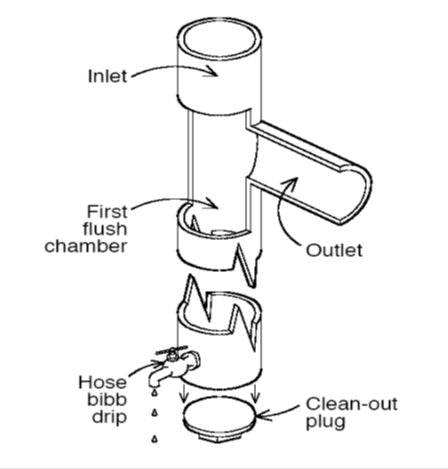 | Picture 7. Standpipe first-flush diverter |
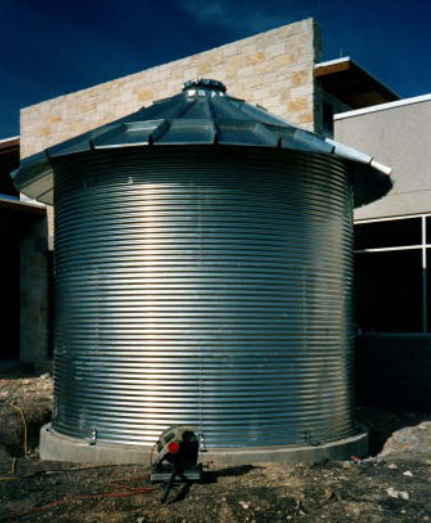 | Picture 8. Galvanized sheet metal tanks |
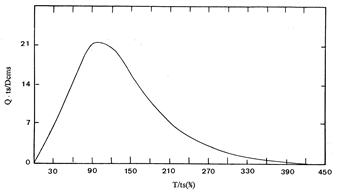
2.1. Mean Dimensionless Curve (MDC)
First, the MDC is obtained by using the flood-time discharge associated with the simultaneous mean rainfall of a given river catchment. The MDC is shown in Figure 1.
2.2. Unit Hydrograph of Discharge (UHD)
From the MDC in Figure 1, the UHD is formed with a given time lag, said 3.56hrs, and the unit time 1.0hr, andassumed rainfall time duration 4.06hrs (the time lag plus half of the unit time), and is presented in Figure 3.
2.3. Analysing Maximum 48hrs Stormy Rainfall(AMSR)
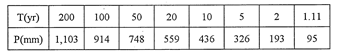
Collecting the annual maximum 48hrs rainfall recorded data of a given hydrological station, the rainfall frequency analysis of 48hrs can be constructed by using statistic hydrological events frequency analysis method. The result of this AMSR for the known station is supposed in Table 1.
2.4. Flood Frequency Curve of Discharge (FFCD)
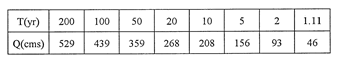
The FFCD is resulted from the combination of Figure 2 and Table 1. The frequency analysis for different return period, T, of this given catchment system is presented in Table 2.
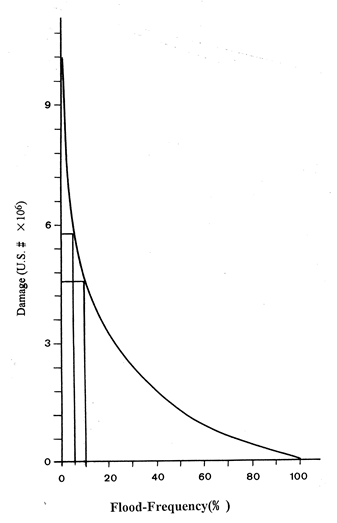
2.5. Flood-Damage with Flood-Frequency (FD-FF)
Based on the return period and the real document of flood loss, the FD-FF curve is made and given as Figure 3. As you pick any return, for example T=20yr, the corresponding annual cost including construction, operation and maintenance, will be USD 3,961,000. While, the annual benefit directly and indirectly from the drainage planning, such as high level utilization of land and more job chances, etc., from Figure 3 is USD 5,750,000. The B/C ratio is almost 1.45 for FD-FF.
3. Rainwater Cistern-Supply System Analysis (RWCS)
 | Figure 1. Mean Dimensionless Curve |
A flood-mitigation used to separate the flood and delay the flood peak is to store a certain quantity of flood discharge from a given period, such as T=20yrs, to a planning return period, said T=10yr. From Table 1 and Table 2, the corresponding reducing rainfall is 123mm/hr with the storing discharge 60cms. By using rational formula to calculate the area for catching the storage volume,  | (1) |
with C=0.8, the runoff coefficient, the area A=2,195,200m².If the duration for the rainfall is 3hrs per day, the storage volume will be: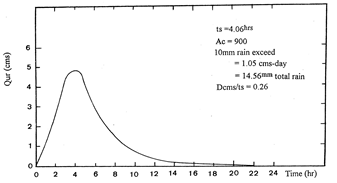 | Figure 2. Unit Hydrograph |
 | Figure 3. The FD-FF Curve |
 | (2) |
If there are 30days with such reducing rainfall, 123mm/hr , or said 60cms, therefore, the total storage volume per year for utilization on life substituting use becomes,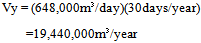 | (3) |
The mean annual life water fee is 0.33USD/m³ with return on investment rate, 0.08 on return interval, n=10years, in Taiwan, it means that the corresponding life water volume is substituted by rainfall to save that corresponding money. That is the annual benefit is, | (4) |
Table 1. Rainfall Frequency Analysis
 |
| |
|
Table 2. Flood Frequency Analysis
 |
| |
|
From Figure 3, the reducing damage from T=20yr to T=10yr is, | (5) |
Here, the total benefit becomes, | (6) |
Of course, the construction fee for storage the volume, 648,000m³, must be calculated.. The cost for construction is 7USD/m³ with return on investment rate, 0.08 on return interval, n=10years, then the total cost is, | (7) |
Finally, the B/C ratio for RWCS is 1.66. When we combine the effects of FD-FF and RWCS, The benefit-cost ratio becomes,  | (8) |
For the mere purpose, such as FD-FF, the B/C ratio is just only 1.45 which is the least one, while RWCS, 1.66. But by considering the environment protection and sustainable development together, the optimum solution with B/C ratio, 1.56, will be the best policy.
4. Design of Gutter Snipe
In order to keep leaves, bugs, dead birds, or other debris out of the collecting water tank, the characteristics of gutter snipe and its design criteria with experimental data are discussed here. Water travels down the roof and along the gutter to the downspout where the gutter snipe is installed. After water going through the slot in the screen as in Figure 4 and stored in the tank, while removing the debris, the clean water can be obtained by the water system and its decomposes.In order to make sure how much the rainwater will be stored with the needed optimum diameter of pipe for depending the flow situation, such as laminar or turbulent inflow, the theoretical consideration of design based on free-body diagram of fluid acting forces system, in Figure 5; free-body diagram of fluid and its objectives acting forces system in Figure 6; and effective discharge and velocity after screens, in Figure 7, and the theoretical comparisons between the different flow situations are presented . Finally, the discussion and conclusions are made .Three factors, such as diameter of pipe, D, the friction factor, f, and the inclined angel of the screen, θ, will be used to decide the discharge, Q0, and the acting force, Fx.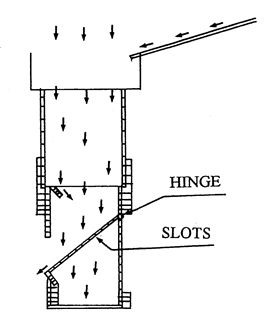 | Figure 4. Gutter Snipe |
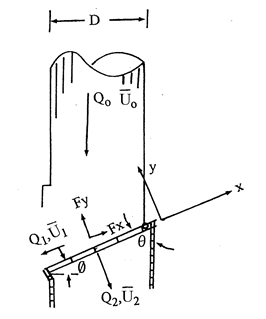 | Figure 5. Free-body Diagram of Fluid Acting Forces System |
4.1. Free-body Diagram of Fluid and Its Objectives Acting Forces System
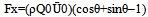
In Figure 5, the discharges of Q0, Q1, and Q2, and the velocities of Ū0, Ū1 and Ū2, and the acting forces of Fx and Fy must be decided first with the given diameter, D, screen inclined slope, θ, and the friction factor in Moody Diagram , f. The basic considerations of theories are,(a) Continuity equation | (9) |
(b) Equation of motion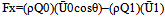 | (10) |
 | (11) |
and Ф=Π/2 –θ(c) Equation of energy conservationAssuming the pressures P0=P1=P2=Patm, and Z0=Z1=Z2, The energy conservation without energy loss is used to have | (12) |
Combining Eqs. (9), (10), (11) and (12), the results are  | (13) |
 | (14) |
 | (15) |
 | (16) |
Where Re= Reynolds number= Ū0D/ν, and ν= fluid kinematic viscosity=0.000001m²/s at 20℃. From Eq. (13), Q2 will be as large as possible for the purpose of collecting rainwater, meanwhile the discharge Q1 in Eq. (14) is only just enough for flushing out the solid matter, or say, as small as possible.
4.2. Free-body Diagram of Fluid Acting Forces System
In Figure 6, the force for the hinge to hold on the screen can be obtained by | (17) |
Assuming ax =0, the Fx=F , when it is 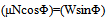 | (18) |
and Φ=26.57˚ with μN=0.5 The Ф-value will be the critical-angle for body equilibrium itself without any other acting force. By given any as small as possible force with water flushing, the solid be moved away easily.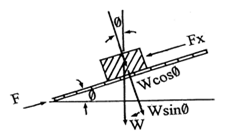 | Figure 6. Free-body Diagram of Fluid |
4.3. Effective Discharge and Velocity After Screen
The energy loss in Figure 7 after screen will be solved in order to calculate the effective velocity,U2', and discharge, Q2'. The formula used to have the solution is  | (19) |
where β=1.67 and t=the length of the slots, while b=the total length of screen.The procedures for solving Q0 and Fx are:1. Selecting f , then obtaining Re from Moody diagram; 2. With known D, the Ū0 got; 3. Then Q0 shown;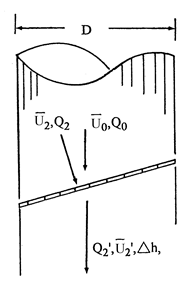 | Figure 7. Effective Discharge and Velocity after Screens |
4. Combing ρ, Q0 , Ū0, and θ, Fx presented;f=64/Re for laminar smooth pipe flow;f= 0.3146/Re¼ for Turbulent smooth pipe flow with Re is less than 100,000.
4.4. Discussion of the Friction Factor for the Situation of Flow
The value of f for turbulent flow with any angle θ can be neglected when it is less than 0.02 due to the consideration of material strength and economic views. And the U2' is calculated from | (20) |
For f= 0.10, the ratio of discharge and force between laminar (L)and turbulent(T) flow areQ0L/Q0T=6.4; and | (21) |
For f= 0.05, the ratio of discharge and force between laminar (L)and turbulent(T) flow areQ0L/ Q0T= 0.8 and  | (22) |
5. Conclusions
1. While considering the importance of environmental protection and sustainable development, the FD-FF combining with RWCS model will be the optimum solution.2. Generally speaking, the flow situation is always turbulent one, the criteria for the design of gutter snipe with Eq. (18) and Eq. (22) is f=0.05 and Φ=26.57˚ with μN=0.5.3. By utilization of Eq. (13) and Eq. (20) with f=0.05,Φ=26.57˚ and μN=0.5 for turbulent flow, the ratio between the effective discharge, Q'2T and the inflow discharge, Q0T, isQ'2T/ Q0T = from 0.85 to 0.93It means the water loss is under controlled.
References
| [1] | “Denver Regional Natural Hazard Mitigation Plan, 2010 Update,” Denver Regional Council of Governments, November 2010. |
| [2] | “Natural Hazard Mitigation Saves: An Independent Study to Access the Future Savings from Mitigation Activities, Vol. 1” Federal Emergency Agency of the U.S. Department of Homeland Security, National Institute of Buildings Science, Washington, D. C. 2005. |
| [3] | “Natural Hazard Mitigation Planning: A Community Guide,” Mitt Romney, Governor • Peter C. Webber, DEM Commissioner • Stephen J. McGrail, MEMA Director, Massachusetts Department of Environmental Management, 2003. |
| [4] | “Natural Hazard and Disaster Management, Unit 11,” Central Board of Secondary Education , Preet Vihar, Delhi-110092, 2006. |
| [5] | “Natural Hazard Mitigation : Various Mitigation Efforts Exist, but Federal Efforts Do Not Provide a Comprehensive Strategic Framework, GAO 07-403,” Accountability Office U.S.A. August 2007. |
| [6] | “The Texas Manual on Rainwater Harvesting,” Texas Water Development Board , 3rd Edition, Austin, Texas, 2005 |
 Abstract
 Reference
 Full-Text PDF
 Full-Text HTML