-
Paper Information
- Next Paper
- Previous Paper
- Paper Submission
-
Journal Information
- About This Journal
- Editorial Board
- Current Issue
- Archive
- Author Guidelines
- Contact Us
Resources and Environment
p-ISSN: 2163-2618 e-ISSN: 2163-2634
2012; 2(4): 132-140
doi: 10.5923/j.re.20120204.02
The Effects of ‘Fanya juu’ Soil Conservation Structure on Selected Soil Physical & Chemical Properties: the Case of Goromti Watershed, Western Ethiopia
 Abstract
 Reference
 Full-Text PDF
 Full-Text HTML
Worku Hailu 1, Awdenegest Moges 2, Fantaw Yimer 3
1Department of Water resources and Irrigation Management, Gonder University, POBox 196.Gonder, Ethiopia
2Biosystems and Environmental Engineering Department, Hawassa University POBox 5. Hawassa, Ethiopia
3Wondo Genet College of Forestry and Natural resources, Hawassa University POBox 128. Shashemene, Ethiopia
Correspondence to: Awdenegest Moges , Biosystems and Environmental Engineering Department, Hawassa University POBox 5. Hawassa, Ethiopia.
| Email: |  |
Copyright © 2012 Scientific & Academic Publishing. All Rights Reserved.
Soil degradation is evident in the mountainous areas of Ethiopia, is often represented as results of human pressure. It can be improved through different Soil and Water Conservation (SWC) measures. The study was conducted in Goromti watershed, in western Ethiopia to evaluate the impact of Fanya juu structures on some soil physical & chemical properties. Cultivated fields treated by five years and ten years old fanyajuu structures were compared with non conserved cultivated land (control) and evaluated under three slope gradients. The slope gradients were; gentle (3-15%), moderately steep (15-30%) and steep slope (>30%). A total of 27 soil samples were collected from the top 20 cm soil depth replicated three times and selected physical and chemical properties were analysed in the laboratory. The results of the study showed that soil pH, soil organic carbon (SOC), total nitrogen (N) were significantly (p≤0.05) different on farms treated by the fanyajuu compared to the non-conserved plots as well as under the different slope gradients. Bulk density (Db), sand and clay fractions were significantly varied with slope gradient. Soil organic carbon and total N were higher while bulk density was lower in soil under the non-conserved fields than in fields with fanyajuu structures. But no significant difference was observed in soil bulk density, sand and clay fractions among treatments. Similarly, CEC, available K and available P, and exchangeable K+, Ca2+, and Mg2+ didn’t show any significant differences with respect to structures and slope gradient. The research indicates that structures could benefit farmers through improving the nutrient status better if integrated with agronomic measures by using vegetation suitable for the local environment in one hand, and properly maintained for longer period of time, on the other.
Keywords: Fanya Juu, Cultivated Lands, Soil Fertility, Soil Properties, Western Ethiopia
Article Outline
1. Introduction
- The most serious problem of African countries in the future can be that of land degradation[22]. To understand how and why land has become degraded or likely to become so, one needs to have some knowledge of the physical environment, population, land use history and farming systems. Different explanations can be forwarded as to this daunting problem of mainly the agricultural sector in developing country like Ethiopia. The problem of soil degradation in Ethiopia is well established fact. The causes and consequences have been substantiated in different regions in the country.[29]noted ‘soil degradation can be regarded as a direct result of the past agricultural practices in the Ethiopian highlands’.[39]also agreed that anthropogenic effects continue to be the main causes and driving factors for soil degradation in Ethiopia. Soil degradation is a term that encompassing processes that involve the physical, biological and chemical degradations. Unwise land use change is one of the major causes of land degradation in Ethiopia. The most productive forest lands have already been brought into agricultural production. Further expansion of agriculture and grazing that takes place on marginal lands, even on steep slopes or on soils of poor physical structure or inherent property may accelerate land degradation. According to[3] only 25% of the land rehabilitation targets in terms of reforestation efforts and soil conservation schemes have been accomplished and most of the physical soil conservation measures and community forest plantations were destroyed in Ethiopia. Moreover, population growth in the country leads to deforestation and the conversion of pastureland to crops leading to overstocking and further degradation. Crop residues are increasingly used for fuel rather than mulch. Dung is also used as fuel rather than manure. All these factors lead to nutrient loss and increased erosion[32].Soil erosion is one of the most important threats to the sustainability of agricultural systems in the Third World countries[18]. Ethiopia can be a good example where such depletion of the soil resources is enormous. Dominated by small-scale agricultural producers, Ethiopia is one of the most severely eroded countries in the world[31]. The average annual rate of soil loss in Ethiopia is estimated to be 12 t/ha /yr, and it can be even higher on steep slopes with soil loss rates reach up to 300 t/ha/yr, where vegetation cover is scant[25,46]. The average annual soil loss from croplands is estimated at 42 t/ha[1]. About 45% of the total annual soil loss in the country occurs from cultivated fields, which accounts for only 15.3% of the total area[16]. This is about six times the rate of soil formation and causes annual reduction in soil depth by about 4 mm[29]. Since 1980s, the Ethiopian Government has established the Soil and Water Conservation Department (SWCD) and the Forest and Water Conservation Department (FWACD), respectively, in the Ministry of Agriculture, to carry out soil and water conservation activities and has been active in conservation works. A package of conservation measures have been developed usually employing terraces, bunds, tree planting and closure of grazing areas. Between 1970s and 1980s food-for-work (FFW) programme funded the construction of 800,000 km of soil and stone bunds on cultivated land; 600,000 km of hillside terraces and 80,000 hectares were closed for regeneration and for afforestation of steep slopes[13,19,48].Fanya-juu is a SWC structures that has been adapted and widely used in Africa especially in Kenya, Tanzania, Uganda, and in Ethiopia. The structure is an embankment made of soil and/or stone with a basin in the lower part[31]. The structure would eventually leads to the development of bench terraces over a period of time[37] if properly maintained. This happens as, the land between several of the embankments/bunds, levels off. The field then develops the characteristic "steps" of bench terraces. Soil and rainwater are conserved between the fanya-juu bunds. The objective is to keep rainfall where it falls and to keep soil in the field. The end result is creation of better growing conditions for the crop, both immediately, because of an increase in the amount of moisture available, and in the long term, because the soil is conserved. Basically the objective of soil and water conservation (SWC) is both using the soil and maintaining the productive capacity[45]. Though, to recommend a viable and applicable SWC may seem simple, it is important to understand how different practices affect productivity and how to implement with less cost.[15] estimated that without soil conservation intervention, crop yields will decline approximately by 1.5 percent per year, being equivalent to 30 per cent decline over 20 years. SWC structures not only act as a partial barrier to water induced erosion, but also form a total barrier to tillage erosion[14].[44] in his finding at Afdeyu, Eritrea indicated that from different SWC structures fanya Juu and double ditch were more effective in reducing soil loss and runoff losses than farm land with no SWC and contour bund. In his report 48.65t/ha, 2.39t/ha, 0.13t/ha and 0.08t/ha of soil lost from control, contour bunds, fanya juu and double ditch respectively.[23]reported that on their results of the experiment indicated that organic carbon (OC), total nitrogen (N), bulk density and infiltration rate, are significantly affected by soil conservation measures. The non-conserved fields had significantly lower OC, total N, and infiltration rate; but higher bulk density as compared to the fields treated by different conservation measures.Cultivation of the rugged topography and steep slopes is common in Ethiopian highlands, it is also the same in the study watershed. Such practices increase surface runoff and soil erosion. Even though the effects and extent of soil erosion vary with management and location, deterioration of the physical and chemical properties of soil by loss of organic matter, loss of minerals containing plant nutrient and exposes subsoil are generally accepted phenomenon.Apart from agronomic and soil management practices; structures would be necessary as they are controlling excess runoff particularly for annual crops and no steeper slopes. Despite all these efforts, others reported that SWC projects had been neither effective nor sustainable. For example,[1]showed that SWC activities in the highlands of Ethiopia are faced with several challenges. Despite extensive conservation interventions for over a decade, sustained adoption of the recommended measures by the farmers has not been as expected.[47] also noted that in the past, the agricultural sector has failed to keep pace with growing demand for food which is partly attributable to erosion induced degradation of croplands ended up with disappointing results. As in most western Ethiopia farm fields in the study area typically known for intensive cultivation that led to high runoff, soil erosion and sediment loss. In the past ten years, intensive soil and water conservation works have been started, one of which was Goromti watershed. Physical soil and water conservation structures were given emphasis mainly fanya juu and soil bund with support of NGOs and various government agencies. However enclosure and afforestation were also widely practiced. The adoption and sustained use of this measures have had mixed results. These practices reduce rate of land degradation and improve productive capacity of the land. On the other hand farmers were reluctant on maintenance of structures. Although it is recognized that SWC practices can sustainably contribute to reversing land degradation, the performance of past and present programs have in most cases been disappointing in terms of success and implementation in many countries[27]. As the most widely practiced intervention, the Fanyajuu’s impact on productivity of the soil is more relevant to farmers. This issue is critical but no report / study available. Such knowledge will be important to give information that can be used to improve land management practices in Goromti as well as in similar areas in the country. The overall aim of the study was to evaluate the effects of fanya juu on selected physical and chemical properties of the soil in the study area. Further it explores why farmers are reluctant in adopting SWC practices.
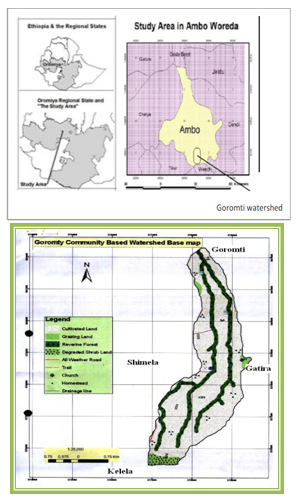 | Figure 1. The location map and the study area |
2. Materials and Methods
2.1. The Study Area
- Goromti Watershed is found in Ambo Woreda, Oromia Region, western Ethiopia (Figure 1). It is 15km far from Ambo town and 130 km from Addis Ababa. Geographically, it is located between 8049'26"- 8055'22"N Latitude and 37051'57"- 37054'08"E Longitude (Figure 1). The total land area of the Goromti watershed is about 1091 hectares and composed of Goromti and Ya-ee Chebo villages[2].The watershed has an altitude range of 2380 to 3170 m a.s.l. The area is characterized by undulating, rugged and hilly topography. About 25% of the total area is steep (more than 30% slope), 35% is moderately steep while the remaining 40% of the area is gentle to sloping relief. According to the local agro-climatic classifications, the study area belongs to moist ‘Dega’ agro-climatic zone with two rainy periods; the main rainy season is locally known as "Genaa rains" which occurs from June to mid-September and the short rainy season is locally known as "Arfassa" extending from February to April. The mean annual rainfall ranges from 1500-1700mm while the lowest and the highest mean annual temperatures are 13℃ and 27℃, respectively.Fifty nine percent of the total area of the watershed is cultivated land with arable crops, 6% covered by Enset (Enset ventricosum), plantation, 15% by shrubs and remnant natural forests, while 18% is occupied by villages/homesteads and 2% a grazing land. Natural vegetation in the Goromti watershed area is almost nonexistent and disappearing, although some indigenous trees like Juniperus P, Hagenia A, Podocarpus F, Oelea abisinica, Maitenus ovastus and Acasia spps are visible sparsely, only giving witness as dominant indigenous tree of the area. Some remains of Astha (ericaceous plant) are available on the top of Wenci mountain ridge[2]. Although detailed soil description is lacking in the study area, three major soil types are dominant in the watershed: brown soil locally ‘biyyo boralee’ which accounts 70% of the area followed by red soil locally known biyyo diimaa covering about 20% of the watershed, black soil (biyyo gurracha) covers 7% and others 3%[2].
2.2. Soil sampling and Laboratory Analysis
- A reconnaissance survey was carried out to identify representative soil sampling plots. Sampling sites were selected both from the farm plots where fanya juu structures have been practiced and plots with no SWC practices as a control (cultivation land adjacent to each structure) in the study area. In plots where the fanya juu structures are practiced sampling was done between the two successive structures.Soil samples were collected from the top 0-20cm depth at four corners and center of a plot of 10m x 10m size using “X” sampling design[36] with sharp edged and closed, circular auger pushed manually down the soil profile. A total of 27 soil samples (3treatments * 3slope gradients * 3replications*1 depth: 0-20cm) were collected in a Randomize Complete block Design (RCBD) for laboratory analysis. The samples were mixed thoroughly in a plastic bucket to form a composite sample. Collected soil samples were air-dried at room temperature, homogenized and passed through a 2mm sieve before laboratory analysis. Moreover, undisturbed samples were taken with a core sampler of height 10cm and diameter 7.2cm for soil bulk density determination.Since the structure (fanya juu) availed in between 3- 45% slope in the area, accordingly the slope gradient was divided into three slope ranges: 3-15 % is considered as gentle slope, 15-30% moderately steep and slope 30-50% considered as steep slope[17].Except the soil bulk density which was determined at Ambo University soil laboratory, the rest parameters were analyzed at the Water Works Design and Supervision Enterprise laboratory, Addis Ababa. Bulk density was determined by the core method[6]. Soil texture analysis was performed using Hydrometric method,[5]. The USDA particle size classes viz. sand (2.0–0.05 mm), silt (0.05–0.002 mm) and clay (<0.002 mm), were used when classifying the textural classes. Soil organic carbon (SOC) was determined by the Walkley-Black oxidation method[43]. Total nitrogen (TN) was determined using the Kjeldahl digestion method[9] and Available Phosphorous (Av-P) was determined using Olsen’s extraction method[40]. Available potassium (Av-K) and the exchangeable bases (Na+, K+, Ca2+, and Mg2+) were measured by atomic absorption spectrophotometer[5]. The Cation Exchange Capacity (CEC) was determined by extraction with Ammonium acetate method[10] and soil pH was determined by potesiometric Methods at a 1:2.5 soil-to water ratio. Soil and water conservation practice (fanya juu 5 years and 10 years old) and adjacent control farm plots and slope gradient were used as independent variables and the soil parameters as dependent variables. The significance differences of soil property due to SWC practice and slope gradient were tested using analysis of variance (ANOVA) following general Linear Model (GLM) procedure at P≤0.05 level of significance.
3. Results and Discussion
- Soil texture and Bulk Density The results of soil physical properties are presented in Table 1. The soil textural fractions of sand and clay showed significant variation with slope gradient (P=0.0250) and (P=0.0451), respectively While no significant variations were observed with the treatments. The mean sand content was higher (44.11±2.99) and lower (35.67± 1.95) when the slope gradient was greater than 30% and 3-15%, respectively (Table 1). This indicates that it is the inherent soil property and the position on the landscape (slope gradient) which cause the variation in texture than the age of structures. With steep landscapes, transportation and translocation of fine particles are expected. This result also confirms the presence of higher clay fraction in the lower slope gradient due to deposition from the upper slope.[42] also reported that on the steep cultivated hill slope the most noticeable changes were a decrease in clay and a corresponding increase in sand and silt fractions as the slope gradient increases. This may be due to the fact that the high mean annual precipitation over the study area may be selectively transported and/or leached fine fractions leaving behind the coarser fraction[21,11]. The soil bulk density (Bd) didn’t show a significant variation with treatments although higher mean value was observed in control farm land as compared to the 5 & 10 years aged fanya juu based SWC structures.[38]and[23]also reported that soil under non-conserved treatment was found to exhibit higher soil bulk density than treatments by SWC structures. The soil bulk density also showed significant difference (P=0.0451) with the slope gradients. The results indicate that soil Bd has a direct relation with slope gradient which might be attributed to the corresponding decline in soil organic carbon content with the increase in slope gradient/steepness.[35]also indicated the decrease in bulk density on cultivated soils in the lower than in the higher slope gradients.Soil organic carbon, total nitrogen contents (%) and C/N ratioSoil organic carbon (SOC) showed significant variation (P = 0.0408) with respect to treatment. The soil organic carbon content under the control farm was significantly lower than in the cultivated land under 5 and 10 years of aged fanya juu structures (Table 2). The result agrees with the finding of[37]in that soil organic carbon content in soils under three terraced sites were higher compared to the corresponding non-terraced sites of similar slopes.[23]also reported that the non-conserved fields had significantly lower SOC as compared to the conserved fields with different conservation measures.
| |||||||||||||||||||||||||||||||||||||||||||||||||||||||||||||||||||||||||||||||||||||||||||||||||||||||||||||||||||||||||||||||||||||||||||||||||||||||||
| |||||||||||||||||||||||||||||||||||||||||||||||||||||||||||||||||||||||||||||||||||||||||||||||||||||||||||||||||||||||
| |||||||||||||||||||||||||||||||||||||||||||||||||||||||||||||||||||||||||||||||||||||||||||||||||||
4. Conclusions
- The study revealed that, the use of Fanya juu as soil and water conservation structure in Goromti watershed had been found beneficial in protecting the cultivated land from erosion and the corresponding nutrient depletion. Further the results of the soil analysis showed that most of the soil physical and chemical properties had significant variations with respect to management practices and slope gradients. Bulk density in soil under conserved farm plots was lower than in the non-conserved farm plots. Bulk density and texture fractions of sand and clay also varied with slope gradients. The non significance differences in the physical properties (mainly in clay contents) in conserved and non- conserved farm plot suggested that differences in soil chemical properties were mainly results of soil management practices and not the inherent properties of the soils. Soil organic matter, total nitrogen and pH were found to vary with treatments and slope gradients. Generally, the SWC structures had shown positive impacts on the soil conditions, measured by the various soil physical and chemical properties. Considering the advantages of SWC structures towards improving the soil quality and thereby sustainable agricultural productivity, there should be a continuous awareness creation mechanism and a follow up process on the proper maintenance and management of the structures along with integrating agronomic measures using appropriate plant species.
ACKNOWLEDGEMENTS
- We would like to thank the farmers who allowed us to take soil sample and provided us with the necessary information.
References
| [1] | A. Aklilu, and J. De Graaff. ”Farmers’ Views of Soil Erosion Problems and their Conservation Measures at Beresa Watershed, Central Highlands of Ethiopia”. Agriculture and Human, vol. 23, pp. 99-108, 2006 |
| [2] | AWARD. “Project proposal on Goromti watershed”. unpublished. pp 1-14. 2006. |
| [3] | B. Azene. “A participatory Agro-forestry Approach for Soil and water Conservation in Ethiopia”. Tropical resource management papers no.17. Wageningen Agricultural University. The Netherlands. 229 p 1997. |
| [4] | R. Barber. “An Assessment of the Dominant Soil Degradation Processes in the Ethiopia Highlands: Their Impacts and Hazards”. Ethiopian highlands reclamation study. Land Use Planning and Regulatory Department. Ministry of Agriculture. Addis Ababa, Ethiopia. 1984. |
| [5] | C.A. Black, D.D. Evans, J.L. White, L.E. Ensminger and F.E. Clark. “Methods of Soil Analysis. Part 1. Physical and Mineralogical Properties Including Statistics of Measurement and Sampling”. American Society of Agronomy. Inc., Madison, Wisconsin. 88p. 1965. |
| [6] | J.R. Blake and K.H. Hartge. Bulk density. In: Klute, A. (Ed), “Methods in soil analysis, part 1. Physical and mineralogical methods”. 2nd Ed, American Society of Agronomy, Madison, WI, pp 363-376. 1986. |
| [7] | H.L. Bohn, B.L. Mcneal and G.A. O'connor. “Soil Chemistry”. 3rd ed. John Wiley & Sons, Inc. New York. 108 p. 2001. |
| [8] | N.C. Brady. and R.R. Weil. “The Nature and Properties of Soils”. 13th Ed. Prentice- Hall Inc., New Jersey, USA. 960 p. 2002. |
| [9] | J.M. Bremner and C. S. Mulvaney. “Nitrogen-Total”. In: A. L. Page, R. H. Miller, and D. R. Keeney. (eds.), Methods of Soil Analysis, 2. American Society of Agronomy, Madison, WI, pp 595–624. 1982.. |
| [10] | H. D. Chapman. “Cation Exchange Capacity”. In: Black, C.A. (ed.), Methods of Soil Analysis. Agronomy 9, American Society of Agronomy. Inc., Madison, Wisconsin, pp. 891-901. 1965. |
| [11] | W. Chesworth. “Encyclopedia of Soil Science”. Springer, Dordrecht, The Netherlands. 860 p. 2008. |
| [12] | T. Chun-Chih, C. Zueng-Sang and H. Chang-Fu. “Relationships between soil properties and slope position in a lowland rain forest of southern. Geoderma, vol. 123, pp. 131–142, 2004. |
| [13] | M. Constable and D. Belshaw. “The Ethiopian highlands reclamation study: Major findings and recommendations”. In: the Proceedings of the National Workshop on Food Strategies for Ethiopia held at Alemaya University of Agriculture 8–12 December, 1986. Addis Ababa, Ethiopia, pp. 142–179. 1986. |
| [14] | G. Desta, J. Nyssen, J. Poesen, J. Deckers, H. Mitiku, G. Govers, and J. Moeyersons. “Effectiveness of stone bund in controlling soil erosion on cropland in the Tigray Highlands, northern Ethiopia”. Soil Use and Management, vol. 21, pp. 287–297, 2005. |
| [15] | J. Ellis-Jones and A. Tengberg. “The impact of indigenous soil and water conservation practices on soil productivity: Examples from Kenya, Tanzania and Uganda”. Land Degradation and Development, vol. 11, pp.19–36, 2000. |
| [16] | EPA (Environmental protection authority). “State of Environment Report for Ethiopia”. EPA Addis Ababa, Ethiopia. 2003. |
| [17] | J. Escobedo. “Survey of soils and land classification Guideline”. Field Document. MoA, Addis Ababa. 1990. |
| [18] | H. Eswaran. “Working Group land degradation and desertification”. Bulletin of the International Union of Soil Science. 25: 27-28. 1999. |
| [19] | E. Eyasu. “Farmer’s Perceptions of Soil Fertility Changes and Management”. Institute of Sustainable Development. Addis Ababa. 225p. 2002. |
| [20] | P. Fahnestock, R. Lal and G.F. Hall. “Land use and erosion effects on two Ohio alfisols”. Journal of Sustainable Agriculture, vol. 7, pp. 2–3, 1995. |
| [21] | Y. Fantaw, L. Stigand, A. Abdu. “Soil Property Variations in relation to Topographic Aspect and Vegetation Community in the South-Eastern Highlands of Ethiopia”. Forest Ecology and Management, vol. 232, pp. 90-99, 2006. |
| [22] | FAO. “Land conservation and restoration in Africa”. Programme International ARC 90/4 Rome. 120p. 1990. |
| [23] | Y. Gebreselassie, T. Amdemariam, M. Haile and C. Yamoah. “Lessons from upstream soil conservation measures to mitigate soil erosion and its impact on upstream and downstream users of the Nile River”. International Water Management Institute. pp.170-183. 2009. |
| [24] | E.G. Gregorich, K.J. Greer, D.W. Anderson and B.C. Liang. “Carbon distribution and losses: erosion and deposition effects”. Soil Tillage Res., vol. 47, pp. 291–302, 1998. |
| [25] | Y. Hao, R. Lal, L.B. Owens, R.C. Izaurralde, W.M. Post and D.L. Hothem. “Effect of cropland management and slope position on soil organic carbon pool at the North Appalachian experimental watersheds”. Soil & Tillage Res., vol. 68, pp133–142, 2002. |
| [26] | P. Harrison. “The Greening of Africa: Breaking Through in the Battle for Land and Food”. Great Britain: Paladin Grafton Books. 1987. |
| [27] | N.W. Hudson and R.J. Cheatle. “Working with farmers for better land husbandry”. Soil and Water Conservation Society, Ankeny, Iowa. 1993. |
| [28] | H. Hurni. “Soil Conservation in Ethiopia; Guideline for development agents”. CFSCDD/ MoA, Ethiopia. 1986. |
| [29] | H. Hurni. “Degradation and conservation of the resources in the Ethiopian highlands”. Mountain Research and Development, vol.8, no. 2/3, pp. 123-130, 1988. |
| [30] | H. Hurni. “Ecological Issues in the Creation of Famines in Ethiopia”, Paper Presented at the National Conference on a Disaster Prevention and Preparedness Strategy for Ethiopia. Addis Ababa. 1988. |
| [31] | H. Hurni. “Land degradation, famines and resource scenarios in Ethiopia”. In: D. Pimentel (ed.). World Soil Erosion and Conservation. Cambridge University Press, Cambridge, pp. 27–62. 1993. |
| [32] | M.A. Jabbar, S. Ahmed, Benin, G. Berhanu and S. Ehiu. “Livestock, Livelihood and Land Management Issues in the Highlands of Ethiopia”. International Land & Resource Inst. Ethiopia. 2002. |
| [33] | Katrin, V. “Research in Africa Projects- Technology -Adoption fanya juu”. IWMI.http://westafrica2.iwmi.org/projects/Adoption%20Technology/RainWaterHarvesting/50-Fanya%20juu.htm. 2006. |
| [34] | J.R. Landon. (ed.). “Tropical Soil Manual. A Handbook of Soil Survey and Agricultural Land Evaluation in the Tropical and Subtropical”. Longman Broak. 447 p. 1991. |
| [35] | Y. Li and M.J. Lindstrom. “Evaluating soil quality-soil redistribution relationship on terraces and steep hill slope”. Soil Science Society of America Journal, vol. 65, pp. 1500–1508, 2001. |
| [36] | R. Margesin and F. Schinner. “Manual of Soil Analysis-Monitoring and Assessing Soil.” Bioremediation. Springer-Verlag Berlin Heidelberg, Innsbruck, Austria. 2005. |
| [37] | A. Million. “Characterization of Indigenous Stone bunding (Kab) and its effect on crop yield and soil productivity at Mesobit-Gedba, North Showa Zone of Amhara Region”. MSc Thesis, Alemaya University. 2003. |
| [38] | D. Mulugeta and S. Karl. “Assessment of integrated soil and water conservation measures on key soil properties in South Gonder, North-Western Highlands of Ethiopia”. Journal of Soil Science and Environmental Management, vol. 1, no. 7, pp. 164-176, 2010. |
| [39] | J. Nyssen, J. Poesen, J. Moeyerson, M. Haile, and J. Deckers. “Dynamics of soil erosion rates and controlling factors in the Northern Ethiopian highlands-towards a sediment budget”. Earth Surface Processes and Landforms, vol. 33, pp. 695-711, 2008. |
| [40] | S. R. Olsen and L. A. Dean. “Phosphorous”. In: C. A. Black (ed), Methods of Soil Analysis. Part 2: Chemical and Microbiological Properties. American Society of Agronomy. Inc., Madison, WI; 9:1035-1049. 1965. |
| [41] | D.J. Pennock, D.W. Anderson and E. de Jong. “Landscape-scale changes in indicators of soil quality due to cultivation in Saskatchewan, Canada”. Geoderma, Vol. 6, pp. 1–19, 1994.. |
| [42] | C. Regina, C. Luiza, V. Fla, J. Luiza, Q. Romild, F. Paiva. Terezinha, S. MonteiroLucine, Z Sousa and K. Bart. “Variation of carbon and nitrogen cycling processes along a topographic gradient in a central Amazonian forest”. Global Change Biology, vol. 10, pp. 592–600. 2004. |
| [43] | M. Schnitzer. “Total Carbon, Organic Matter and Carbon”. In: A. L. Page, R. H. Miller, and D. R. Keeney. (eds.). Methods of Soil Analysis. Part 2, Agronomy Monograph, 2nd ed. American Society of Agronomy, Madison, WI; 9: 539-577. 1982. |
| [44] | Z. Semere. “Assessment of Soil and Water Conservation Activities in Afdeyu, Eritrea Technical and Socio-Economic Aspects”. pp 31-45. 2002. |
| [45] | F. R. Troeh, A. J. Hobbs and R. L. Danahue. “Soil and water conservation for productivity and environmental protection”. Prentice-hall, Inc., Englewood Cliffs. 1980. |
| [46] | USAID. “Amhara National Regional State food security research assessment report”.http://crsps.org/amhara/amhara_rpt.PDF. 2000. |
| [47] | B. Woldeamlak. “Land Degradation and Adoption of Conservation Technologies in the Digil Watershed, Northwestern Highlands of Ethiopia”. OSSREA, Social Science Research Report Series No. 29.Addis Ababa. 2003. |
| [48] | B. Woldeamlak. “Soil and water conservation intervention with conventional technologies in northwestern highlands of Ethiopia: Acceptance and adoption by farmers”. Land Use Policy, vol. 24, pp. 404–416, 2006. |