-
Paper Information
- Paper Submission
-
Journal Information
- About This Journal
- Editorial Board
- Current Issue
- Archive
- Author Guidelines
- Contact Us
Resources and Environment
p-ISSN: 2163-2618 e-ISSN: 2163-2634
2012; 2(4): 116-131
doi:10.5923/j.re.20120204.01
Waste Water Use in Crop Production: A Review
 Abstract
 Reference
 Full-Text PDF
 Full-text HTML
M. P. S. Khurana1, Pritpal Singh2
1Department of Soils, Punjab Agricultural University, Ludhiana, Punjab,141 004, India
2Krishi Vigyan Kendra (PAU), Haveli Kalan, Ropar, Punjab,140 001, India
Correspondence to: M. P. S. Khurana, Department of Soils, Punjab Agricultural University, Ludhiana, Punjab,141 004, India.
| Email: |  |
Copyright © 2012 Scientific & Academic Publishing. All Rights Reserved.
Paucity of quality fresh water for agriculture has made waste water (WW) application a popular option. Available data on chemical composition of different waste water, their effect on soil fertility, soil heavy-metal content, crop yield and quality parameters and maximum permissible limits (MPL) of different International environment protection agencies and governments of different countries has been summarized. Chemical composition of WW varied remarkably with respect to their heavy-metal content, pH, electrical conductivity (EC), biological oxidation demand (BOD), chemical oxidation demand (COD), alkalinity and hardness. Field application of all types of waste water significantly increases soil OC percentage, soil EC, cation exchange capacity (CEC), total and DTPA-extractable heavy-metal/micro-nutrient content, available macro-nutrient (N, P and K) content with significant decreases in calcium carbonate content of surface soil. However, high content of nitrogen, phosphorus and potassium strengthens its high fertigation/manural value for field crops. Significantly higher heavy-metal accumulation in soils irrigated with WW than ground water has been observed in surface layer than the lower depths of soil profile. Since crop genotypes and even crop cultivars within genotypes respond differently to waste water irrigation, their selection becomes more important under such situations. More importantly, carbon sequestration through WW irrigation could sustain long-term soil fertility. Periodic monitoring of chemical composition of waste water, soil and crop produce is however, suggested for safe and long term use of waste water.
Keywords: Crop Yield, Ground Water (GW), Heavy-metals, Maximum Permissible Limits (MPL), Micro-nutrients, Waste Water (WW)
Cite this paper: M. P. S. Khurana, Pritpal Singh, Waste Water Use in Crop Production: A Review, Resources and Environment, Vol. 2 No. 4, 2012, pp. 116-131. doi: 10.5923/j.re.20120204.01.
Article Outline
1. Introduction
- Water is a vital to all living creature, as it makes up to 50-97% of plant and animal and about 70% of average human body weight[1], but regrettably it is the most poorly managed resource in the World[2]. Ground water (GW) resources in most areas of world are shrinking at an alarming rate and may not meet the ever increasing demands from agriculture and industry in future. Estimates revelled that agriculture sector consumes maximum of the GW and ~80 per cent of actual water resources are utilized in agriculture for irrigation purpose. Many farmers in areas near to urban/per-urban localities are even compelled to use waste water to irrigate their crops, due to absence of better alternatives[3].The implications associated with heavy-metal contamination are of great significance, particularly in agricultural production system. Tremendously escalating human population and expanding industry and urbanization has not only used a large area of World productive lands, but is also generating a large volume of WW every day. Estimates revealed an annual production of ~30 million tonsof WW in the World, of which ~70% is consumed as an agricultural fertilizer and irrigation source[4]. With that WW utilization for crop production has gained an acceptance, all over the World[5] as an economic alternate that could substitute nutrient needs[6-9] and water requirement of crop plants. It India, estimates revealed that ~73,000 hectares were irrigated with WW during early nineties and presently the area under WW irrigation is on the rise[10].Many small to medium scale industries operating in peri-urban residential areas of old cities are disposing their contaminated effluents directly in sewage system. Nutrients and water being the most critical input in agriculture, harvesting the nutrients and irrigation potential of WW are of prime importance for maximizing the food, fodder and fuel production. Even, the conservative estimates on the basis of 70% of the sewage available from large cities, shows that these effluents have the potential for irrigating (7.5 cm), about 21 thousands hectares of land on daily basis or alternately about 7.8 million ha on annual basis[11]. Studies have documented that direct disposal of effluents to land and water bodies has potential to contaminate air, surface, GW as well as soils and crops grown on these soils which will have bearing on human health. Possibilities of GW (shallow tube-well) pollution with respect to heavy-metal concentrations by WW application have also been suspected[12]. Therefore, an attempt has been made to summarize the information available in the published literature to construct a balance sheet of beneficial and harmful effects of WW application in soil-plant-water system for sustainable crop productivity.
2. Fertigation / Manurial Value of Waste Water
- Waste water has been considered as low price fertilizer because of its high nitrogen (N), phosphorus (P) and potassium (K) content[8]. Although of wide variation in nutrient concentrations, WW[13] contained 48.3, 7.6, 72.4 and 34.6 mg L-1 of N, P, K and sulphur (S) besides their micro-nutrient manural value (0.34 mg Zn L-1, 10.8 mg Fe L-1, 0.2 mg Cu L-1 and 0.36 mg Mn L-1). Thus, five irrigations of 7.5 cm each with SW could add about 181, 29, 270 and 130 kg ha-1 of N, P, K and S, respectively which is adequate to meet the nutrient requirement of the crops. Computations made on the basis of an average content of N, P and K in WW and ~70% utilization in agriculture sector shows that WW can annually contribute 380, 60, 520 and 1.4 thousand tons of N, P, K and Zn, respectively, in addition to other micro-nutrients. The total value of these nutrients would be around 1.78 million US$ annually[11]. These findings thus, recapitulates that WW have great potential as manure when used for irrigation to crops.
3. Maximum Permissible Level of Heavy-metals and Other Quality Related Parameters
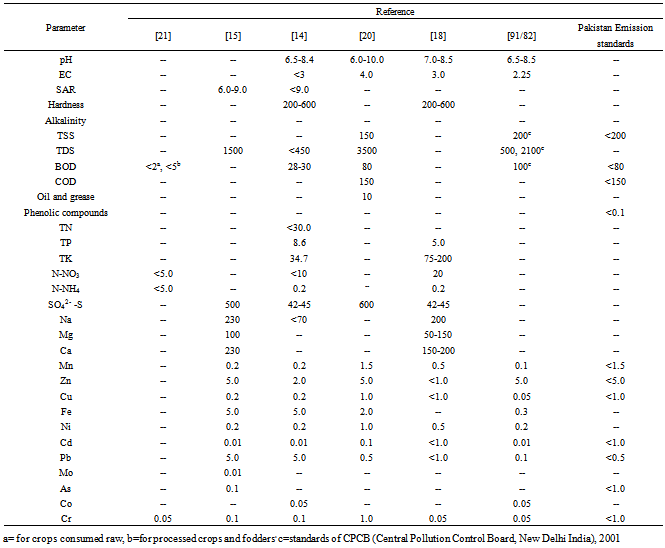
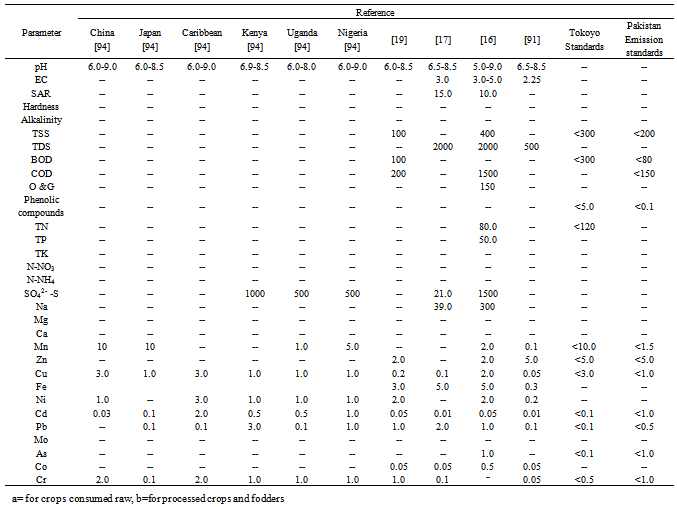
- Tables 1 and 2 report information on maximum permissible level (MPL) of heavy-metals and other pollution related parameters of WW for its use as irrigation purpose, standardized by different agencies in different countries. Governments of different countries and the agencies/organizations associated with protection of environment (Tables 1 and 2) have suggested a wide range of WW pH (6.0-9.0) for agricultural use. Total concentration of soluble salts (EC) should be in between 3.0-5.0 dS m-1, a MPL suggested by different agencies/Governments (Tables 1 and 2). Wide variation in MPL for sodium adsorption ratio (SAR) viz. as low as <1.0[14], 6.0-9.0[15], 10.0[16] to as high as 150[17] has been suggested. Likewise, the hardness of the WW for their use in agriculture as irrigation purpose should fall in between 200-600 mg L-1[14,18]. Concentration of total suspended solids (TSS) in WW should be <400 mg L-1[16], <300 mg L-1 (Tokyo standards) and <100 mg L-1[19]. Standards of National Environmental Quality Standards, Pakistan (NEQS)[20] has set 10 mg L-1 as a MPL for oil and grease, while according to Gazette of Mauritius[16] a value of 150 mg L-1 for oil and grease has been standardized as safe for WW use in agriculture. Tokyo standards revealed that phenolic compound concentration in WW should be less than 5.0 mg L-1, for irrigation purpose. A wide range (from 30.0 to 120.0 mg L-1) of total nitrogen (TN) in WW for agricultural use has been standardized by different agencies/Governments (Tables 1 and 2). Nitrate-N (NO3-N) concentration in WW should not exceed 120 mg L-1 (Tokyo Standards), 80 mg L-1[16], 20 mg L-1[18], 10 mg L-1[14] and 5.0 mg L-1[21] for safe use as irrigation purpose. Far less cut-off concentration for ammonical-N (NH4-N) as 0.2 mg L-1[14,18] in contrast to far high concentration of 5.0 mg L-1[21] has been suggested. Wide variation in MPL for sulphate-S (SO42--S) concentration in WW from 21-1500 mg L-1 has been standardized by different agencies Tremendously escalating human population and expanding industry and urbanization has not only used a large area of World productive lands, but is also generating a large volume of WW every day (Tables 1 and 2). Concentration of Mn in WW from 0.2 to 10 mg L-1 (Tables 1 and 2) has been referred as safe limit for agricultural use by different agencies/Governments. Zinc concentration should be <5.0 mg L-1 in WW for irrigation use. Likewise, Cu and Fe content must not exceed 3.0 mg L-1 and 5.0 mg L-1, respectively (Tables 1 and 2) in WW for their discharge onto agricultural lands. In consonance, MPL standardized by different agencies/Governments for heavy-metals also revealed wide variation. A MPL value for Ni in WW between 0.2 to 3.0 mg L-1, for Cd between 0.01 to 2.0 mg L-1, for Pb between 0.1 to 5.0 mg L-1, for As between 0.1 to 1.0 mg L-1, for Co between 0.05 to 0.5 mg L-1, for Cr between 0.05 to2.0 mg L-1 has been standardized (Tables 1 and 2) by different agencies/Governments. Concentration of total suspended solids (TSS) in WW for Irrigation purpose should be <400 mg L-1[16], <300 mg L-1 (Tokyo standards) and <100 mg L-1[19].
3.1. Heavy-metal Content of Waste Water Generated by Different Industries
- Waste waters differed remarkably with respect to their chemical composition depending upon the source from where they are originated[22-41]. Industries use different chemicals depending upon their requirement and purpose of operations and thus generate effluents contaminated with pollutants of different nature and that too in vary concentrations. Even the same type of effluent discharged by two different industrial units varies largely with respect to their chemical composition[26,40]. Effluents of industries when flushed in the sewage drains passing across the industrial areas further exhibit elevated levels of chemical constituents[12,23,41]. Effluents from sewage drain contain pollutants in far high concentration than those are originally discharged by an industrial unit.A study conducted at Ludhiana (India) for comparing the heavy-metal composition of different industrial effluents categorized sugar-mills under highly pollution causing category, followed by tannery effluents that contains 9.20-13.8 mg Cr L-1, which had detrimental effect on water quality. However, effluents from electroplating industry were rated under highly acidic (pH ~2.13) category, besides high content of Ni (2.4-52.0 mg L-1), cyanides (0.4-4.4 mg L-1) and Cr (4.4 -20.0 mg L-1)[42]. However, high content of Zn (18.0 mg L-1) in the effluents from cycle manufacturing industry and ferric sulphate in effluents from steel industry at Ludhiana (India)[42]. In an another study, higher Cd, Ni and Co contents in WW of sewage drain passing across industrial area manufacturing metallic products than the effluents discharged directly by textile dye and wool industry have been reported[23]. High Cd content was observed in effluents of electroplating industry and high Cr content (140-times higher than MPL) in effluents of leather industry[23]. Steel industry effluents from Esfahan (Iran) contaminated with 0.08 to 0.41 mg Fe L-1, 0.02 to 0. 25 mg Zn L-1, 0.2 to 0.08 mg Cu L-1, 0.0 to 0.02 mg Pb L-1, 0.0 to 0.02 mg Cd L-1, 0.0 to 0.13 mg Cr L-1, 0.0 to 0.14 mg and 0.0 to 0.042 mg Ni L-1 has been reported[35]. The comparison of chemical characteristics of effluents from different industries in Pakistan elucidates ghee industry effluents as most injurious to soil and plant health, because of its high EC (~8.14 dS m-1) than effluents from textile, chemical juncture and city sewage[31]. Although, environment protection agencies (Tables 1 and 2) have standardized a cut-off EC limit (3.0 to 5.0 dS m-1) for effluents from different industries for their disposal in agriculture for crop production, there is report[43] that still discouraged use of WW for sensitive crops, even with EC level of WW within the permissible limits. Considerable variation in heavy-metal concentration in effluents discharged by marble, chemical, textile, steel, dyes and coal industries has also been observed[28]. Mean concentration of 0.19 mg Zn L-1, 0.01 mg Cu L-1, 0.07 mg Mn L-1, 0.87 mg Fe L-1, 0.77 mg Pb L-1 and 0.02 mg Cd L-1 in municipal WW of Irbid, Jordan has been reported[9]. Leather complex effluents mixed with municipal SW from Ludhiana (India) were reported to contain 0.41 mg Cu L-1, 20.1 mg Fe L-1, 0.39 mg Mn L-1, 2.25 mg Zn L-1, 4.03 mg Al L-1, 0.04 mg As L-1, 8.31 mg Cr L-1 and 0.20 mg Ni L-1, representing 42, 155, 98, 31, 50, 4, 1400 and 52-times, respectively higher heavy-metal content than GW, due to mixing of industrial effluents[23].
|
|
- Tannery effluents from Tamil Nadu (India) were reported to deteriorate the quality by increasing Cr content from 9.2 to 13.8 mg L-1 in surface water (SW) and thereby rendering it unfit for agricultural use[44]. Sugar and distillery effluent discharge in Gelabi river of Assam (India) have been reported to adversely affect the quality of water with respect to pH, total dissolved solids (TDS), dissolved oxygen (DO), biological oxidation demand (BOD), and chemical oxygen demand (COD)[45]. Waste water flushed in ‘Budha Nallah’ passing in the outskirts of highly industrialized (electroplating, bicycles, dyeing industries) town Ludhiana (India) was reported to contain was 42.2, 2.8, 3.5, 1.67, 35.0, 6.0 and 47.2-times higher Fe, Zn, Cu, Pb, Ni, As and Cr content, respectively than the WW sampled from less industrialized town, Sangrur (Punjab, India)[41], that indicates the substantial heavy-metal contribution of industry. Similarly, the sewage WW carrying effluents from several industries established across the periphery of Ballabgarh (India), contained appreciably higher content heavy-metals (Pb, Ni and Cd) than that the WW from less industrialized areas[46]. Textile WW from Tamil Nadu (India) has been reported to contain 1500 mg HCO3 L-1, 526 mg Cl L-1 , 580 mg Ca L-1, 140 mg Mg L-1, 46 mg Na L-1 and 28.2 mg K L-1, with alkaline pH (8.1 to 8.9) and highly saline nature (EC=6.2 dS m-1)[36]. In contrast, however, the effluents from pharmaceutical industry in Benin City (Nigeria) were less saline in nature (EC=1.7 dS m-1) and have almost same pH (8.38), but less K (139 mg L-1), Ca (343 mg L-1) and Mg (51 mg L-1)[30].Optimum range of pH of the irrigation water from 6.5 to 8.5 has been suggested, while permissible limit 9.0 has been standardized[47]. Treated effluents from El-Sadat City (Egypt) were tested to contain 2.48 mg Fe L-1, 0.95 mg Mn L-1, 0.72 mg Zn L-1, 0.31 mg Cu L-1, 0.27 mg Ni L-1, 0.08 mg Co L-1, 0.06 mg Cd L-1 and 1.28 mg Pb L-1[29]. However, wide variation in properties of effluents discharged by different industries established in Gaborone (Africa) has been reported[24]. The study reports wide variation in pH viz. from pH=6.6 in effluents of bravery to pH=9.3 in effluents from pharmaceutical industry, while near neutral pH in the effluents from chemical and paint (pH=6.92) and food and beverages (pH=7.02) industry. These concentrations thus revealed that WW differed greatly depending upon the industry and nature of chemicals being used.
3.2. Other quality Related Parameters of Waste
- There are many other quality related parameters (Tables 1 and 2) that had an important bearing on quality of WW for irrigation purpose. A sewage drain carrying effluents from electroplating, bicycles and dyeing industries of Ludhiana (India) was reported to have higher values of 130 and 245 mg L-1 of BOD and COD respectively against 43.9 and 174 mg L-1 in the sewage WW from less industrialized town, Sangrur, (Punjab, India) indicating high BOD value for WW of Ludhiana than MPL (100 mg L-1) of FAO for irrigation[41]. In an another study a wide range in quality parameters viz. pH=10 to 11.5, TSS=300 to 500 mg L-1, TDS=8000 to 9000 mg L-1, BOD=400 to 800 mg L-1, COD=900 to 1500 mg L-1, oil and grease=20 to 25 mg L-1, Cr=0.24 mg L-1 and sulphide-S=3.64 mg L-1 has been reported in sewage WW from Rajasthan (India)[48]. A far wide variation in BOD (350 to as high as 2558 mg L-1), Suspended solids (112 to as high as 2069 mg L-1) and dissolved oxygen (2.37 to 9.0 mg L-1) have also been reported earlier[24]. Therefore, to ensure protected use of WW, adequate dilution with quality fresh water is required, for sustainability in crop production and environmental protection.
4. Effect of Long-term Sewage Irrigation on Soil Physico-chemical Properties
4.1. Soil pH
- There are different views associated with effects of long-term WW application on soil pH. There are studies[9,30,33,37,49,50], which confirms increase in soil pH with WW irrigation of soil. A 50-years long-term study on the use of effluents from textile industry revealed 0.4 unit increase in surface soil pH than the soils irrigated with GW (Table 3)[36]. In a similar long-term study on the use of sewage WW for 50-60 years, 0.5 unit increase in surface soil pH has been reported[49]. However, fertilizer manufacturing plant effluents when applied to Nigerian soils had resulted in an increase in soil pH from 7.23 to 7.76[22]. Significant increase of 0.5 units (Table 5) in surface soil irrigated with mixed domestic and industrial effluents from El-Khashab (Egypt) has also been reported[33]. Such effect may be attributed to the high content of basic cations viz. Na+, Ca2+ and Mg2+ in the WW, which after accumulation in surface soil layer for a long period of time[51], leads to increase soil pH. The increased in soil pH (Table 3) has been referred exclusively to the high content of Ca2+ and Mg2+ of pharmaceutical effluents applied to the soil[30].
| ||||||||||||||||||||||||||||||||||||||||||||||||||||||||||||||||||||||||||||||||||||||||||||||||||||||||||||||||||||||||||||||||||||||||||||||
| |||||||||||||||||||||||||||||||||||||||||||||||||||||||||||||||||||||||||||||||||||||||||||||||||||||||||||||||||||||||||||||||||||||||||||||||||||||||||||||||||||||||||||||||||||||||||||||||||||||||||||||||||||||||||||||
4.2. Electrical Conductivity (EC) and Related Parameters
- Significantly maximum EC value of soil irrigated with municipal WW application consecutively for 10-years has been reported[9]. Remarkably higher accumulation of soluble salts in the deeper soil layers (20-40 and 40-60 cm) than surface (0-20 cm) soil layer has been ascribed to the leaching effect with irrigate water[9]. Significant increase in surface soil EC with WW application[37] in contrast to significant decrease in EC of soil, with the application of industrial effluents in rice culture areas of Pakistan[55] has been reported. A study in the arid climate on the use of municipal effluents in soils for 16-months recapitulated increased EC value by 0.5 dS m–1, Na+ by 6.0 mmol L–1 and the exchangeable sodium percentage (ESP) by 6.8[58]. However, soil Ca2++Mg2+ concentrations were greater in soils irrigated with industrial effluent by 0.5 mmol L–1 but were lesser when compared with potable irrigation. Leachate collected at 61 cm depth indicated that effluent irrigated soil leachate were higher than potable water irrigated leachate primarily in EC by 0.2 dS m–1 and Na+ content by 0.8 mmol L–1[58]. However, study with a short-term (2 years) application of sewage WW to the calcareous soils of Spain, there was a slight increase in EC and Na+ concentration in soils the than soils irrigated with GW[50]. In a potato culture in soils of Jalandhar (Punjab, India), an increase in soil EC from 0.28 to 0.64 dS m-1 has been reported with the use of municipal WW contaminated by leather complex effluents[23]. Remarkable increase in sodium adsorption ratio (SAR) of soils receiving industrial effluents has been reported[55]. Increased EC of surface soil with WW application in comparison to GW irrigated soils (Table 8) has also been reported in many other studies conducted in different agro-climatic conditions[9,23,29,30,33]. The increased salt concentration of soil receiving WW on regular basis has been referred to the original level of TDS of WW[56].
4.3. Soil Organic Carbon
- Soil organic carbon (OC) has been the exclusive indicator of soil quality as it acts as a store of plant available nutrients[54]. Long-term use of WW for irrigation to crops results in significant increased in soil OC than the soils irrigated with GW[9,12,23,30,36-38,52,54,56,59]. In sub-tropical Indian soils, an increase of 38-79% in soil OC content with 20-years of sewage WW irrigation as compared to GW irrigated soils has been reported[54]. However, in Vertisols of Mexico City there was an increased in soil OC content by 2.5-fold after 80-years of SW irrigation over GW irrigated soil[60]. After 36-years of domestic sewage effluent irrigation, significant improvement in the soil OM from 1.24–1.78%, especially down to a distance of one Km along the disposal channel, has been reported[53]. Even after 8-weeks of pharmaceutical effluent application @ 75, 000 L ha-1 to Nigerian soils, there was an increase in soil OC from 1.00 to 1.08% (Table 5)[30]. About 7.8-fold increase in soil organic matter (OM) content (from 0.52-4.07%) with distillery effluent application in soils of Nepal has been reported[38]. Sewage WW irrigation for 50-60 years in soils of Calcutta (India) has exhibited an increase in soil OC from 0.19 to 0.37%[49] and from 1.24 to 1.73% after 25 years (Table 7) in soils of Kurukshetra (Haryana, India)[53]. Large additions of OM from sewage WW and anaerobic conditions developed due to heavy loading of OM had reduced OC (Table 3 and 4) decomposition and have resulted in build-up of soil OC[12]. Therefore, long-term WW irrigation can be a good means of carbon sequestration in soil and can thus be referred as a soil quality sustaining practice.
4.4. Calcium Carbonate
- In Egypt, considerable increase in calcium carbonate (CaCO3) content of surface soil receiving WW for irrigation, in comparison to soils receiving GW has been reported (Table 4)[33]. In an another area of Egypt, however 1.42% decrease in surface soil CaCO3 content was reported with the use of WW for irrigation purpose over GW irrigated soils (Table 4)[29]. The significant reduction in CaCO3 content of soil with sewage WW irrigation[12,61] may be the result of decrease in soil pH and production of organic acids[57] as a result of anaerobic decomposition of OM, which had lead to the solublization of CaCO3 and thereafter it’s leaching below the root zone[61].
4.5. Soil Macro-nutrients
- Reports from different studies on soil fertility parameters and indicated a spectacular change in all measured parameters with WW irrigation (Table 3). Improvement in soil fertility with WW irrigation over a period of time has been well documented[9,30,33,38,49,53]. After 10-years of municipal WW application, significant increase in soil available N, P and K content in surface (0-20 cm) soil has been reported[9]. In 36-years long-term experiment on the use of domestic sewage WW, the build-up of 2908 kg TN ha−1, 58 kg Av-P ha−1, 2115 kg TP ha−1, 305 kg Av-K ha−1 and 4712 kg TK ha−1 in surface soil has also been reported[9]. Even the used of municipal WW in soils of arid climate for 16-months has resulted in increase in N03-N content by 7.8 mg kg−1, TP by 31.7 mg kg−1 and TK by 134 mg kg−1 [58]. Likewise, TN, TP and TK content in soils irrigated with sewage WW were 2200, 2000 and 25940 mg kg−1 as against 1141, 1120 and 14600 mg kg−1 in GW irrigated soils has been reported[49]. Likewise, 440-times increase in TN content (from 500-2200 mg kg−1), 5.3-times increase in Av-P (from 2.2-11.7 mg kg−1) and 2.55-times increase in NH4-N content (from 20-51 mg kg−1) (Table 3) has also been reported[58]. The fertigation/ manural value of WW for crop production in different agro-climatic conditions has been well documented[6-8,13]. Earlier research in India had substantiated maximum yield of onion with maximum fertilizer use efficiency (FUE) with the application of 25-times diluted distillery waste along with 100% recommended NPK dose[62].
5. Effect of Waste Water Irrigation on DTPA-extractable Micro-nutrient and Heavy-metal Content
- Waste water contains micro-nutrients and heavy-metals in appreciable amounts[9,23,26,29,30,35,38,39,46,63], but there are many pros and cons associated with their availability to plants. There are studies that have shown the build-up of micro-nutrients and heavy-metals in the soils to a varying extent (Table 5 and 6)[41,54,59,64] after repeated use of WW for irrigation to crops. Elevated levels of different heavy-metals in soils irrigated regularly with WW have also been reported[37,66]. Significant increase in DTPA-extractable Pb and Cd upto 30 cm soil layer with the application of WW, consecutively for 80-years than the soils irrigated with GW has been reported[66]. The plough (0-15 cm) layer of soils of highly industrialized city of Ludhiana (Punjab, India) irrigated largely with sewage effluents are reported to contain 4.21, 3.58, 0.30, 11.9, 25.4 and 49.2 mg L-1 DTPA-extractable Pb, Ni, Cd Zn, Mn and Fe were as compared to 2.76, 0.40, 0.12, 2.10, 8.34, 10.88 mg L-1 in the less industrialized city of Sangrur (Punjab, India) indicating maximum loading of soils of Ludhiana with heavy-metals through sewage irrigation[41]. Likewise sandy soils irrigated with WW are reported to contain 3.2, 122, 129, 186, 22.0, 14.5 and 10.5-fold higher concentrations of DTPA-Fe, Mn, Zn, Cu, Co and Ni, respectively than soils receiving GW as irrigation (Table 6). A study conducted at three sites in Harare (Zimbabwe) to investigate the magnitude of contamination, and annual loadings of soils with Cu, Zn, Cd, Ni, Cr and Pb where WW irrigation was practiced in vegetable gardens for 10-years, reports that heavy-metal concentrations in sandy and sandy–clay soils ranged from 7.0 to 145 mg kg−1 for Cu, 14 to 228 mg kg−1 for Zn, 0.5 to 3.4 mg kg−1 for Cd, <0.01 to 21 mg kg−1 for Ni, 33 to 225 mg kg−1 for Cr and 4 to 59 mg kg−1 for Pb upto 20 cm soil depths[64]. The annual heavy-metal loading rates showed that within 5–60 years, all studied heavy-metals would have exceeded their permitted limits in soils, depending on site[64].In the van region of Turkey, the volcanic soils are reported to contain 2 to 50-fold higher concentration of Cd, Pb, Cu and Co, ~40-fold higher Zn concentration with the application of WW over GW irrigated soils. A metal enrichment factor of Cd (1.8), Cr (1.7), Cu (2.3), Zn (2.0), Pb (1.9) and the metal contamination factor of Cd (2.6), Cr (1.5), Cu (2.0), Zn (1.7), Pb (1.6) in soil that showed the accumulation of toxic metals during the SW irrigation has been reported[65]. The study had reported homogeneous distribution of these heavy-metals in WW irrigation area, but with small-scale heterogeneous spatial distribution.Sewage WW irrigation for consecutive 20-years has resulted in significant build-up of DTPA-extractable Zn (208%), Cu (170%), Fe (170%), Ni (63%) and Pb (29%) in soils over GW irrigated soils, whereas Mn content was depleted by 31%[54]. Fractionation study indicated relatively higher build-up of Zn, Cu, Fe and Mn in bio-available pools of sewage WW irrigated soils, which had bearing on crop production and produce quality. In contrast, however non-significant differences in soil available Pb and Cd content in soils of Jordan with the application of municipal WW even up to 10-years has also been reported. Likewise, inconsistent variation in heavy-metal content of soil with industrial WW application has also been reported[56].
5.1. Effect of Waste Water Irrigation on Total Heavy-metal Content of Soil
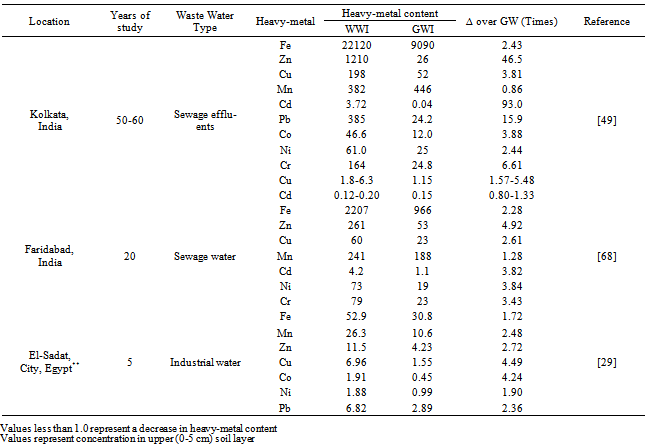
- Spectacular increase in total heavy-metal content of surface soil layer with WW application has been documented (Table 7). Large addition of heavy-metals through repeated WW irrigation of soils have made these differences in comparison to control/soils irrigated with GW (Table 5 and 6). A long-term study on the use of sewage WW in soils of Calcutta (India) reported 2.43, 46.5, 3.81, 0.86, 93.0, 15.9, 3.88, 2.44 and 6.61-fold increase in total-Fe, Zn, Cu, Mn, Cd, Pb, Co, Ni and Cr concentration in comparison to soils receiving GW for irrigating the crops (Table 7)[49]. A considerable build-up of 1241 mg Fe kg-1, 208 mg Zn kg-1, 37 mg Cu kg-1, 53 mg Mn kg-1, 3.1 mg Cd kg-1, 54 mg Ni kg-1 and 56 mg Cr kg-1 in surface soil layer with WW irrigation over GW irrigation has been reported[68]. The accumulation of heavy-metals in the surface soil layers may be the result of sorption reactions of negatively charged soil colloids for these cationic heavy-metals.
5.2. Effect of Waste Water Irrigation on Profile Distribution of Heavy-metals
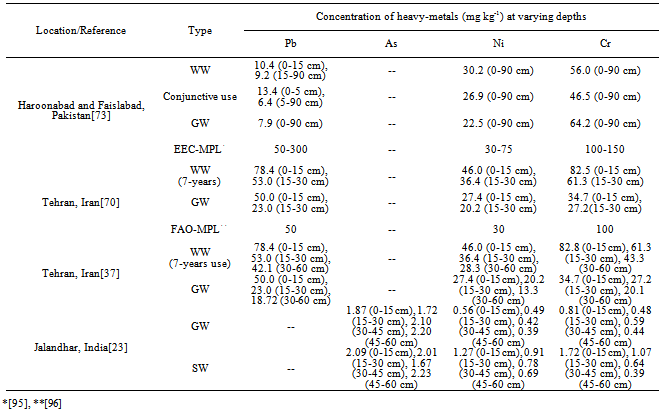
- Heavy-metals being extremely immobile and persistent in environment and of non-biodegradable in nature, tended to accumulate mainly in the surface soil layer and their content decreased down the profile[23,37,55,69,70]. Table 8 report data on profile distribution and accumulation ofheavy-metals from different studies, revealed their surface (upto 15 cm layer) build-up than in the sub-surface soil layers.After a 36-years long-term use of domestic sewage WW for irrigation, there was an accumulation of heavy-metals in surface (0-30 cm) soil layers[53]. Likewise, a study in Vertisols irrigated for over 50-years with an un-treated municipal WW, reported elevated levels of DTPA-extractable Cd, Co, and Ni in the cultivated layer (0-15 cm) of the soil as compared to lower layers[71]. The long-term in-situ accumulation of Cr and Ni in the soil profile of a large-scale effluent recharge after 24-years of WW in the Coastal Plain of Israel has also been reported[72]. The effluent recharge led to measurable accumulation, relative to the pristine soil, of Ni in the 0 to 400 cm soil profile, with concentration increases of 0.3 to 1.3 mg kg–1. Chromium concentration increased by 3.1 to 7.3 mg kg–1 in the zero to 100 cm horizon and 0.9 to 2.3 mg kg–1 at deeper horizons. In an another study, a significant accumulation of Pb within top 0-15 cm soil layer as a consequence of 100% WW treated soils, in contrast to Ni, Co and Cr that remained relatively uniform throughout the soil profile with mean (n=6) concentration of 30.0 mg Ni kg-1, 12.3 mg Co kg-1 and 56.3 mg Cr kg-1 soil has been reported (Table 8)[73]. Infect, the vertical distribution of heavy-metals due to WW irrigation has been reported to vary from element to element and soil texture (Table 8)[23].
| |||||||||||||||||||||||||||||||||||||||||||||||||||||||||||||||||||||||||||||||||||||||||||||||||||||||||||||||||||||||||||||||||||||||||||||||||||||||||||||||||||||||||||||||||||||||||
|
|
|
6. Effect of Waste Water Irrigation on Yield and Quality
6.1. Crop Yield
- Waste waters contain valuable plant nutrients and thus its reuse in agriculture serves as an important source of nutrients and irrigation water for crops. Better crop growth particularly of leafy vegetable like cauliflower, cabbage, spinach etc. grown on fields receiving sewage WW have been achieved[74], in contrast to radish, which is more sensitive to WW[75]. The results of many studies on the use of WW for long period of time have recapitulated significant increased in crop yields than GW irrigated fields. Significantly higher onion yield and maximum fertilizer use efficiency from plots fertilized with 40kg N, 20kg P2O5 and 20kg K2O ha-1 dose conjointly with distillery effluents (25-times diluted) over GW irrigated plots has been reported[62]. A significant augmentation (3.38 g pot-1 to 8.85 g pot-1) in dry matter yield of barseem (Trifoliam sp.) in pots irrigated with sewage WW than GW irrigated pots[76] signifies the essential nutrient supplementation from WW. The field experiments conducted on the use of WW for irrigation to maize, sunflower, groundnut and soybean registered 19.3, 29.9, 5.9 and 4.8% higher grain yield, respectively over fields irrigated with GW (Table 9)[77].A favourable effect of treated paper and pulp industry effluents on maize, barley and wheat grown in coarse textured soil has also been reported in India[78]. The yield increase from 6.9 to 13.9% in different sugarcane varieties grown with WW over GW irrigation has been recorded[77]. Likewise, a significant increase in barley biomass with municipal WW irrigation application consecutively for 5-years over control, in contrast to lower barley biomass from fields irrigated with WW for consecutively for 10-years has been reported[9]. The study has shown that barley biomass was still higher over control, albeit of decline in biomass after 5-years of field application[9]. An another long-term experiment have shown that sewage WW irrigation had lead to highest grain yield of wheat, rice and cotton by 23, 46 and 50% than GW irrigation[79]. A gradual increase in peanut pod yield has also been reported with the application of WW upto 50% concentration in effluent from textile industry[36].On the contrary, however, yield suppressing trends (~40% yield decline) with distillery effluent irrigation fields has also been reported[38]. Average productivity of rice and wheat from fields irrigated with fresh GW to around 48.1 q ha-1 and 8.37 q ha-1 in comparison to fields irrigated with distillery effluents to 27.8 and 6.89 q ha-1, respectively has been reported[38].
6.2. Heavy-metal Content
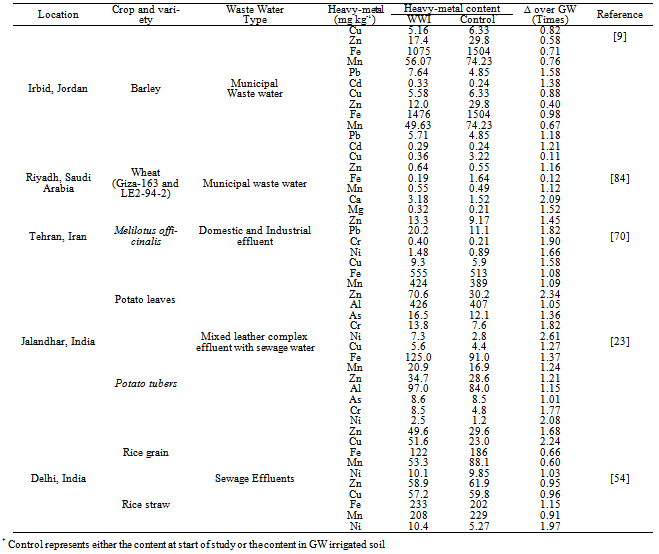
- Plant species differed widely (Table 9 and 10) with respect to their bio-accumulation of heavy-metals and micro-nutrients[80-84]. Heavy-metal and micro-nutrients content in the economic plant parts have been found to be higher[85]. Spinach has been found to accumulation higher amount of Pb, Cr and Cd compared to Trifolium alexandrinum L[12]. Root crops such as potato, carrot, turnip, and radish generally accumulates lower concentrations of pollutant elements than leafy vegetables such as spinach, methi (Trigonella cornuculata), menthe (Triginella foenumgraecum) and mint (Mentha piprita)[81]. Higher concentrations of Zn and Cu, slight increase in Ni content and lower concentration of Mn in rice grains harvested from sewage WW irrigated fields have been registered than GW irrigated fields[54]. However, the tissue metal concentrations in some cereals, millet and vegetable crops grown in peri-urban areas of Delhi (India) were well below the generalized critical levels of phytotoxicity[54].Heavy-metal accumulation in leaves of different plant species grown on soils irrigated with industrial WW for consecutive 5-years followed the order: jojoba> khaya> axodium>Italian cypress[29]. In Zimbabwe, maize and Tsunga grown with sewage WW irrigation were observed to be heavily contaminated with Cd, Cu, Pb and Zn[86]. Tsunga leaves contained 3.68 mg Cd kg−1, over 18-times the MPL of EU standards (0.2 mg kg−1); Cu concentrations were 111 mg kg−1, 5-times the EU Standard (20 mg kg−1); concentrations of Pb were 6.77 mg kg−1, over 22-times the MPL of EU standards and UK guidelines (0.3 mg kg−1); Zn concentrations were 221 mg kg−1, over 4-times the guideline value (50 mg kg−1). They reported that the other plants viz. beans, maize, peppers and sugarcane also contained concentrations of heavy-metals above the MPL of EU standards[86]. The edible portion of Beta vulgaris (Palak)-a highly nutritious leafy vegetable in the sub-urban areas of Varanasi (India) has been reported to contain Cd in higher concentration during the summer season than the MPL of the Indian standard, whereas Pb and Ni concentrations were higher in summer and winter seasons[69]. The fruit and vegetable samples were found to contain 3.5- to 340-fold higher amounts of the heavy-metals (Co, Cd, Pb, Mn, Ni and Cu) from soils irrigated with WW than irrigated with GW[67]. In an another study in peri-urban areas of Delhi (India), higher Zn, Pb and Cd levels except Cu than the WHO limits in spinach and okra irrigated with industrial effluents has been reported[87]. Vegetables grown on un-contaminated soils contains 8.1-17 mg Cu kg-1, 4.3-7.3 mg Pb kg-1, 44.7-85.5 mg Zn kg-1, and 109.2 mg Mn kg-1, than grown in contaminated soils that contains 9.0-36.5 mg Cu kg-1, 8.5-30.2 mg Pb kg-1, 48.1-181 mg Zn kg-1 and 109.1-183.0 mg Mn kg-1[4]. The study on the use of sewage WW for irrigation on the uptake and translocation of Hg in maize from soils irrigated historically with sewage effluent, and one irrigated solely with GW revealed that Hg content in roots was positively correlated with soil Hg content (r = 0.95) and the transfer coefficients between roots and stems were significantly higher in the control site[88]. The concentration of Pb, Cr and Ni has been reported to exceed their permissible levels in roots of yellow sweet clover Melilotus officinalis irrigated with WW[70].Significantly higher heavy-metals accumulation in spinach than okra fruit has been observed[89]. The heavy-metal content in these crops followed the order sewage WW>mixed sewage WW and GW>GW[89]. In general however, heavy-metal accumulation and absorption by plants grown in contaminated environment followed the order of magnitude of greater availability in the surrounding medium[80,83]. Direct significant relationships between soil heavy-metal content and heavy-metal uptake by plants and concentration of heavy-metals in plants showed direct significant relationship with heavy-metal concentration in the waste effluents[12].Even the different plant parts of same specie differed appreciably from one-another in their ability for absorption, translocation and accumulation of heavy-metals and micro-nutrients[82,90] (Table 10). Rice cultivated with industrial WW in Pakistan, retained Cu absorbed from soils mainly in the straw and translocates a very minute amount of it to the grains[55]. In comparison, Cd concentration in straw (0.135 to 0.370 mg kg-1) and grains (0.116 to 0.370 mg kg-1) of rice grown at three different locations remained nearly the same[55]. Higher tendency of cauliflower curds to accumulate Zn, Cu, Fe, Mn, Pb and Ni than cauliflower leaves has been reported[90]. The concentration of elements in cauliflower leaves was 39.5, 4.1, 149, 33.7, 0.97 and 1.1 mg kg-1 in sewage WW irrigated soils than 31.6, 3.6, 101, 29.9, 1.28 and 0.57 mg kg-1 in GW irrigated soils. However, the concentration of these heavy-metals in cauliflower curds was 49, 2.9, 149.4, 22.6, 1.87 and 1.93 mg kg-1, respectively in sewage WW irrigated soils and 39.3, 4.4, 114.4, 19.8, 1.47 and 1.03 mg kg-1, respectively in GW irrigated soils[90]. In Eichhhornia, the mobility of Ca, Zn and Cu remained restricted, while Mn, Pb, Cr, Ni and Cd were easily translocated from lower to upper plant parts[90]. Higher concentration of heavy-metals in potato leaves (non-edible portion) than tubers (edible portion) as a result of WW irrigation of light textured soils of Punjab (India) has been reported[23]. The absorption of Cr and Ni by potato plants and their distribution in edible and non-edible portions of plant was, however proportional to its build-up in soil[23].
| ||||||||||||||||||||||||||||||||||||||||||||||||||||||||||||||||||||||||||||||||||||||||||||||||||||||||||||||||||||||||||||||||||||||||
7. Conclusions
- 1. Based on literature thus reviewed, it can be concluded that some industrial effluents hold great promise for the improvement of soil fertility and crop yields, if proper treatment and management practices are adopted.2. Literature confirms that the WW can effectively increase water resource for irrigation but there is a need for regular monitoring of the heavy-metal and other pollution related parameter concentrations in soil, plants and ground water.3. Since WW are rich source of micro-nutrients and heavy-metals, the repeated application of WW may accumulate appreciable quantities of heavy-metals and micro-nutrients in the soil. Therefore, such fields need periodic estimates to monitor the build-up of these nutrients.4. Literature reviewed reveled that safe utilization of WW for irrigation to crops requires several precautionary measures viz. adequate dilution, selection of crop etc. Besides, soil physical properties needs to be reviewed periodically for long-term sustainability of the system.5. Based on the literature, thus reviewed, it can be concluded that proper management of WW irrigation and periodic monitoring of soil, WW and crop quality are required to ensure successful, safe and long-term use of WW for irrigation.6. It is desirable that highly contaminated WW from some industries is made to undergo suitable treatment in WW treatment plants, before its use for irrigation purpose.
References
| [1] | R. A. Buchholz, Principles of environmental management. The Greetings of Business. 2nd Prentice-Hall, London, U.K., 1998. |
| [2] | Fakayode, S.O., 2005, Impact of industrial effluents on water quality of the receiving Alaro River in Ibadan, Nigeria, Ajeam-Ragee, 10, 1-13. |
| [3] | S. K. Ghimire, Evaluation of industrial effluents toxicity in seed germination and seedling growth of some vegetables, M.Sc. Dissertation, Central Department of Botany (1994), Tribhuvan University, Kirtipur, Kathmandu, Nepal, 1994. |
| [4] | Cheraghi, M., Lorestani, B., Yousefi, N., 2009, Effect of waste water on heavy metal accumulation in Hamedan Province Vegetables., International J. Bot., 5, 190-193. |
| [5] | Singh, K. P., Mohon, D., Sinha, S., Dalwani, R., 2004 Impact assessment of treated/untreated wastewater toxicants discharge by sewage treatment plant on health, agricultural and environmental quality in waste water disposal area., Chemosphere 55, 227-255. |
| [6] | Campbell C. A., and Davidson H. R., 1983, Effect of temperature, nitrogen fertilization and moisture stress use by Manitou spring wheat, Can. J. Plant Sci., 59, 603-626. |
| [7] | Burns, J. C., Westerman, P., King, L. D., Cummings, G. A., Overcash, M. R., Goode, L., Swine lagoon effluents applied to coastal Bermuda grass: 1. Forage yield, quality and element removal, Journal of Environmental Quality 14 (1985), 9-14. |
| [8] | Chaw, R., and Reves, A. S., 2001, Effect of waste water on Menthe piperita and Spinaceal oleraceae., J. Environ. Biol., 51, 131-145. |
| [9] | Rusan, M. J. M., Hinnawi, S., Rousan, L., 2007, Long term effect of waste water irrigation of forage crops on soil and plant quality parameters., Desalinization 215, 143-152. |
| [10] | M. Strauss, and U. J. Blumenthal, Human waste use in agriculture and aquiculture: utilization practices and health perspectives. IRCWD Report 09/90. International Reference Centre for waste Disposal (IRCWD), Duebendorf, Germany, 1990, p. 48. |
| [11] | P. S. Minhas, J. S. Samra, Wastewater use in peri-urban agriculture impacts and opportunities. Technical Bulletin 02/2004. Central Soil Salinity Research Institute (CSSRI), Karnal-132 001, Haryana, India, 2004. |
| [12] | Dheri, G. S., Brar, M. S., Malhi, S. S., 2007, Heavy-metal concentration of sewage-contaminated water and its impact on underground water, soil and crop plants in Alluvial soils of Northwestern India., Communication in Soil Sci. & Plant Anal. 38, 1353-1370. |
| [13] | R. Chhabra, Sewage water, utilization through forestry. National Printers, Old Market, West Patel Nagar, New Delhi, India (1989), p: 1-9. |
| [14] | FAO (Food and Agriculture Organization), Soil survey investigations for irrigation. Soil Bull.-42, Rome (R. G. Feachem, 1983 ed.) Sanitation and disease-health aspects of excreta and waste water management. John Wiley & Sons, Chic Ester, England, 1976. |
| [15] | Government of Jordan, Technical Regulations for Reclaimed Domestic Waste Water JS893/2002, Jordan Institution for Standards and Meteorology, Amman, Jordan, 2003. |
| [16] | Gazette of Mauritius Standards for discharge of industrial effluents into a waste water system, Regulations-2004, Mauritius, 2004. |
| [17] | EPA/ROC, Final reports of heavy metals contents in Taiwan agricultural soils. Vol.-4 Taiwan, ROC, 1989. |
| [18] | WHO (World Health Organization), Guidelines for water quality. Health and other supporting information. WHO, Geneva (1984) 2¸ p.100. |
| [19] | IEPO, Iranian Environmental Protection Organization, The standards for discharging effluent water. The Research Deputy of Iranian Environmental Protection Organization, 1994. |
| [20] | NEQS, National Environmental Quality Standards: Gazette of Pakistan, Extra-ordinary, Environmental and Urban Affairs Division, Pakistan Environmental Protection Agency: Islamabad, Pakistan, 1993. |
| [21] | E. Agreda, The problematic of the use of polluted water in agriculture under irrigation-Case study Rocha River-La Mayca and Caramarca areas, M.Sc. Thesis, Wageningen University, The Netherlands, 2000. |
| [22] | Ana, G. R. E. E. ., and Sridhar, M. K. C., 2002, Soil quality near a chemical fertilizer industry at Port Harcourt, Nigeria, AJAM/RAGEE 4, 50-57. |
| [23] | Brar, M. S., Khurana, M. P. S., and Kansal, B. D., 2002, Effect of irrigation by untreated sewage effluents on the micro and potentially toxic elements in soils and plants. In Proc 17th World Congress of Soil Science held at Bangkok, Thailand from August 14-21, 2002, Volume-IV, Symposium no.-24, 2002, p. 198(1)–198(6). |
| [24] | Emongor, V., Nkegbe, E., Kealotswe, B., Koorapetse, I., Sankwasa, S., Keikanetswe, S., 2005, Pollution indicators in Gaborone Industrial effluents, J. Applied Sci. 5, 147-150. |
| [25] | Phiri, O., Mumba, P., Moyo, B. H. Z., Kadewa, W., 2005 Assessment of the impact of industrial effluents on water quality of receiving rivers in urban areas of Malawi., International J. Science & Technology 2, 237-244. |
| [26] | Hargopal-Singh, Dhanwinder-Singh, Singh, K. G., and Pritpal-Singh, Recycling potential of sludge produced by Coca-cola bottling plants in Agriculture. Annual progress report (2005-06), Department of Soils, Punjab Agricultural University-Ludhiana, Punjab, India, 2006. |
| [27] | Verma, V. K., Gupta, R. K., and Rai, J. P. N., 2005, Biosorption of Pb and Zn from pulp and paper industry effluent by water hyacinth (Eichhornia crassipes)., J. Scientific & Ind. Res., 64, 778-781. |
| [28] | Nasrullah, R., Naz, H., Bibi, M., Iqbal, M., and Ilyas-Durrani, 2006, Polluted land in industrial effluent and ground water of gadoon Amazai industrial estate (GAIE) SWABI, NWFP., J. Agri.& Biol. Sci.,3, 18-24. |
| [29] | El-Arby, A. M., and Elbordiny, M .M., 2006, Impact of reused wastewater for irrigation on availability of heavy metals in sandy soils and their uptake by plants., J. Applied Sci. Res., 2, 106-111. |
| [30] | Osaigbovo, A., Ulamen, O., and Ehi-Robert, 2006, Influence of pharmaceutical effluent on some soil chemical properties and early growth of maize (Zea mays L)., African J. Biotech., 5, 612-617. |
| [31] | Sial, R. A., Chaudhary, M. F., Abbas, S. T., Latif, M. I., and Khan, A. G., 2006, Quality of Effluents from Hattar Industrial Estate., J. Zhejiang Uni. Sci., 7, 974-980. |
| [32] | Z. A. Zakria, Z. Zakria, S. Surif, W. A. Ahmad, Bioremediation of Cr (VI)-containing electroplating waste water using Acinetobacter sp.. Paper Presented in International Conference on Environment (ICENV-2006). November-2006, Penang, Malaysia, 2006. |
| [33] | El-Hady, B. A. A., 2007, Compare the effect of polluted and river Nile irrigation water on contents of heavy-metals of some soils and plants, Res. J. Agri. & Biol., 3, 287-294. |
| [34] | Pandey, S. K., Tyagi, P., and Gupta, A. K., 2007, Physico-chemical analysis and effect of distillery effluent on seed germination of wheat (Triticum aestivum), pea (Pisum sativum) and lady’s finger (Abelmoschu esculentus)., ARPN J. Agric. & Biol. Sci., 2, 35-40. |
| [35] | Rahmani, H. R., and Rezaer, R., 2007, Effect of industrial effluents of Zob-Han on soil, water and vegetable plants., J. Applied Sci., 17, 2519-2522. |
| [36] | Saravanamoorthy, M. D., and Ranjitha-Kumari, B. D., 2007, Effect of textile water on morphology and yield on two varieties of peanut (Arachis hypogea L.)., J. Agric. Tech., 3, 335-343. |
| [37] | Aghabarati, A., Hosseini, S. M., and Maralian, H., 2008, Heavy metal concentration of soil and olive trees (Olea europaea L.) in Suburban areas of Tehran, Iran., Res. J. Environ. Sci., 2, 323-329. |
| [38] | Ale, R., Jha, P. K., and Belbase, N., 2008, Effects of distillery effluents on some agricultural crops: A case of environmental injustice to local farmers in Khajura VDC, Banke., Scientific World, 6, 68-75. |
| [39] | Nagajyoti, P. C., Dinakar, N., Prasad, T. N. V. K. V., Suresh, C., and Damodharam, T., 2008, Heavy metal toxicity: Industrial effect on Groundnut (Arachis hypogaea L.) seedlings, J. Applied Sci. Res., 4, 110-121. |
| [40] | Akan, J. C., Moses, E. A., Ogugbuaja, V. O., and Abah, J., 2007, Assessment of tannery industrial effluents from Kano metropolis, Kano State, Nigeria., J. Applied Sci., 7, 1788-2793. |
| [41] | M. P. S. Khurana, V. K. Nayyar, R. L. Bansal, and M. V. Singh, Heavy metal pollution in soils and plants through untreated sewage water. In: V.P. Singh, R.N. Yadava, (eds.) Ground Water Pollution. Proceedings of the International conference on Water and Environment (WE-2003), Bhopal. Allied Publishers Pvt. Limited. New Delhi, India, 2003. p. 487-495. |
| [42] | B. D. Kansal, Efeect of domestic and industrial effluents on agricultural productivity. In: G.S. Dhaliwal, B. D. Kansal, (ed.) Management of agricultural Pollution in India. Commonwealth Publishers, New Delhi, India, 1994. p. 157-176. |
| [43] | S. T. Abbas, Salt tolerance in Pakistan Rice varieties through tissue culture. Thesis Doctoral. M.D.S. University, Ajmer, India, 1991. |
| [44] | R. Bhagat, Water in tannery polluted industries. Indian Express, May 27th, 1992. Chandigarh, India, 1992. |
| [45] | Baruah, A. K., Sharma, R. N., and Borah, G.C., 1993, Input of mills and distillery effluent on water quality of river. Gelabi, Assam., Ind. J. Environ. Health, 35, 288-293. |
| [46] | R. P. Narwal, A. P. Gupta, A. Singh and S. P. S. Karwasra, Pollution potential of some sewage waters of Haryana. In: S.K. Arora, M. Singh, R.P. Aggarwal. (eds.) Recent Advances in Environmental Pollution and Management. H.A.U. Hisar, India, 1990, p. 121-126. |
| [47] | H. F. L. David, G.L. Bela, and A. B. Paul, Environmental Engineers Handbook. 2nd Edition Lewis Publishers, New York, 1996. |
| [48] | Gupta, I. C., and Jain, B. L., 1992, Salinization and alkalinization of groundwater pollution due to textile hand processing industry in Pali., Current Agric., 16, 59-62. |
| [49] | S. K. Gupta and A. Mitra, In: Advances in Land Resource Management for 21st Century, Soil Conservation Society of India, New Delhi, India, 2002. p. 446-460. |
| [50] | A. Morugan, Gracia-Orenes, J. Mataix-Solera, I. Gomez, V. Arcenegui, M.A. Navarro, J. Mataix-Beneyto, Short-term effects of treated waste water irrigation on soil. Two years of study monitoring a Mediterranean calcareous soil, Geophysical Research Abstracts 11, 2009. |
| [51] | Schipper, L. A, Williamson, J. C., Kettles, H. A., Speir, T. W., 1996, Impact of land applied tertiary-treated effluents on soil biochemical properties., J. Environ. Qual., 25, 1073-1077. |
| [52] | B. D. Kansal and M. P. S. Khurana, Extent of contamination of alluvial soils with cadmium. In. 2nd International conference on Contaminants in soil environment in Australia –Pacific Region, New Delhi, India, 1999. p. 309-310. |
| [53] | Yadav, R. K., Goyal, B., Sharma, R. K., Dubey, S. K., Minhas, P. S., 2002, Post-irrigation impact of domestic sewage effluent on composition of soils, crops and ground water-A case study., Environ. International, 28, 481-486. |
| [54] | Rattan, R. K., Datta, S. P., Chhonkar, P. K., Suribabua, K., Singh, A. K., 2005, Long-term impact of irrigation with sewage effluents on heavy metal content in soils, crops and groundwater-A case study., Agriculture, Ecosystems & Environ., 109, 310-322. |
| [55] | Nawaz, A., Khurshid, K., Arif, M. S., and Ranjha, A. M., 2006, Accumulation of heavy metals in soil and rice plant (Oryza sativa L.) irrigated with industrial effluents, International J. Agric. & Bio., 3, 391-393. |
| [56] | Mohammad, M. J., and Mazahreh, N., 2003, Changes in soil fertility parameters in response to irrigation of forage crops with secondary treated wastewater, Commun. Soil Sci. Plant Anal., 34, 1281-1294. |
| [57] | Wang, T. S. C., San-Yae Cheng, and Tung, H., 1967, Dynamics of soil organic acids, Soil Sci., 104, 138-44. |
| [58] | Hayes, A. R., Mancino, C. F., and Pepper, L.L., 1990, Irrigation of Turf grass with Secondary Sewage Effluent: I. Soil and Leachate Water Quality., Agron. J., 82, 939-943. |
| [59] | Zhang, Y. L., Dai, J. L., Wang, R. Q., and Zhang, J., 2008, Effects of long-term sewage irrigation on agricultural soil microbial structural and functional characterizations in Shandong, China., European J. Soil Biol., 44, 84-91. |
| [60] | J.K Friedel, T. Langer, C. Siebe, K. Stahr, Effects of long-term waste water on soil organic matter and microbial biomass and its activities in central Mexico, Biology and Fertility of Soils 31 (2000), 414-421. |
| [61] | C. J. McClean, M. S. Cresser, R. P. Smart, C. Aydinalp, and A. V. Karkat, Unsuitable irrigation practices in the Bursa plain, Turkey. In: Diffuse Pollution and Basin Management: M. Bruen, (ed.). Proceedings of the 7th International Specialized IWA Conference, International Water Association, August 17-21st, 2003, Dublin, Ireland, 2003. p. 60-65. |
| [62] | Zalawadia, N. M., Patil, R. G., and Raman, S., 1996, Effect of distillery waste water with fertilizer levels on onion yield and soil properties., J. Ind. Soc. Soil Sci., 44, 802-04. |
| [63] | Subramaniyan, V. K., Nooruddin, T. and Chokkaiya, M., Biodiversity of cynobacteria in industrial effluents, Acta Botanica Malacitana, 32, 27-34. |
| [64] | Mapanda, F., Mangwayana, E. N., Nyamangara, J., and Giller, K. E., 2005, The effect of long-term irrigation using wastewater on heavy metal contents of soils under vegetables in Harare, Zimbabwe, Agriculture, Ecosystems & Environ., 107, 151-165. |
| [65] | Liu, W., Zhao, J., Ouyang, Z., Söderlund, L., and Liu,G., 2005, Impacts of sewage irrigation on heavy metal distribution and contamination in Beijing, China., Environ. International, 31, 805-812. |
| [66] | C. Siebe, Nutrient inputs to soil and their uptake by alfalfa through long-term irrigation with untreated sewage effluent in Mexico, Soil Use Management, CAB International Oxford, 1998. p. 119-122. |
| [67] | Kürsad Türkdo, M., Kilicel, F., Kara, K., Tuncer, I., and Uygan, I., 2003, Heavy metals in soil, vegetables and fruits in the endemic upper gastrointestinal cancer region of Turkey., Environ. Toxicology & Pharmacology, 13, 175-179. |
| [68] | Anonymous, Annual Progress Report (2000-03). NATP-MM Project on “Use of Urban and Industrial Effluents in Agriculture”. CSSRI, Karnal-Haryana, India, 2004. |
| [69] | Sharma, R. K., Agrawal, M., and Fiona, A., 2007, Heavy metal contamination of soil and vegetables in suburban areas of Varanasi, India., Ecotoxicology & Environ. Safety, 66, 258-266. |
| [70] | Amiri, S. S., Maralian, H., and Aghabarati, A., 2008, Heavy metal accumulation in Melilotus officinalis under crown Olea europaea L. forest irrigated with wastewater., African J. Biotechn., 7, 3912-3916. |
| [71] | Schirado, T., Vergara, L., Schalscha, E. B., Pratt, P. F., 1986., Evidence for movement of heavy metals in a soil irrigated with untreated wastewater., J. Environ. Qual., 15, 9-12. |
| [72] | Lin, C., Negev, I., Eshel, G., and Banin, A., 2008, In Situ Accumulation of Copper, Chromium, Nickel, and Zinc in Soils Used for Long-term Waste Water Reclamation, J. Environ. Qual., 37, 1477-1487. |
| [73] | J. H. J. Ensink, R. W. Simmons, and Van der Hoek, Waste water use in Pakistan: The cases of Haroonabad and Faislabad. International Water Management Institute (IWMI) Research Report. South Asia Regional Office, Patanch, 2003. |
| [74] | Murtaza, G., Gafoor, A., Qadir, M., and Rashid, M. K., 2003, Accumulation and bioavailability of Cd, Co and Mn in soils and vegetables irrigated with city effluent, Pakistan., J. Agric. Sci., 40, 18-24. |
| [75] | Bakhsh, K., Ashraf, M., and Alam, M. W., 2005, Effect of poor quality of ground water on carrot production: A comparative study, J. Agric. Social Sci.,1, 38-40. |
| [76] | Singh, R. P., Singh, V., and Shukla, A. K., 1991, Yield and heavy metal contents of Berseem as influenced by sewage water and refinery effluent., J. Ind. Soc. Soil Sci., 39, 402-404. |
| [77] | C. Udayasoorian, P. Devagi, P. P. Ramaswami, Case study on the utilization of paper and pulp mill effluent irrigation for field crop. In: Proceedings of Workshop on ‘Bioremediation of Polluted Habitats’, 1999. p. 71-73. |
| [78] | Juwarkar, A. S., and Subramayam, P. V. R., 1986, Impact of pulp and paper mill waste water on crop and soil, Water Sci. Tech., 19, 693-700. |
| [79] | Sharma, V. K., and Kansal, B. D., 1984, Effect of N, farm yard manure, town refuse and sewage water on the yield and N content of Maize, J. Ecol., 11, 77-81. |
| [80] | Alloway, B. J., Jackson, A. P., and Morgan, H., 1990, The accumulation of cadmium by vegetables grown on soils contaminated from variety of sources, Science of the Total Environ., 91, 233-235. |
| [81] | Hundal, H. S and Arora, C. L., 1993, Studies on toxic trace elements in vegetables and corresponding soils., Ind. J. Horti,. 50, 273-278. |
| [82] | Barman, S. C., Kishu, G. C., Salve, P. R., Misra, D., Sahu, R. K., Ramteke, P. W., and Bhargawa, S. K., 2001, Assessment of industrial effluent and its impact on soil and plant., J. Environ. Biol., 22, 251-256. |
| [83] | Kim, I. S., Kang, H. K., Johnson-Green, P., and Lac, E. J., 2003, Investigation of heavy-metal accumulation in Polygonum thunbergii for phytoextraction., Environ. Poll., 126, 235-243. |
| [84] | Alderfasi, A., 2009, Agronomic and economic impacts of reuse secondary treated wastewater in irrigation under arid and semi-arid regions., World J. Agric. Sci., 5, 369-374. |
| [85] | Adhikari, S., Mitra, A., Gupta, S. K., and Banerjee, S. K., 1998, Pollutant metal contents of vegetables irrigated with sewage water., J. Ind. Soc. Soil Sci., 46, 153-155. |
| [86] | Muchuwetis, M., Birkett, J. W., Chinyanga, E., Zvauya, R., Scrimshaw, M. D., and Lester, J. N., 2006, Heavy metal content of vegetables irrigated with mixtures of wastewater and sewage sludge in Zimbabwe: Implications for human health., Agriculture, Ecosystems & Environ., 112, 41-48. |
| [87] | Singh, S., and Kumar, M., 2006, Heavy metal load of soil, water and vegetables in peri-urban Delhi, Environ. Monitoring & Assess, 120, 79–91. |
| [88] | Rothenberg, S. E., Du, X., Zhu, G., and. Jay, J. A., 2007, The impact of sewage irrigation on the uptake of mercury in corn plants (Zea mays) from suburban Beijing., Environ. Poll, 149, 246-251. |
| [89] | Lone, M. I., Saleem, S., Mahmood, T., Saifullah, K., and Hussain, G., 2003, Heavy metal content of vegetables irrigated by sewage/tubewell water., International J. Agric.& Biol., 4, 533-535. |
| [90] | Brar, M. S., and Arora, C. L., 1997, Concentration of micro-elements and pollutant elements in cauliflower (Brassica oleracea conniver, botrytis var. bortrytis)., Ind. J. Agric. Sci., 67, 141-143. |
| [91] | ISI (Indian Standard Institution). Specifications for drinking and irrigation waters. IS: 10500. New Delhi, India, 1983. |
| [92] | CPCB (Central Pollution Control Board), Pollution Control Acts. Rules and Notifications issued there under. 4th Edition, New Delhi; Central Pollution Control Board, Ministry of Environment and Forests, Government of India, 2001. |
| [93] | M. S. Brar, A. P. Singh, and C. L. Arora, Effect of effluent contaminated water on micro and potentially toxic elements in soils and potato plant. Scientific Registration No.-168, Number of Symposium: 21, 1998. |
| [94] | NEMA (Natural Environmental Management Authority), Ministry of Natural Resources Environmental standards and Preliminary Environmental Impact assessment for water quality and discharge of effluents into water/land. Uganda. Kampala. {Online}. Available. http://www.nemaug.org/monitoring/preliminary%20EIA%20&20standards%20for%20water.pdf. |
| [95] | EEC-MPL, (European Economic Commission-maximum permissible levels) Maximum permissible levels for heavy metals. Available at http://www.idrc.ca/en/ev-68336-201-1-DO_TOPIC.html., 1997. |
| [96] | FAO (Food and Agriculture Organization), Food for the cities. Food and Agriculture Organization of United Nations, Rome, Italy, 2000. p. 33. |