-
Paper Information
- Previous Paper
- Paper Submission
-
Journal Information
- About This Journal
- Editorial Board
- Current Issue
- Archive
- Author Guidelines
- Contact Us
Resources and Environment
p-ISSN: 2163-2618 e-ISSN: 2163-2634
2012; 2(3): 107-115
doi: 10.5923/j.re.20120203.05
Unplanned Urban Growth and its Effect on the Sustainability
 Abstract
 Reference
 Full-Text PDF
 Full-Text HTML
Carlos Discoli , Irene Martini
Research Group 1. IIPAC (Built Environment Policy Research Institute). FAU (School of Architecture and Planning). UNLP (National University of La Plata). La Plata. Street 47 N ° 162, DC 478. (1900), Argentina
Correspondence to: Irene Martini , Research Group 1. IIPAC (Built Environment Policy Research Institute). FAU (School of Architecture and Planning). UNLP (National University of La Plata). La Plata. Street 47 N ° 162, DC 478. (1900), Argentina.
| Email: |  |
Copyright © 2012 Scientific & Academic Publishing. All Rights Reserved.
This work exposes a methodology to assess and to identify areas of greater urban vulnerability due to imbalances generated by spontaneous urban growth. The residential sector, basic infrastructure services, occupation in the territory, its evolution in terms of growth, energy needs and their respective emission of pollutants are evaluated. In relation to the basic infrastructure services, electricity and natural gas networks are analyzed. The offer is analyzed from its qualities, with the coverage of each network and the users’ opinions (demand). With the obtained results, maps were built to identify homogeneous areas in order to define the growing unsustainability.
Keywords: Urban growth, Vulnerability, Energy, Urban consolidation, Environment
Article Outline
1. Introduction
- The energetic-environment problems raised from the ´70 decade and the globalization effects have significantly impacted in the organization and reorganization process of the territory, as well as the degradation of the Habitat and of the natural resources. Among the main consequences we can mention the socio-spatial fragmentation, in particular in the urban area, establishing significant imbalances and inequalities mainly in the undeveloped countries[1]. In Argentina this fragmentation process, causes distortions, in relation to: inefficient management; a significant dispersion and fragmentation of information; and the lack of appropriate tools to systematize data and to develop accurate diagnoses. The consequences involve socio-economic and socio-thermodynamic imbalance problems (interaction between the laws of thermodynamics and the users behaviour), reaching the indiscriminate overexploitation of resources, the inequity of the expenditures, and unsustainable degradation of the environment. In particular, the metropolitan area of La Plata, capital of the Buenos Aires province, conceived as the first planned contemporary city from Argentina, has registered, in spite of the socio-economic crisis of 1983/2001 an unplanned growth of the peri-urban areas. Its consequences have been an uncontrolled growth that modified the original characteristics of the city. That peri-urban growth altered the original hygienists’ precepts of the city, on the basis of its layout, structure and quality of the main urban systems. These socio-spatial transformations altered its compact genesis, becoming in edges areas and diffuse satellites.At an urban scale, in many cases, the deterioration manifests itself in an almost uncontrolled development and in a certain way chaotic, both in physic-environmental and socio-economical aspects. These processes are developed with patterns that do not take account of constraints and opportunities emerged from the climate and the environment. And they have as framework the low quality and efficiency of urban services and infrastructure. All this "as a result, in one hand of the lack of resources and insufficient investment in infrastructure and on the other hand, of the constraints of local governments in their ability to plan, coordinate and manage the city growth"[2]. In consequence, deep and fast transformations that have been and are being made in different sectors, make evident the difficulties experienced by decision-makers in their management and control structures to detect and effectively quantify urban distortions. The documentary basis of the Urban Environment Plan of Buenos Aires city, published in September 1998[3] tried to improve the described situation. It is conformed by a single and large-scale territorial area, which covers the reference situation with mega metropolis features. In a local level, we can consider as a reference, the methodologies developed by our working group involving sectorial information and/or portions of the urban fabric with its multiple dimensions. Projects have been developed that relate institutional policies, technological changes and urban infrastructure and services networks as well as building networks, energy consumption patterns, constructive systems and climatic aspects[4,5]. In this context a methodology for evaluating an Urban Life Quality Model (ULQM) has been developed[6-7-8]. and implemented in which analysis converging strategies intervene pointing to a common purpose[6-9]. This model considers the interaction between the basic services, the infrastructure and environmental aspects, the influenced area, and users’ opinion/perception. The difference between other models[10-11-12-13], is that we have incorporated environmental and energy variables involved in the city functioning, the efficiency in the urban/regional services and the habitant’s opinion/perception considering them as the demand. The results of the ULQM are quantified through indexes and they are located in the territory by maps in a detailed and global scale. Its development and implementation allowed us to assess urban dynamics, its growth and interaction with the environment and the quality of urban life. This methodology proposes to transform the traditional vision of urban management in implementing policies that include innovative actions to generate structural changes in the overall framework of what is called healthy environmentally cities. Such goals are in line with the developed at the World Conference on environment and development, Rio ´92, where the 21st Agenda was approved, within the framework of sustainable development on a global scale. In this Agenda, the need to develop appropriate methodologies for the accurate diagnosis, evaluation and decision-making, implementation of alternative scenarios and reformulation of energy policies were proposed[14]. In this context, this work proposes to analyse the main variables, particularly the socio-energetic, its socio-spatial consequences and the users’ opinions on the phenomena involved in the ULQM[6-15]. Maps of quality were built establishing homogeneous zones that identify aspects of the supply of urban services on infrastructure and coverage, as well as demand requirements considering the perception of users. As a result of the work, areas with greater urban vulnerability are presented, as a consequence of the spontaneous growth in line with the biggest deficits in urban control. These would confirm the growing unsustainability that has been detected in the agglomeration under study, in our case La Plata and its surroundings.
2. Evaluation and Identification of Urban Vulnerability Areas
- We propose to analyze areas of urban vulnerability of the imbalances generated by spontaneous urban growth and its impact on the sustainability of the urban energy services. This arises the following aspects: - Residential sector: We evaluate the territory occupation, its growth evolution, its energy needs, and their respective pollutants emissions; - Basic Infrastructure Services: We consider in this case those relating to cover urban energy demand (Electricity and Natural Gas). As a result, we obtain maps with each service quality level, where the offer is related through the qualities that characterize it, with each network coverage and the users’ opinions (demand). Below, a body of basic variables is analyzed in order to expose the procedures used in the methodology. The interaction displayed on urban maps, show its potentiality in relation to its diversity of possible answers.
2.1. Residential Sector
- The population, in general, is asymmetrically distributed in the territory, and its degree of occupation and settlement levels are considered in what we call the residential sector. Its conformation and distribution in the territory is analyzed, remarking the consolidation characteristics, the socio- energetic structure and its environmental implications.
2.1.1. Population: Population Pyramid, Density and Growth
- The population growth in the last four decades of the 20th century, has been increasing but with a significant slowdown. This was due to the periods corresponding to the last decades which were characterized by a strong emigration abroad, and a significant reduction in the flow of internal emigration between inside and the capital of the province with a strong University offer. Both situations are challenged essentially by the successive of socio-economic crisis in the country, and in particular of the study area. Figure 1 describes the population growth and Figure 2 shows the growth rate (in this case a decrease), by ratifying the non-linearity in the evolution of the population profile.
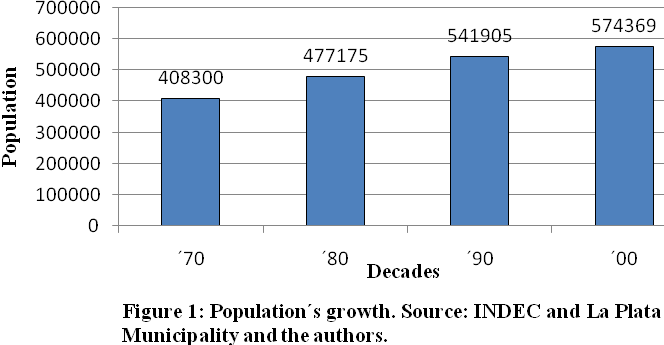 | Figure 1. Population´s growth. Source: INDEC[16] and La Plata Municipality and the authors |
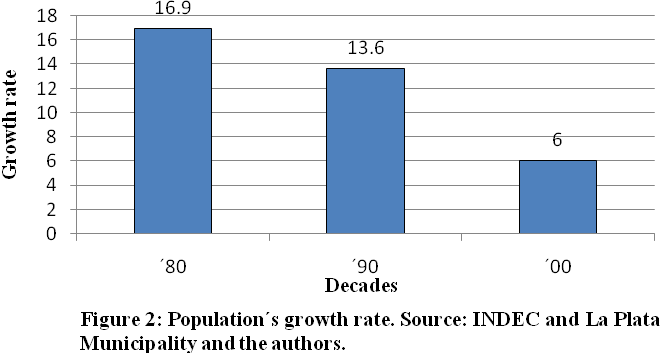 | Figure 2. Population´s growth rate. Source: INDEC and La Plata Municipality and the authors |
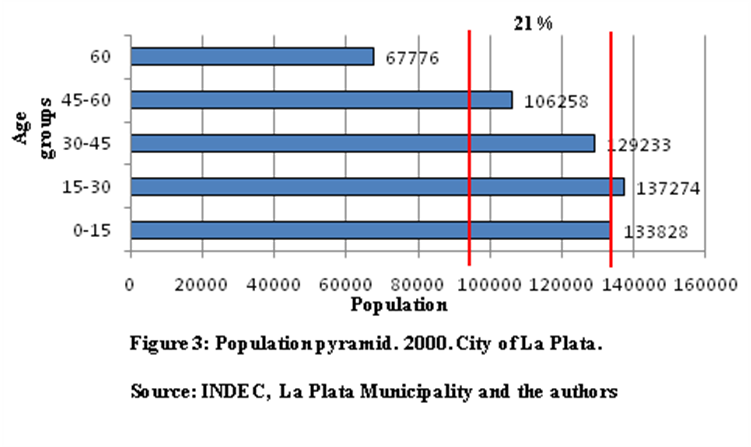 | Figure 3. Population pyramid. 2000. City of La Plata. Source: INDEC, La Plata Municipality and the authors |
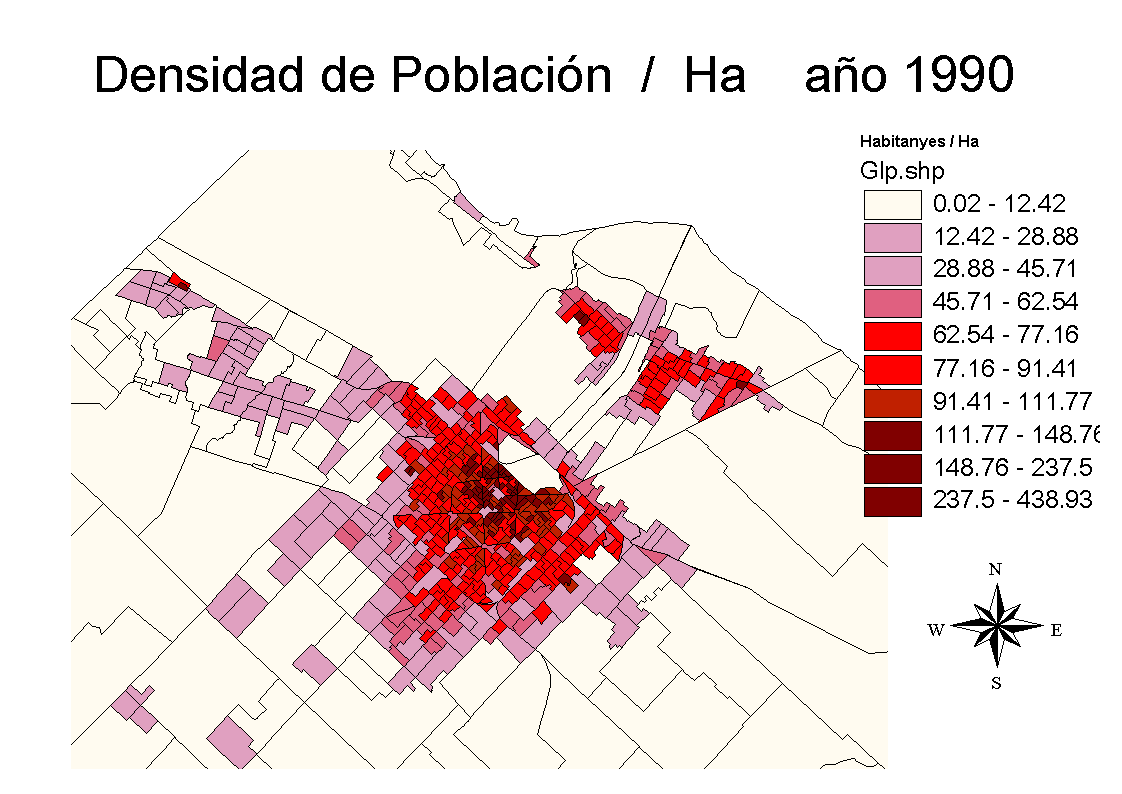 | Figure 4. Density Population/Ha in 1990. Source: Own elaboration |
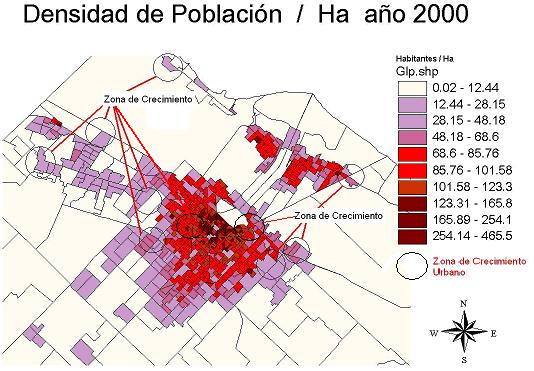 | Figure 5. Density Population/Ha in 2000. Source: Own elaboration |
2.1.2. Urban Consolidation
- We define urban consolidation as the territory occupation level and the coverage degree of basic services of infrastructure and equipment, by setting in their interaction the urban consolidation degree. Indexes and urban profiles identification based on consolidation, visualized by georeferenced maps, are part of the basic information regarding general urban-territorial aspects. To characterize the study area, statistical information was adopted as general structure and household surveys developed by our group were used[17]. Location according to the consolidation degree of the surveyed households allows comparing base maps with the declared service coverage. Figure 6 shows in a detailed way a succession of three maps disaggregated from urban density in La Plata city, and a fourth map that displays and integrates urban density in squares and services coverage. A high consolidation level is registered in the 2/3 parts of the central quarter of the city. Dispersed homogeneous areas are also observed in extended zones and concentrated ones with medium consolidations registering less consolidation areas in the periurban. These variables are complemented by those related to the family structure, allowing setting and specifying, from the land occupation, using behaviors, mainly of energy services, as well as their consequent pollution and visualization in the territory. Knowing about population energy consumption patterns, the possibility to locate them in the territory and integrate them to the maps that identify the growth profiles, will allow obtaining relevant behavior trends. These demands will be integrated into the territory, with the purpose to verify them with the infrastructure services coverage and quality levels. For this purpose we consider necessary to analyze in the residential sector variables related to the family structure, and to its socio-energetic situation.
2.1.3. Socio-energetic Structures
- In this case, we study the relationship between social aspects in relation to the family structure, the number of occupants and labor structure with the total energy consumption and its distribution in the territory. In order to characterize the area of study, household surveys, carried out by our working group, were used. These allow us to verify and compare the social structure of the area and to set usage patterns. These patterns are associated to what is called the management consumption, where some studies have verified different ways of use of the equipment between different homes and between parents and children, and even between genders[18]. According to family structure, samples record different "types" of homes and they are analyzed taking into account their conformations and frequencies. (Figure 7). The characterization of the family structure in a detailed way and the knowledge of its relative weight in the universe of analysis provide basic elements to infer patterns related to demands for services and energy inputs, which can be georeferenced in the territory. This allows to formulate, taking into account urban units (census radio, fraction, block), different situations of potential needs from the demand perspective (users of services); to formulate potential consumption profiles; and to establish relationships in the availability/unavailability of services in general. If we relate the parcels occupation with the total energy consumption considering the number of people per household; we can observe a significant and consistent increase with common and collective needs of each family.Figure 8 shows a progressive energy consumption increase in relation to the number of occupants, where a cut on the 7th inhabitant is observed. Such behavior is mainly related to simultaneous use of spaces and equipments.
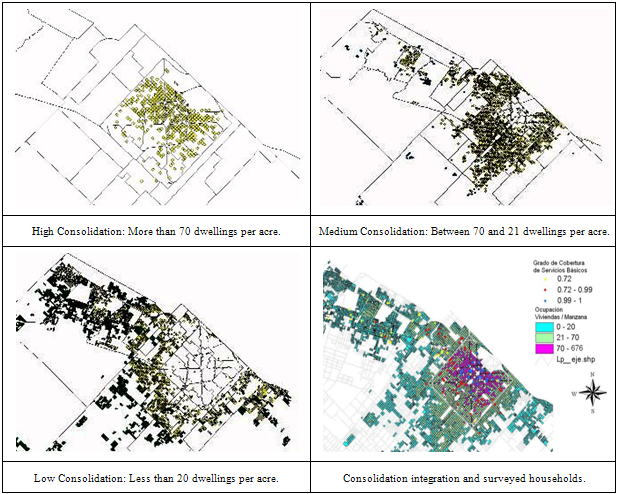 | Figure 6. Urban consolidation levels and localization of the survyed households. Source: GI1 IIPAC and own elaboration |
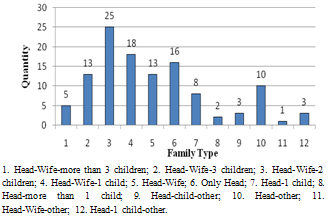 | Figure 7. Frecuency diagram of the household composition. Source: Own elaboration |
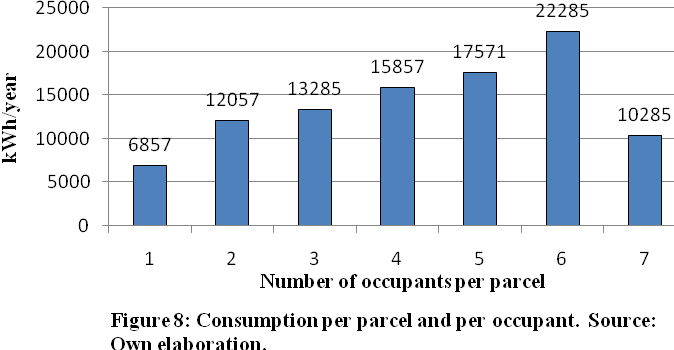 | Figure 8. Consumption per parcel and per occupant. Source: Own elaboration |
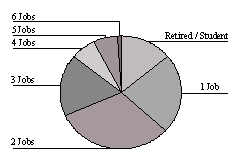 | Figure 9. Labor composition. Source: Own elaboration |
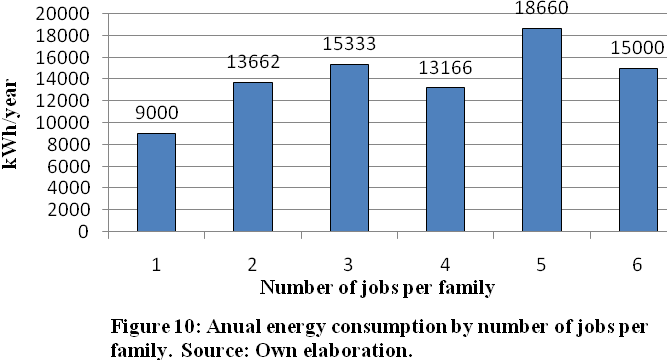 | Figure 10. Anual energy consumption by number of jobs per family. Source: Own elaboration |
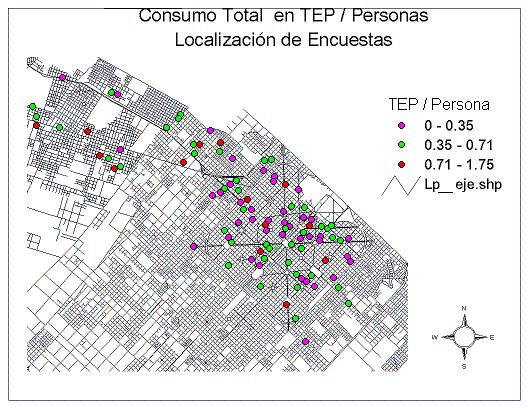 | Figure 11. Total Consumption (TOE/Inhabitant). Localization of surveyed households. Source: Own elaboration |
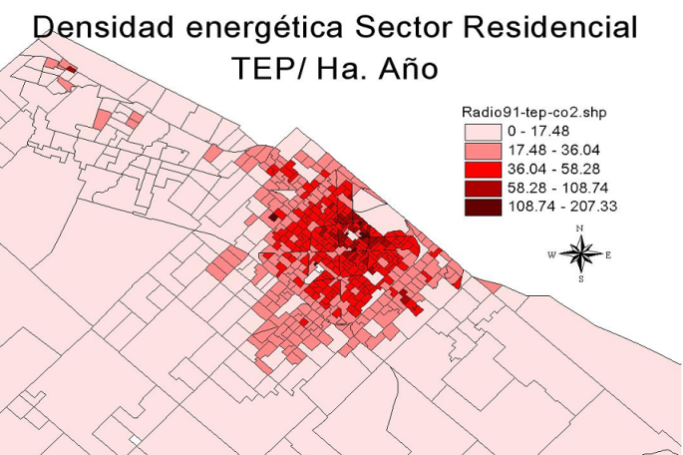 | Figure 12. Total energy density of the Residential sector per census radio. TEP/Hectare.year |
2.1.4. Environmental Consequences
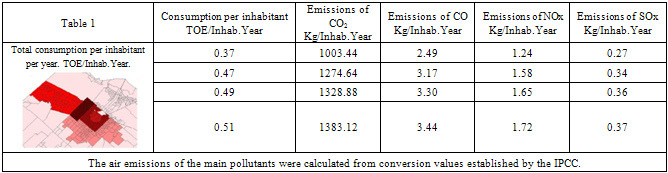
- With regard to the environmental implications, maps were calculated and built for the air primary pollutants emitted locally in the region produced by the combustion of the energy vectors predominant from the residential sector (Natural Gas and Electricity). Indirect emissions caused by electricity generation were not considered in this case as they are not generated in the region of analysis. Figures 13, 14, 15 and 16 show the emissions level of some pollutants and their location in the territory in kg of pollutant by block (Ha) and per year. Correspondence between consumption and emissions show once again the most compromised urban areas. Specific emissions per capita and per urban areas were also evaluated, taking as a reference the information of the average consumed energy. The results are displayed in Table 1, where the main primary emissions per capita and per year are shown. These values allow estimating the total disaggregated emissions in those cases where smaller urban scales are evaluated.
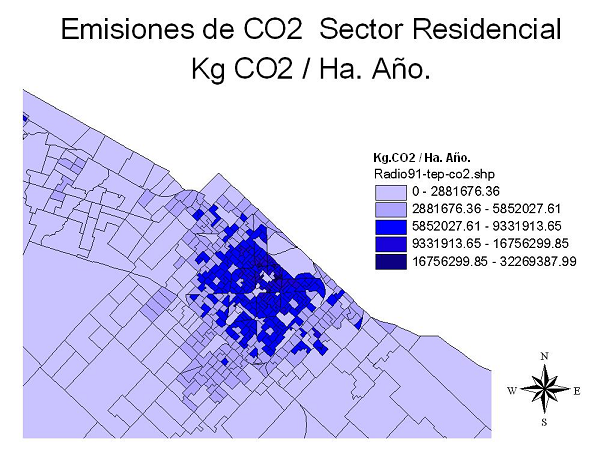 | Figure 13. Total CO2 emissions. Residential Sector. Source: Own elaboration |
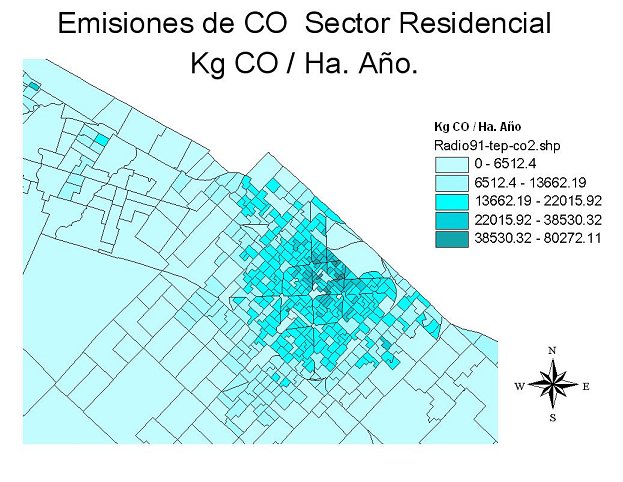 | Figure 14. Total CO emissions. Residential Sector. Source: Own elaboration |
2.2. Basic Infrastructure Services
- In this point, we propose to identify and to establish, from the use of the urban life quality model (ULQM), the interactions of basic infrastructure services from the energy point of view. The incidence of each of them in the territory is analyzed through their characteristics, their influence areas, their use and the acceptance degree of the users expressed through the opinion. The relationship between the ways of consumption and their interactions with the territory allow us to adjust the dimension and location of energy demand and to define areas of greater vulnerability. As we know the energy aspects of the residents, we can establish quality levels of available energy sources, through its qualities, (valuation attributes), coverage and disadvantages. Its location and geographical distribution allows us to compare coverage areas, and set, from the services valuation, the offer situation of each one in the territory. Results can be compared with energy demand maps, verify imbalances as well as infer viable areas to implement substitute sources and minimize the pollutants air emission. In this way vulnerabilities can be identified from the disarrangement of each network service (between offer and demand) and mainly in those sectors that use substitute energy sources as they don´t have an access to networks. The results in terms of quality offered by energy services are integrated with the socio- energetic, (demand) having the territory as a support. This integration allows identifying clearly the imbalances between services and their users maintaining the origin of its causes. Energy services commonly used in the study area are:
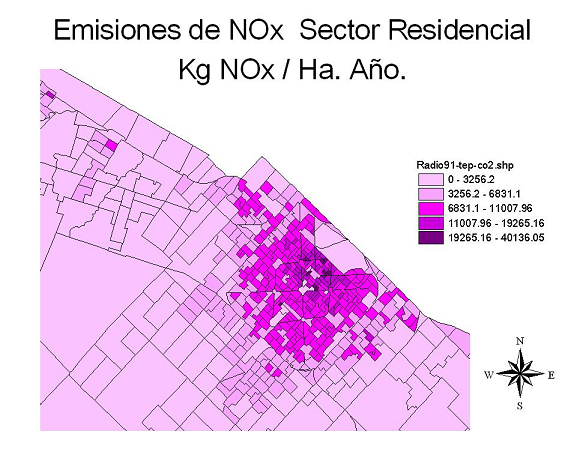 | Figure 15. Total NOx Emissions. Residential Sector. Source: Own elaboration |
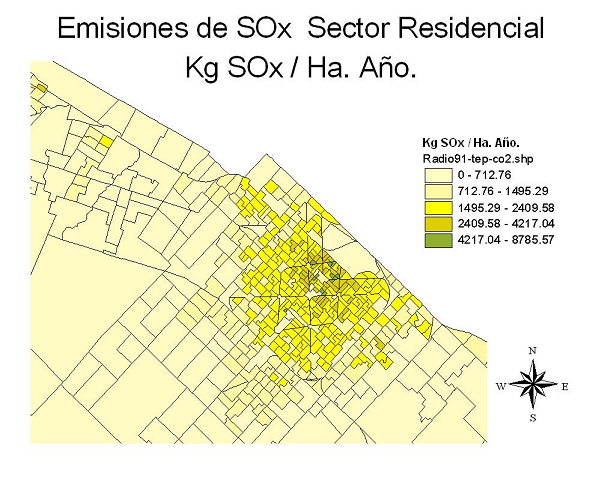 | Figure 16. Total SOx Emissiones. Residential Sector. Source: Own elaboration |
2.2.1. Electricity Service (E)
- To evaluate the electricity service, quality was defined, by means of an analysis that intervenes: evaluation of its qualities, from relative weightings, considering different energy sources used in the study area; the territorialisation of its coverage or surrounding area and the degree of acceptance of the users through its opinion.
|
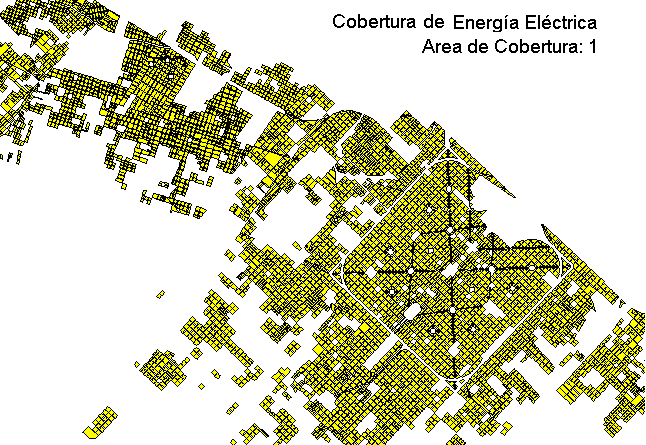 | Figure 17. Electricity coverage. 100% coverage. Source: Own elaboration |
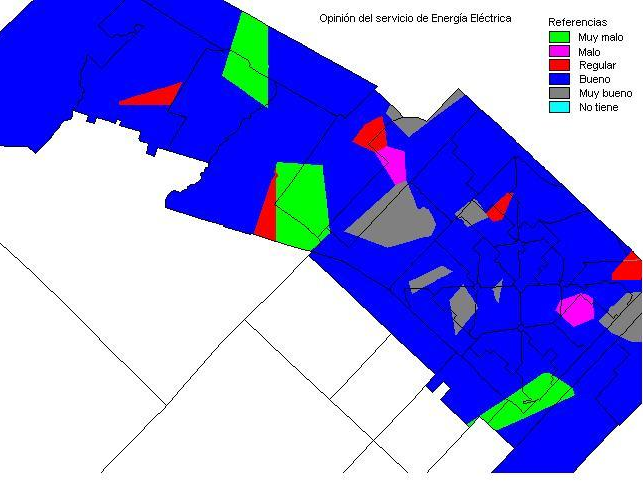 | Figure 18. Homogeneous areas of opinion. Electricity network. Source: Own elaboration |
2.2.2. Natural Gas Service (NG)
- The evaluation of this service in the ULQM, is performed under the same criteria explicit in the electricity service. In a similarly way, we qualify this energy source through evaluating their qualities, its corresponding covering factor of the network, and with the level of user acceptance. In relation to the qualities of the natural gas service, we consider the same ones as in the electricity service, and their evaluation responds to the same criteria. With respect to the coverage area, its distribution network currently affects 87% of the consolidated population. (Figure 20). The acceptance degree of natural gas service was evaluated through the general opinion of the users, where the household survey was statistically processed and the sample territorially expanded, obtaining a normalized opinion factor which is shown in Figure 21.
 | Figure 19. Quality of Electricity Service. Inequalities coincidences. |
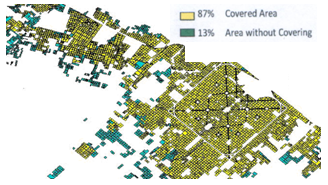 | Figure 20. Natural Gas Coverage. 87% coverage. Source: Own elaboration. |
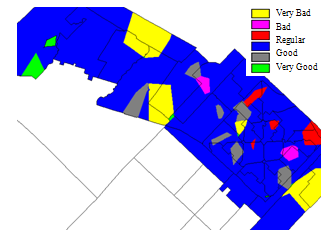 | Figure 21. Homogeneous areas of opinion. Natural Gas network. Source: Own elaboration |
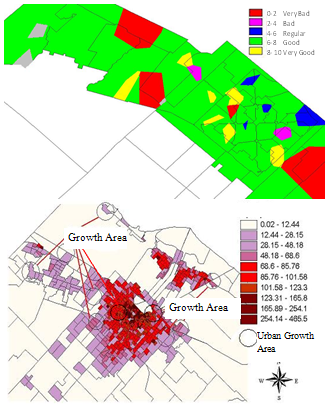 | Figure 22. Quality of Natural Gas Service. Inequalities coincidences. Source: Own elaboration |
3. Conclusions
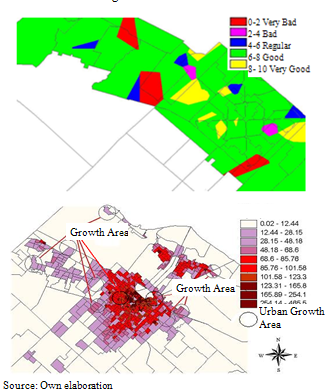
- The results obtained show that the proposed methodology is effective in relation to the evaluation of urban areas and their services, demonstrating sensitivity of resolution in obtaining qualified information and the conformation of descriptive homogeneous areas of each situation. The results visualized on maps show urban equity and inequity trends in each of the valued areas, and its boundaries depend on the location of the primary information. On the other hand, the provided tools (indexes, profiles, maps) allow us to locate the behavior trends of each service infrastructure (Electricity and Natural Gas) in quality terms, to verify and identify the different aspects through the meaningful participation of the demand (users) through the opinion, and to identify urban vulnerability degrees. The outputs obtained in this case for each energy service have allowed identifying the first quality profiles. Its localization in the territory makes possible the identification of homogeneous areas. The disaggregation of each one can be checked with the population maps (Figure 5) and with the consequent energy demand of the inhabitants of the same urban area. (Figure 19, 22). Matches were verified between those sectors undergoing inequities in its offer, with those that register growth in population and unforeseen demands. This situation can be justified, as the existing layings, many of them to the limit of their burdens, present different problems of supply, affecting each service offering. In relation to the environmental consequences, in particular those relating to emission energy source, the analysis allow to identify areas with greater vulnerability in line with the sectors of greatest urban consolidation. Therefore we understand that through this methodology we can verify that excessive or unanticipated urban growth will continue collapsing to energy services in its most vulnerable areas, highlighting the need to analyze in the future, possible attractors, in order to know more accurately growth trends and to start planning the supply.