-
Paper Information
- Next Paper
- Paper Submission
-
Journal Information
- About This Journal
- Editorial Board
- Current Issue
- Archive
- Author Guidelines
- Contact Us
Resources and Environment
p-ISSN: 2163-2618 e-ISSN: 2163-2634
2012; 2(3): 82-86
doi: 10.5923/j.re.20120203.01
Heavy Metal Assessment of Ground, Surface and Tap Water Samples in Lagos Metropolis Using Anodic Stripping Voltammetry
 Abstract
 Reference
 Full-Text PDF
 Full-Text HTML
Ehi-Eromosele C. O 1, Okiei W. O 2
1Department of Chemistry, Covenant University, P.M.B. 1023 Ota, Nigeria
2Department of Chemistry, University of Lagos, Nigeria
Correspondence to: Ehi-Eromosele C. O , Department of Chemistry, Covenant University, P.M.B. 1023 Ota, Nigeria.
| Email: |  |
Copyright © 2012 Scientific & Academic Publishing. All Rights Reserved.
The levels of heavy metal contamination in surface, ground and tap waters collected in some part of Lagos metropolis were determined using Differential Pulse Anodic Stripping Voltammetry (DPASV). The samples were analysed for their contents of lead, copper and cadmium and were also compared with the WHO (2008) specified contaminant levels for drinking water. The results obtained showed that all the well water and borehole water samples investigated contain high concentration of these heavy metals. Lead and cadmium concentrations were found to be above the WHO maximum acceptable concentration (MAC). However, none of the samples had copper concentration above the WHO MAC for copper. On the whole samples analysed, only the sample collected from Odo-Iyaalaro stream, Ojota showed no pollution of lead. Other samples showed pollution of all of the metals analysed. In general, the results show an indication of pollution hazards given the toxicity of these metals and mostly when the water sources studied represent the major sources of water for the teeming populace. DPASV results of the samples investigated were found to be comparable with results of same samples obtained from independent work carried out by Atomic Absorption Spectroscopy.
Keywords: DPASV, Heavy Metals, Surface Water, Ground Water, Maximum Acceptable Concentration and WHO
Article Outline
1. Introduction
- Water resources in Lagos state, Nigeria for domestic, industrial and commercial use are becoming scarce as a result of pollution of water bodies by heavy metals and other contaminants[2]. Heavy metal contamination of ground, stream and river water ecosystem is a worldwide environmental problem[3] and between the wide diversity of contaminants affecting water resources, heavy metals receive particular concern considering their strong toxicity even at low concentrations[4]. Heavy metals are persistent environmental contaminants, and are at least five times denser than water. As such, they cannot be metabolized by the body and are stable and bio-accumulative[5]. These toxic metals are sometimes passed up the food chain to humans. They have toxic effects on the environment and life in aquatic system too. These metals include mercury, nickel, lead, arsenic, cadmium, aluminium, platinum and copper (metallic form and ionic form).Lead is one such heavy metal and the most common of these elements. It is a general metabolic poison and enzyme inhibitor. It can cause mental retardation andsemi-permanent brain damage in young children. Lead has the ability to replace calcium in bone to form sites for long-term replacement[5]. Heavy metals like copper are the essential trace elements but show toxicity in excess amounts. With increasing industrial use, environmental pollution and associated toxic exposure, concern has increased about their long term exposure and potentially toxic effects on human health specially infants and young children which are at peak of growth[6,7]. Cadmium is extremely toxic even in low concentrations, and will bio-accumulate in organisms and ecosystems and it has a long biological half-life in the human body, ranging from 10 to 33 years[5]. Long term exposure to cadmium also induces renal damage[8]. So cadmium is considered as one of the priority pollutants form monitoring in most countries and international organizations.Thus, there is the need to continuously assess the quality of ground and surface water sources. That’s why a matter of great importance is to analyze and quantify these toxic agents in the environment. In this regard, methods of analysis play an important role[9]. Atomic Absorption Spectrophotometer (AAS) technique has been widely accepted as the standard technique for metals determination since they offer satisfactory sensitivity and fairly low acquisition cost [5,10]. However, the majority of equipments can measure only one element at a time. Inductively coupled plasma optical emission spectrometry (ICP-OES), on the other hand, offers multi-element analysis[5,11] but this technique is not yet extensively used in under developed countries due to their high implementation and maintenance costs[5]. These constraints justify the search for improved methods and suggest that the electrochemical analytical method for metal ions is still indispensable. Some advantages of electroanalytical methods can be pointed out for the analysis of metal ions such as high sensitivity, selectivity, simultaneous determination, simplicity and relatively low cost[5,12].Anodic stripping voltammetry (ASV) is an established method for trace metal ion analysis in contaminated water samples. ASV involves a two-step measurement sequence: (i) electro-reducing the ions at a negative potential to form metal deposits on the electrode surface, thereby pre- concentrating the analytes, and (ii) selectively electro-oxidizing each metal during a slow potential scan toward positive potentials[13]. The method, when coupled with an appropriate electrode material, generally provides low detection limits for many metal ions with a wide linear dynamic range and good response precision.The aim of this study is to assess the levels of heavy metals in tap, ground and surface water sources in some parts of Lagos metropolis using an alternative quantitative technique. With the aid of Differential Pulse Anodic Stripping Voltammetry (DPASV) the presence and concentration of three heavy metals (Cu, Cd and Pb) were determined and the results obtained compared to the maximum contaminant level specified by the World Health Organisation.
2. Material and Methods
- All chemicals and reagents were of the analytical grade and were obtained from BDH chemicals Ltd, UK. Copper sulphate, cadmium sulphate and lead sulphate were used for preparation of copper, cadmium and lead standards respectively. Mercury nitrate solution was used as the thin mercury film electrode. Acetate buffer at pH 4.5 and KCl were used as supporting electrolyte during DPASV run. De- ionised water was used throughout the work. All the plastic and glass wares were cleaned by soaking in 10% HNO3 solution and then rinsed with distilled water prior to use. NaOH (0.1 M), HCl (0.1 M) were used to adjust pH of the working solutions. HNO3 was used for the treatment of samples and preparation of mercuric nitrate solution. H202 was used in preparing pyrana, a solution used in the cleaning of the working electrode. Nitrogen gas was used to remove traces of oxygen in the sample before each DPASV run.
2.1. Sample Collection and Treatment
- Water samples were randomly collected from 8 sampling sites. They were collected by immersion of pre-cleaned, acid-soaked plastic cans below the water surface for the surface and well water samples and directly from the tap for the bore hole and tap water samples. The water samples were well mixed with 2mL concentrated HNO3 per litre sample and capped tightly until they were ready for analysis. The samples sites are shown in Table 1.
2.2. Preparation of Reagents
- 1000ppm of stock solution of Pb, Cd and Cu were prepared by dissolving 1.342, 2.495 and 3.929g of PbCl2, CdSO4.4H2O and CuSO4.5H2O respectively in a 1L of volumetric flask. The mixture was shaken and the flask made up to the 1L mark. Calibration solutions of the target metal ions were prepared from the standard stock by serial dilution. 0.1 moldm-3 acetate buffer at pH 4.5 was prepared by measuring 8.2g sodium acetate in 800ml deionised water. The pH was adjusted with high purity glacial acetic acid. The solution was transferred to a 1L volumetric flask and then made to the mark. 0.01 moldm-3 mercury nitrate solution was prepared by accurately weighing 3.25g mercury nitrate and dissolving first with 0.01moldm-3 HNO3 in a beaker and then deionised water. This solution was transferred to a 1L standard flask and made up to the mark with deionised water.
2.3. Analysis of Samples
- A three electrode system cell was used for all the electrochemical measurements, along with a computer- controlled potentiostat (Model Basi Epsilon EC version 1.0). A platinum rod was used as the counter electrode, and a commercial Ag/AgCl electrode (saturated KCl) served as the reference ( = −0.045 V versus SCE). The working electrode was a glassy carbon electrode. All measurements were made in solutions deoxygenated with N2 for at least 3 min, initially, and then usually for at least 2 min after each anodic stripping or oxidation cycle. Calibration curves of the metal standards were determined by DPASV. 3ml of the buffer, 2ml of the electrolyte, 0.1ml of the mercury solution and varying volumes of the working metal standards were carefully measured into the voltammetric cell. The solutions were blanketed with the gas during all measurements. All measurements were made in a stirred solution. The typical differential pulse voltammetric settings were (i) a 2 min deposition time, (ii) a 0.5 min “quiet” time prior to initiation of the anodic sweep, (iii) a 50 mV pulse height, 0.2s pulse period, 50 ms pulse width, (iv) 0.02 V/s scan rate, initial potential of -1.3V and (iv) a constant potential of 600 mV for 120s after completion of the anodic sweep to fully oxidize all metal deposits prior to the next measurement. The stripping current was monitored and recorded. A calibration plot of the stripping current against the concentrations of the metal standards was made. The various raw water samples were determined and their concentrations extrapolated from the calibration plot made. Prior to deposition of the metal adlayer, the glassy carbon was polished under very clean conditions using a series of alumina slurries (1.0, 0.3, and 0.05 μm). The electrode was rinsed and ultrasonicated with ultrapure water between each polishing step to remove polishing debris. As a final pretreatment step, the polished electrode was soaked for 20 min in pyrana solution prior to use. Following each deposition and stripping cycle, the electrode was removed from the cell and the surface wiped clean with a kimwipe. All measurements were made at room temperature. The water samples were analysed in triplicates with the average concentration of the metal present being displayed in mg/L by the instrument after extrapolation from the standard curve.
3. Results and Discussion
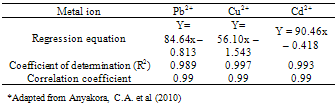
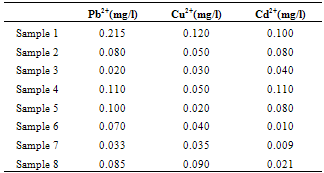
- Calibration curves were obtained using a series of varying concentrations of the standards for the three metals. All 3 calibration curves were linear with a correlation coefficient ranging from 0.993 to 0.997. Table 2 shows the regression data for the calibration plots. Table 3 shows the level of the metals in the studied water samples. Figures 1-3 show the differences between lead, copper and cadmium concentrations in samples and World Health Organisation Maximum Contaminant Level for the metals. In this study, the concentration of Pb, Cu, and Cd were successfully determined in the water samples by DPASV technique. Pb, Cu and Cd were obtained at average peak potentials of about 0.55V, 0.28V and 0.75V respectively. The peak potentials of Pb, Cu and Cd for the standards and samples were not obtained at a definite potential characteristic of the metals but at varying close potentials to it. This might be due to the presence of impurities in the form of more than one metal ion in the sample which leads to the formation of inter-metalic compounds. This may shift or distort the stripping peaks for the metals of interest [14, 15].For the protection of human health, guidelines for the presence of heavy metals in drinking water have been set by different International Organisations such as USEPA, WHO, EPA, and the European Union Commission[4,16]. Thus, heavy metals have maximum acceptable concentration in drinking water as specified by these organizations. Maximum acceptable concentration (MAC) is an enforceable standard set at a numerical value with an adequate margin of safety to ensure no adverse effect on human health. It is the highest level of a contaminant that is allowed in a water system[16]. The three elements studied in this research work namely: Copper, Cadmium and Lead have Maximum acceptable concentration of 1.5 mg/L, 0.003 mg/L and 0.01 mg/L respectively in drinking water and 1.5 mg/L, 0.01 mg/L and 0.1 mg/L respectively for surface waters[17].
|
|
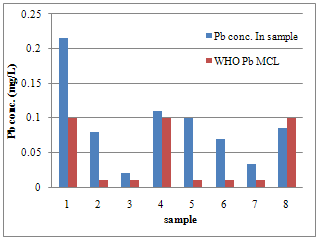 | Figure 1. Differences between Pb concentration and WHO MCL for Pb in samples |
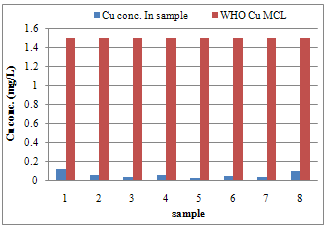 | Figure 2. Differences between Cu concentration and WHO MCL for Cu in samples |
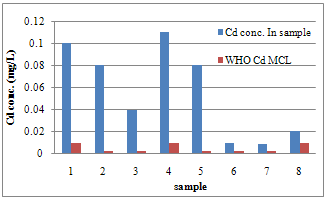 | Figure 3. Differences between Cd concentration and WHO MCL for Cd in samples |
4. Conclusions
- The sources of water studied represent the major sources of water in Lagos metropolis. There is need for constant water quality monitoring of the various sources of water as the results showed levels of pollution signaling that a major proportion of the populace are at a significant risk given the toxicity of these metals. These results by DPASV are also comparable with those carried out with Atomic Absorption Spectroscopy from independent work[16,21,22].
References
| [1] | WHO Guidelines for drinking - water Quality 3rd Edition incorporating the first and second agenda volume 1 Recommendations, (World Health Organizations, Geneva, 2008). |
| [2] | K.O. Iwugo, B. D’Arcy and R. Andoh, presented at the Diffuse Pollution Conference, Dublin 2003 (unpublished) |
| [3] | K. Sekabira; H. Oryem Origa; T. A. Basamba; G. Mutumba and E. Kakudidi, Int. J. Environ. Sci. Tech., 7 (4), 759-770, (2010) |
| [4] | J.E. Marcovecchio, S.E. Botte and R.H. Freije, Heavy Metals, Major Metals, Trace Elements. In: Handbook of Water Analysis 2nd Edn., edited by L.M. Nollet, (CRC Press, London, 2007), pp: 275-311. |
| [5] | Z. Es’haghi, M. Khalili, A. Khazaeifar and G.H. Rounaghi, Electrochimica Acta 56 (9), 3139-3146, (2011) |
| [6] | K.S. Min, S. Onosaka and V. Tanaka, Toxicol. Appl. Pharmacol. 141, p. 102 (1996) |
| [7] | R.K. Mahajan, T.P.S. Walia and K. Sumanjit, J. Health Allied Sci. 4 (2005) |
| [8] | U. Celik and J. Oehlenschlager, Food Control 18 (2007) |
| [9] | A.V. Znoeva, Masters Thesis, Department of Chemistry, Lulea University of Technology, Sweden. (2006) |
| [10] | C.R.T. Tarley and M.A.Z. Arruda, Anal. Sci. 20, p. 961 (2004) |
| [11] | N.G. Becka, R.P. Franks and K.W. Bruland, Anal. Chim. Acta 455, p. 11 (2002), |
| [12] | A. Cobelo-Garcia and A.P. Prego, Anal. Chim. Acta 524, p. 109 (2004), |
| [13] | J. Wang, Stripping Analysis: Principles, Instrumentation and Applications, (VCH, Florida 1985), pp 130-136. |
| [14] | APHA-AWWA-WPCF Standard methods for the ex amination of water and wastewater 15th edition, Edited by E.G. Anold, J.C. Joseph and J. David (Donelley RR and Sons Company, U.S.A, 2005) p. 547. |
| [15] | S.P. Kounaves, Voltammetric Techniques. In: Handbook of Instrumental Techniques for Analytical Chemistry, (Oxford University Press, London, 1989), pp 710-716. |
| [16] | C.A. Anyakora and M.A. Momodu, Research Journal Environmental and Earth Sciences 2(1): 39-43, (2010)[16] G.D. Acharya, M.V. Hathi, A.D Patel and K.C. Parmar, E-J. Chem 5 (4) pp 792-796, (2008) |
| [17] | http://www.e-journals.in/PDF/V5N4/792-796.pdf. |
| [18] | Darthmouth Toxic Metal Research Programme, 2001. A program of Centre for Environmental Health Science at Darthmouth. http://www.darthmouth.edu/toxmetal/TXQAcu.shtml |
| [19] | C.O. Ehi-Eromosele, M.Sc Thesis, University of Lagos, Nigeria, 2010. |
| [20] | Drinking water, Northern region - A report by the Chief Inspector of Drinking Water, Drinking Water Inspectorate (Drinking Water Inspectorate, London, 2008) http://www.dwi.gov.uk |
| [21] | O.J. Aderinola, E.O. Clarke, O.M. Olarinmoye, V. Kusemiju and M.A. Anatekhai, J. Agric. & Environ. Sci., 5 (5): 609-617 (2009) |
| [22] | Oyeyiola A.O, PhD Thesis, University of Lagos, Nigeria, 2006 |