-
Paper Information
- Previous Paper
- Paper Submission
-
Journal Information
- About This Journal
- Editorial Board
- Current Issue
- Archive
- Author Guidelines
- Contact Us
Resources and Environment
p-ISSN: 2163-2618 e-ISSN: 2163-2634
2012; 2(2): 67-72
doi: 10.5923/j.re.20120202.10
Assessment of Fluoride Concentrations in Surface Waters and Groundwater Sources in Northeastern Nigeria
 Abstract
 Reference
 Full-Text PDF
 Full-Text HTML
Maimuna Waziri 1, Umar Musa 2, Stephen S. Hati 3
1Department of Chemistry, BAI University, Damaturu, Nigeria
2Department of Pharmaceutical and Medicinal Chemistry, ABU, Zaria, Nigeria
3Department of Chemistry, IBB University Lapai, Nigeria
Correspondence to: Stephen S. Hati , Department of Chemistry, IBB University Lapai, Nigeria.
| Email: |  |
Copyright © 2012 Scientific & Academic Publishing. All Rights Reserved.
Drinking water is a major source of Fluoride intake, which at certain concentration is the cause of Fluorosis. The disease is preventable by having passable knowledge of fluoride sources, concentration levels and management technique. This study was aim at presenting concentration levels of Fluoride (F) in drinking water sources from this region of northeastern Nigeria where cases of dental fluorosis have been reported. Samples of surface water and groundwater were analysed by the colorimetric SPADNS METHOD (CODE 3647-01-SC). Results revealed that F concentrations in surface water ranges between 0.03mg/L and 2.07mg/L, while in groundwater this ranges between 0.02mg/L and 2.42mg/L. The results also revealed up to 43% of sampling points within a location showing high F concentrations (≥1. 5mg/L) in groundwater. This is beyond the permissible limits set by World Health Organization. Since groundwater is a major source of drinking water in this region, the hazards posed by high F concentrations in this region still remains and would require constant monitoring and effective implementation of management practice to curtail.
Keywords: Fluoride, surface water, groundwater, SPADNS Method, fluorosis
Article Outline
1. Introduction
- Drinking water is a major source of fluoride[1]. Fluoride is found in both surface waters and groundwater, because quantities of fluoride compounds in the earth's upper crust are soluble in water[2, 3]. However, factors responsible for the natural concentration of fluoride in groundwater are the physical, geological and chemical distinctiveness of the aquifer, the porosity and acidity of the soil and rocks, the temperature, the action of other chemical elements and the depth of wells[1, 4].Fluoride, at certain concentration levels, has been implicated in the several forms fluorosis (1.5 – 2 mg/l dental fluorosis, >4 mg/l dental and skeletal fluorosis; >10 mg/l crippling fluorosis). Higher doses have also been linked to cancer[5, 6]. Fluorosis in relation to fluoride has also been reported around the world[7] and in Nigeria[8, 9]. Hence the need for its global monitoring in both surface and groundwater[10, 11, 12].Fluorosis is preventable by having passable knowledge of the fluoride sources, concentration levels and management technique. Thus the aim of this study is present concentration levels of Fluoride (F) in drinking water sources from this region of northeastern Nigeria where cases dental fluorosishave been reported. Significantly also is the fact that this area is faced with problem of water supply particularly during the dry season, when the alternative to insufficient supplies is hand – dug wells and reservoirs[13].
2. Materials and Methods
2.1. Study Area
- The study area comprises of locations spanning across Borno and Yobe States in North-eastern Nigeria (Figure 1). Borno and Yobe States are the two most north easterly states of the Federal Republic of Nigeria and lie between 10o and 14o north of the equator and 10o and 15o east of the Greenwich Meridian; an estimated area of 117,000 sq kms. According to the National Population Commission[14], the two states have a combined population of 6472784 people.
 | Figure 1. Map showing sampling locations in North-eastern Nigeria |
2.2.1. Climate
- The climate is semi-arid with wide seasonal and diurnal temperatures. A long dry season is followed by a single wet season. The hottest months are March and May. The cold and dry dust-laden north easterly Harmattan winds prevail from November to March, with significant diurnal temperature fluctuations and extremes of temperature[15]. The mean annual rainfall varies between 1000-500 mm from south to north. Rainfall is seasonal with a wet season occurring from July to September. Recent years have seen decreasing rainfall totals[16] and drought is becoming a frequent problem in the area. The mean annual temperature is around 25oC[17]. The vegetation is mainly savannah grasslands but the physical stress of overgrazing and deforestation due to demands for firewood has caused widespread grassland degradation and desertification. Sand dunes are common[18].
2.1.2. River System and Geology
- There are no major perennial rivers that rise and discharge wholly within the borders of the study area. The major sources of surface water in the area are the rivers of Bama Hills and Lake Alau, the sources of feed water for the Maiduguri Water Treatment Plant in Borno state. The Kumadugu-Yobe River from which the State derived its name is a major source of surface water in Yobe State. It is formed by the confluence of the Hadejia and Jama’are Rivers and is downstream at Gashua. The Jama’are River which receives water from the Iggi, Dogwalla, Katagum and Bunga Rivers near Jos is the more efficient conveyor of water to the Yobe River compared to the Hadejia River[19]. The wetlands of Kumadugu-Yobe River around Gashua and Nguru are associated with the flood plains surrounding the river.The water table in wetlands is at or near the surface and the land is often covered with shallow water. The shallow aquifers are potentially vulnerable to pollution except where surface layers are of poor permeability and give some protection to the underlying aquifers[20].Geologically, the study area falls within the Chad Basin sedimentary formation. The water bearing zones within this formation are well demarcated, and described as upper, middle and lower aquifers[21]. The upper zone is known to have a depth limit of 105 meters below ground level in Maiduguri and had met the water supply demands of the town in the late 1960s. The upper and middle aquifers are exploited intensively in the Maiduguri area[22], mostly by hand-dug wells and boreholes, to a maximum depth of 150 meters. The sediments of the middle aquifer consist of fine to medium coarse grained sands and its depth varies from 250 – 400 meters[23]. The lower aquifer which is the third aquifer in the Lake Chad formation yields more water than the upper and middle aquifers. Its depth varies from 450-700 meters below ground level. The water in this aquifer is hot (45-50 oC). The aquifer is also extensively exploited[24]. Over-exploitation of the aquifers in Chad Basin has led to a recent decline in ground water levels[25, 26].
2.2. Water Sampling and Preparations
- Water sampling in this study consisted of samples of water that are utilized by man, animals and plants. Therefore surface water samples included samples from River basins, reservoirs, Municipal tap water supply. Groundwater samples included samples from hand pumps/boreholes and wells. Sampling methodologies are as described by[27]. Sampling was conducted routinely in duplicates of both wet (July-October) and dry (January-April) seasons at each location in the years 2008 and 2009. A total of 239 samples were collected in sterile plastic bottles. Samples and blank preparations were carried out as described in LaMotte[28].
2.3. Determination of Fluoride
- The colorimetric SPADNS METHOD (CODE 3647-01-SC) detailed in LaMotte[28] was used in the determination of fluoride concentrations in the water samples, using the programmed spectrophotometer (SMART® Spectro, USA). The procedure and reagent system consisted of the approved EPA method 4500-F-D for fluoride[29]. Determination was achieved at 570 nm wavelength by measuring the absorbance of an initial complex between zirconium ion and the dye, Trisodium 2-(4-sulfophenylazo)-1, 8-dihydroxynaphthalene-3, 6-disulfonate (SPADNS) and the subsequent bleaching of the complex due to reaction with fluoride ion. Considering the range 0.00-2.00ppm detection limit, dilution factors were noted in the estimation of final concentration in overage samples. The day-to-day (inter-assay) precision was checked by the analysis of 6 replicates each day.
2.4. Data Analysis
- Results obtained were analysed on a coupled Microsoft Excel+Analyse-it® v. 2.22[30] software and presented as mean ± standard deviations. Inferential significance in variations were considered at p<0.05.
3. Results
3.1. Surface Water
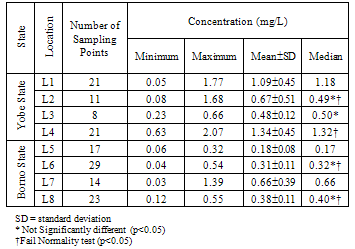
- Table 1 presents the summary results of Fluoride (F) concentrations in the surface water samples analysed. The results revealed varying number of sampling points within each location and wide F concentration variations between locations. Thus, the maximum concentration of F in surface water was recorded at L7 (0.03mg/L) and the minimum at L4 (2.07mg/L). The respective median concentrations are also presented with indications of locations that fail to satisfy the Shapiro-Wilk’s normality tests (p<0.05). Kruskal-Wallis tests with Bonferroni post-hoc error protection for differences in concentrations of F between locations revealed that about 50% of the paired tests showed significance (p<0.05).An overall assessment of the observations also indicated that the average F concentrations in surface water was higher in Yobe State (1.02mg/L) than in was recorded in Borno State (0.37mg/L)
|
|

3.2. Groundwater
- The summary results of Fluoride (F) concentrations in the groundwater samples analysed are shown on Table 2. Similar to the results of surface water, the results revealed varying number of sampling points within each location and wide F concentration variations between locations.The maximum concentration of F in groundwater was recorded at L8 (2.42mg/L) and the minimum at L5 (0.02mg/L). Tests for significance (Kruskal-Wallis) in concentrations of F between locations revealed that about 25% of the paired tests was significant (p<0.05).Generally, the average F concentrations in groundwater was also higher in Yobe State (0.90mg/L) than in Borno State (0.70mg/L)
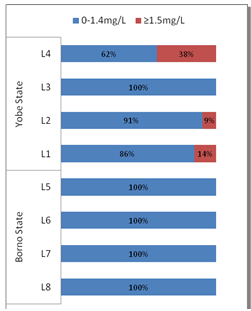 | Figure 2. Proportion of sampling points indicating Fluoride concentrations (≥1.5 mg/L) in Surface Water at the different Locations |
 | Figure 3. Proportion of sampling points indicating Fluoride concentrations (≥1.5 mg/L) in surface water at the different locations |
4. Discussion
- Representative sampling is important for monitoring purposes and making reliable decision[27]. Sampling points varied in this study due to the natural variance in the sources of water available at the time of study. Therefore sampling was adapted to the peculiarity of location and also to be able to capture representation of analyte. Generally F concentration was found to be higher in groundwater than in surface water samples. This supports the findings in Gikunju[11] that the natural concentration of fluoride depends on the geological[2], chemical and physical characteristics of the aquifer, the porosity and acidity of the soil and rocks, the temperature, the action of other chemical elements, and the depth of wells. Because of the large number of variables, the fluoride concentrations in groundwater can range from well under 1 ppm to more than 35 ppm. In Kenya and South Africa, the levels can exceed 25 ppm. In India, concentrations up to 38.5 ppm have been reported[1, 4].The average F concentrations in surface water was higher in Yobe State than in Borno State could not have been the result of fluoridation of public water supply because such similar F concentrations were previously reported for waters from streams around the dam site[25]; which is the source of raw water for the treatment plant. However, the reserve was the case for groundwater averages between the two states. Also, out of the four locations with marked significance in the variations between locations, the highest was in Yobe State. This clearly defines the source aquifers and consistent with the current extent F contaminations of the aquifers in the Chad Basin region[25, 26]. The shallow upper aquifers are prone to contamination; but the underlying aquifers are protected and relatively free of F as observed by Sangodoyin[20]. The occurrence of isolated high values are also likely due to certain periods in the dry season when there was least dilution due to rainfall may also be a significant factor in the pattern of variations recorded. These periods were incidentally associated with high temperatures and the periods of large intakes of water in the region. This was the expected pattern of F concentrations in the deeper aquifers[26]. In other parts of Nigeria, data available on groundwater F concentrations seems to suggest that most aquifers have low or acceptable F concentrations[31, 32], but this could be detrimental to health because of the link between low dietary F intakes and dental caries[33, 34, 35]. On the other hand, studies on fluorosis in Kenya have reported high levels (2.0-20.9 mg/L) of F in borehole waters in many parts of Kenya[36, 37]. An early study on dental fluorosis in Maiduguri reported a 15.8% prevalence of moderate degree of mottled enamel for well waters containing F concentrations ranging from 0.1 – 1.2 mg/L[39]. In the same area later investigators have found F concentrations of up to 5.6 mg/L in groundwater aquifers[25, 26]. In this study, the difference in range could be the result of difference in locations, the enhanced sampling area and extended duration of sample collection carried out in the present study. Generally, in areas where good quality management systems are in place the levels of F found in drinking water, whether in its natural state or after treatment, are always below the permissible maximum levels stipulated by the World Health Organization and the Water Pollution Control Regulations of the respective countries[39]. Since groundwater is a major source of drinking water in this region, the hazards posed by high ((≥1. 5mg/L) F concentrations in this region still remains and would require constant monitoring and effective implementation of management practice to curtail.
5. Conclusions
- This study revealed considerably high proportions of sampling points with F concentration greater than the tolerable limits, especially in groundwater and in Yobe State.There is a need to implement sound monitoring and abatement programme in this region.
ACKNOWLEDGEMENTS
- We are indebted to the Zonal Laboratory of the National Food Drug Administration and Control, Maiduguri for supporting the analysis of water samples.